Return on investment
What the development earns against what it costs to build. The income side is a schedule whose columns and lines are yours; the return is a summary you build row by row; sensitivity analyses vary any of those rows to find break-even; and charts draw whichever of them you choose, laid out as you choose.
What the tab is for
A viability is the estimate turned round: the total project cost the other tabs arrive at, set against the income the finished building brings in. No two practices lay that out the same way. One deducts agent's commission before VAT, one carries the land at a residual, one wants profit on cost and profit on income side by side, one has no VAT line at all.
So the tab does not decide the layout for you. Like the area schedule, it gives you rows you name and formulas that refer to them — and to the figures the rest of the estimate already knows. A standard layout is one click away if you want to start from there.
The return on investment belongs to one estimate version, as the area schedule does.
Four tabs and a rail
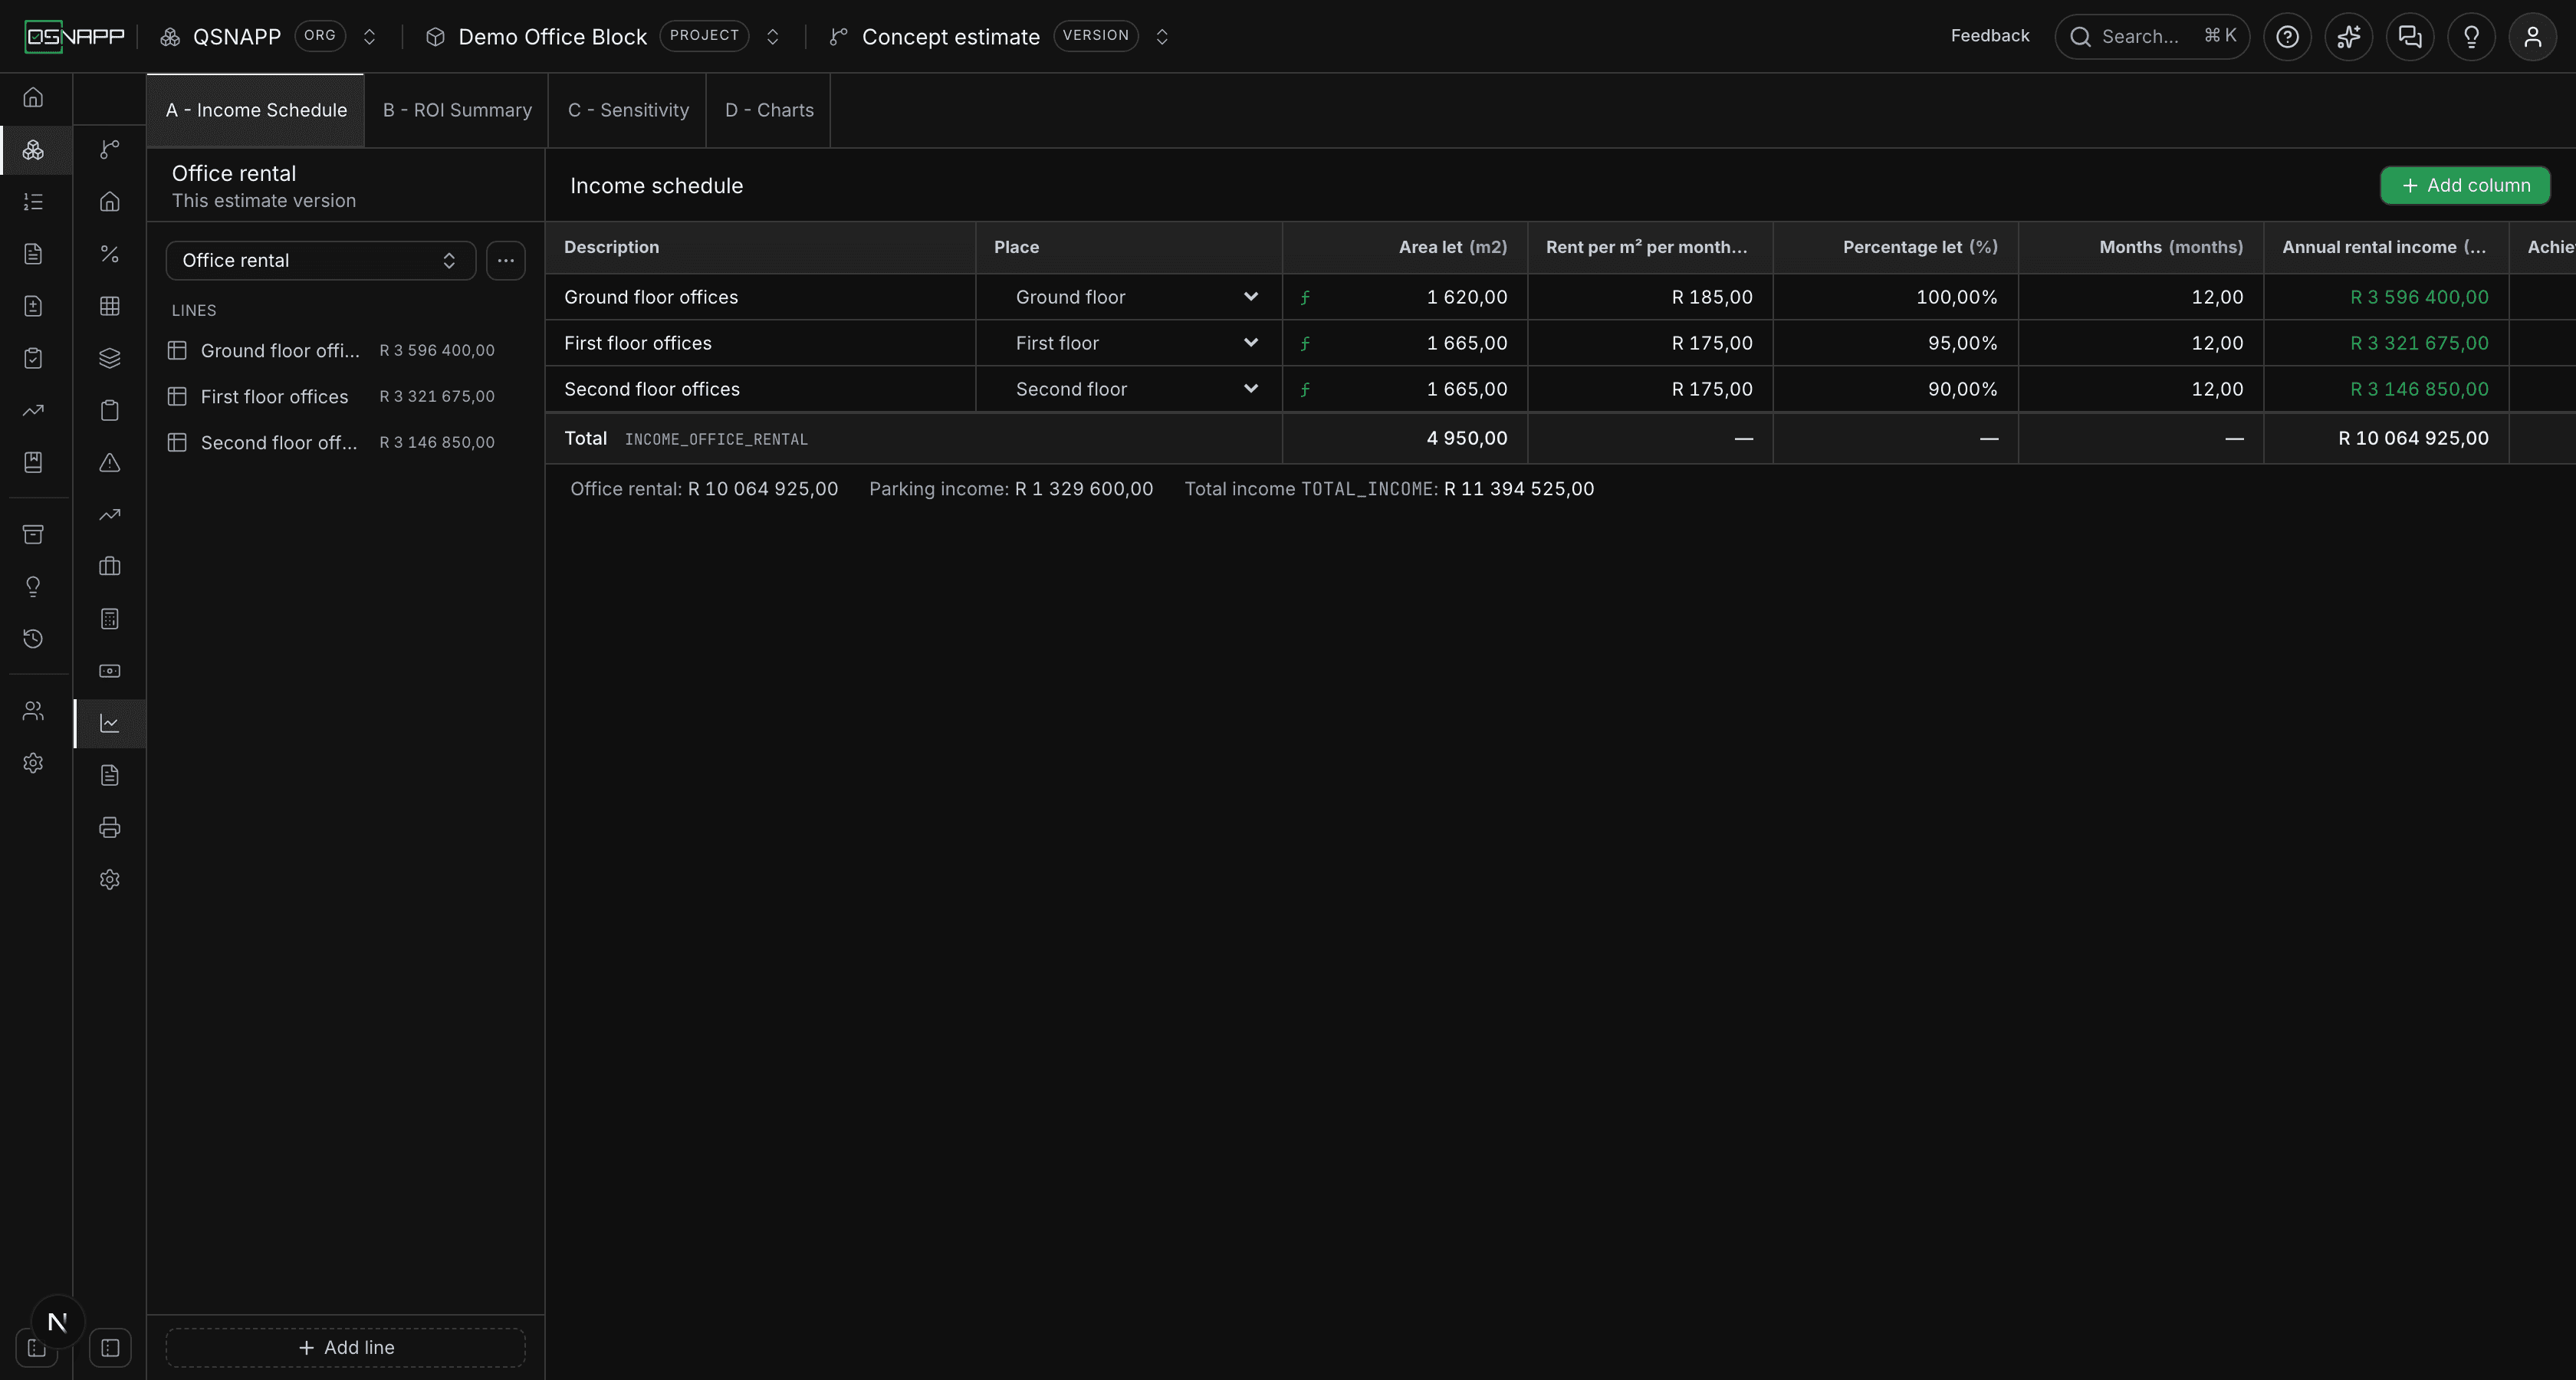
The tab is four sections in a strip across the top — A - Income Schedule, B - ROI Summary, C - Sensitivity and D - Charts — each laid out the way the area schedule is. The rail on the left lists the parts of whichever section is open (lines, rows, scenarios, charts), with an Add button at its foot and a menu on each entry. Where a section holds more than one thing — several income schedules, several analyses — a picker at the top of the rail moves between them, and the ellipsis beside it renames, sets up or deletes the one you are on. The header above the grid carries the one button the section most needs: add a column, a row, a scenario, a chart.
The values you can name
Every formula on this tab can refer to figures by code. Start typing a name in a formula and the codes appear, with what each one comes to today. They come from four places:
- The cost side, as the Total project cost tab works it out:
TOTAL_PROJECT_COST,TOTAL_CAPITAL_COST,ESTIMATED_BUILDING_COST,PROFESSIONAL_FEES(the consultants' fees excluding VAT, from Professional fees) andESCALATION(pre- and post-tender together, from Escalation). These move when those tabs change. - The area schedule: every column's total, under the column's own code —
GLA,UNIT_NO,CONSTRUCTION, whatever you called them. A column measured in%is offered as a percentage, the rest as plain numbers. If two schedules share a code, each is offered with the schedule's name in front (BUILDING_AREAS_GLA,PARKING_GLA) rather than one being chosen for you. - The income schedules, for the summary:
TOTAL_INCOME, each schedule's income asINCOME_followed by its code, and every column's total as the schedule code and column code joined. - The other rows of the summary, by their codes.
A value that is not known yet — a total project cost before the cost tab is filled in — is still offered. A formula that names it is right, not wrong; it simply has nothing to show until the figure exists, and says so.
A — Income schedule
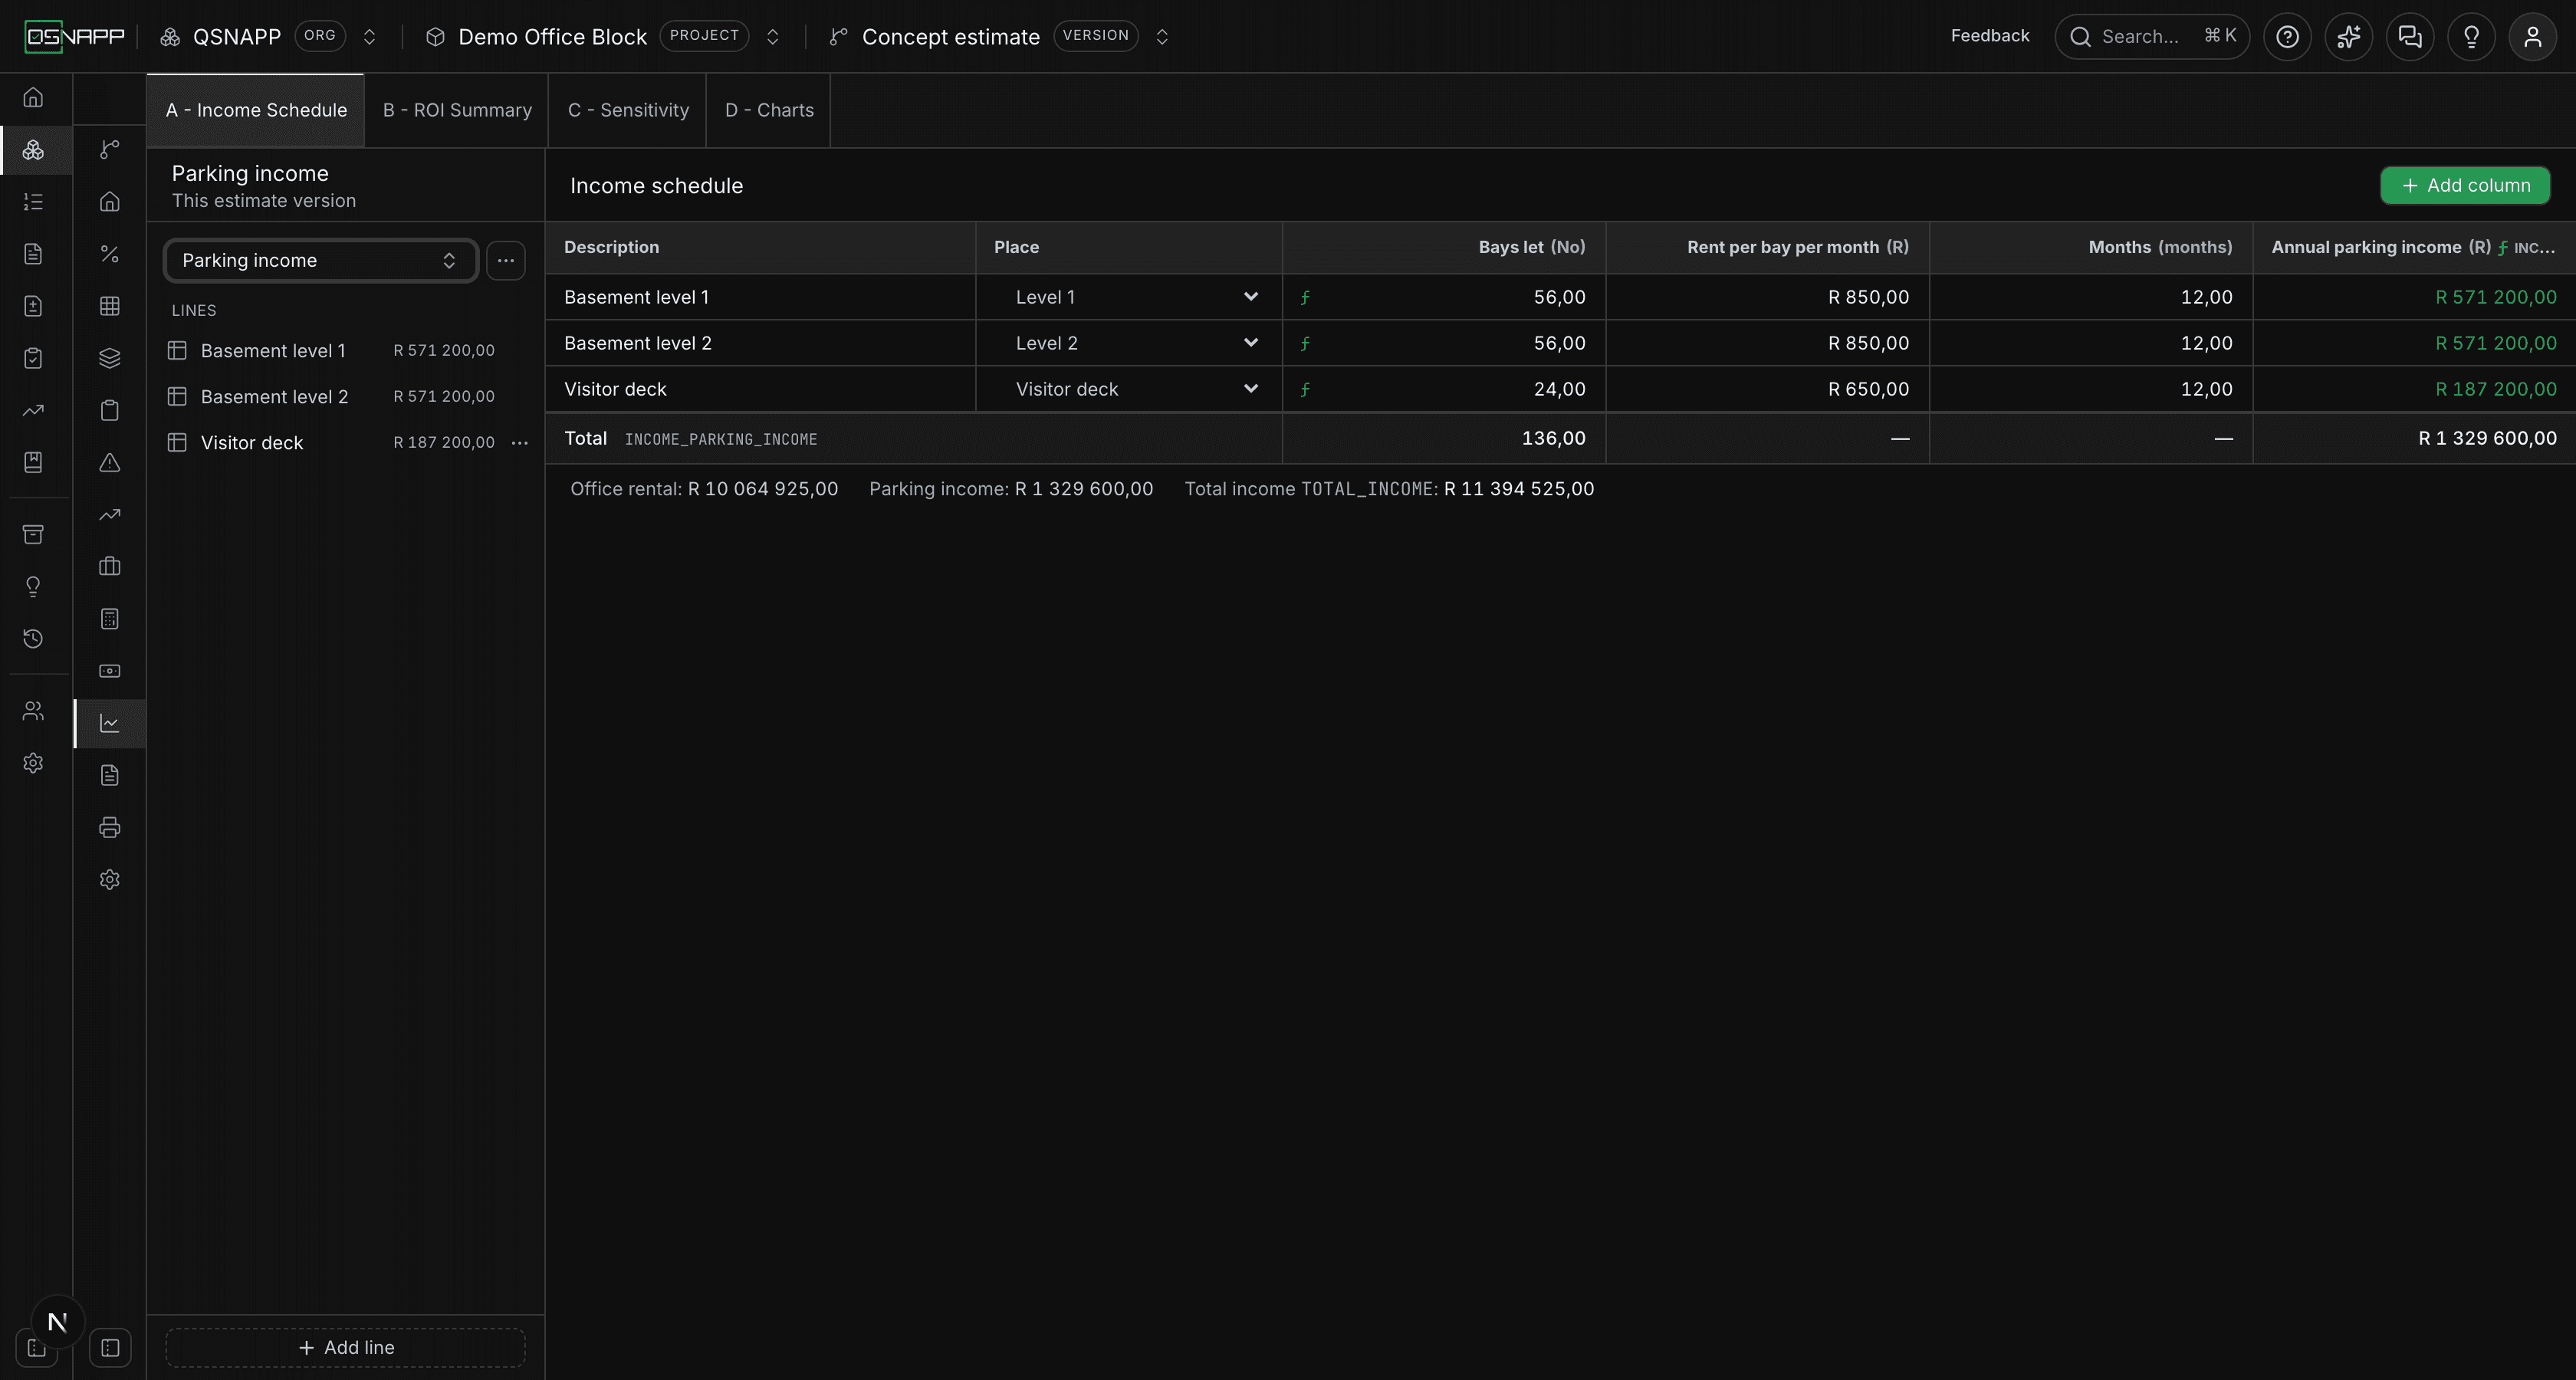
Built the way an area schedule is. Add a schedule, name its columns, add lines, fill in the cells. A version may hold several schedules — unit sales and rental income do not want the same columns — and the picker at the top of the rail moves between them. Add income schedule, at the top of the picker, asks for a name and a code; the ellipsis beside the picker renames or deletes the schedule you are on. Deleting one takes its columns and lines with it, and says first which formulas name its income.
The rail lists the schedule's lines with each one's amount beside it; Add lineat its foot adds one (once the schedule has columns), and a line's menu deletes it. With more than one schedule, a line under the grid gives each schedule's income and what TOTAL_INCOME comes to. A schedule with no column marked as the income says so under the grid: it adds nothing to TOTAL_INCOME until one is.
Columns you name
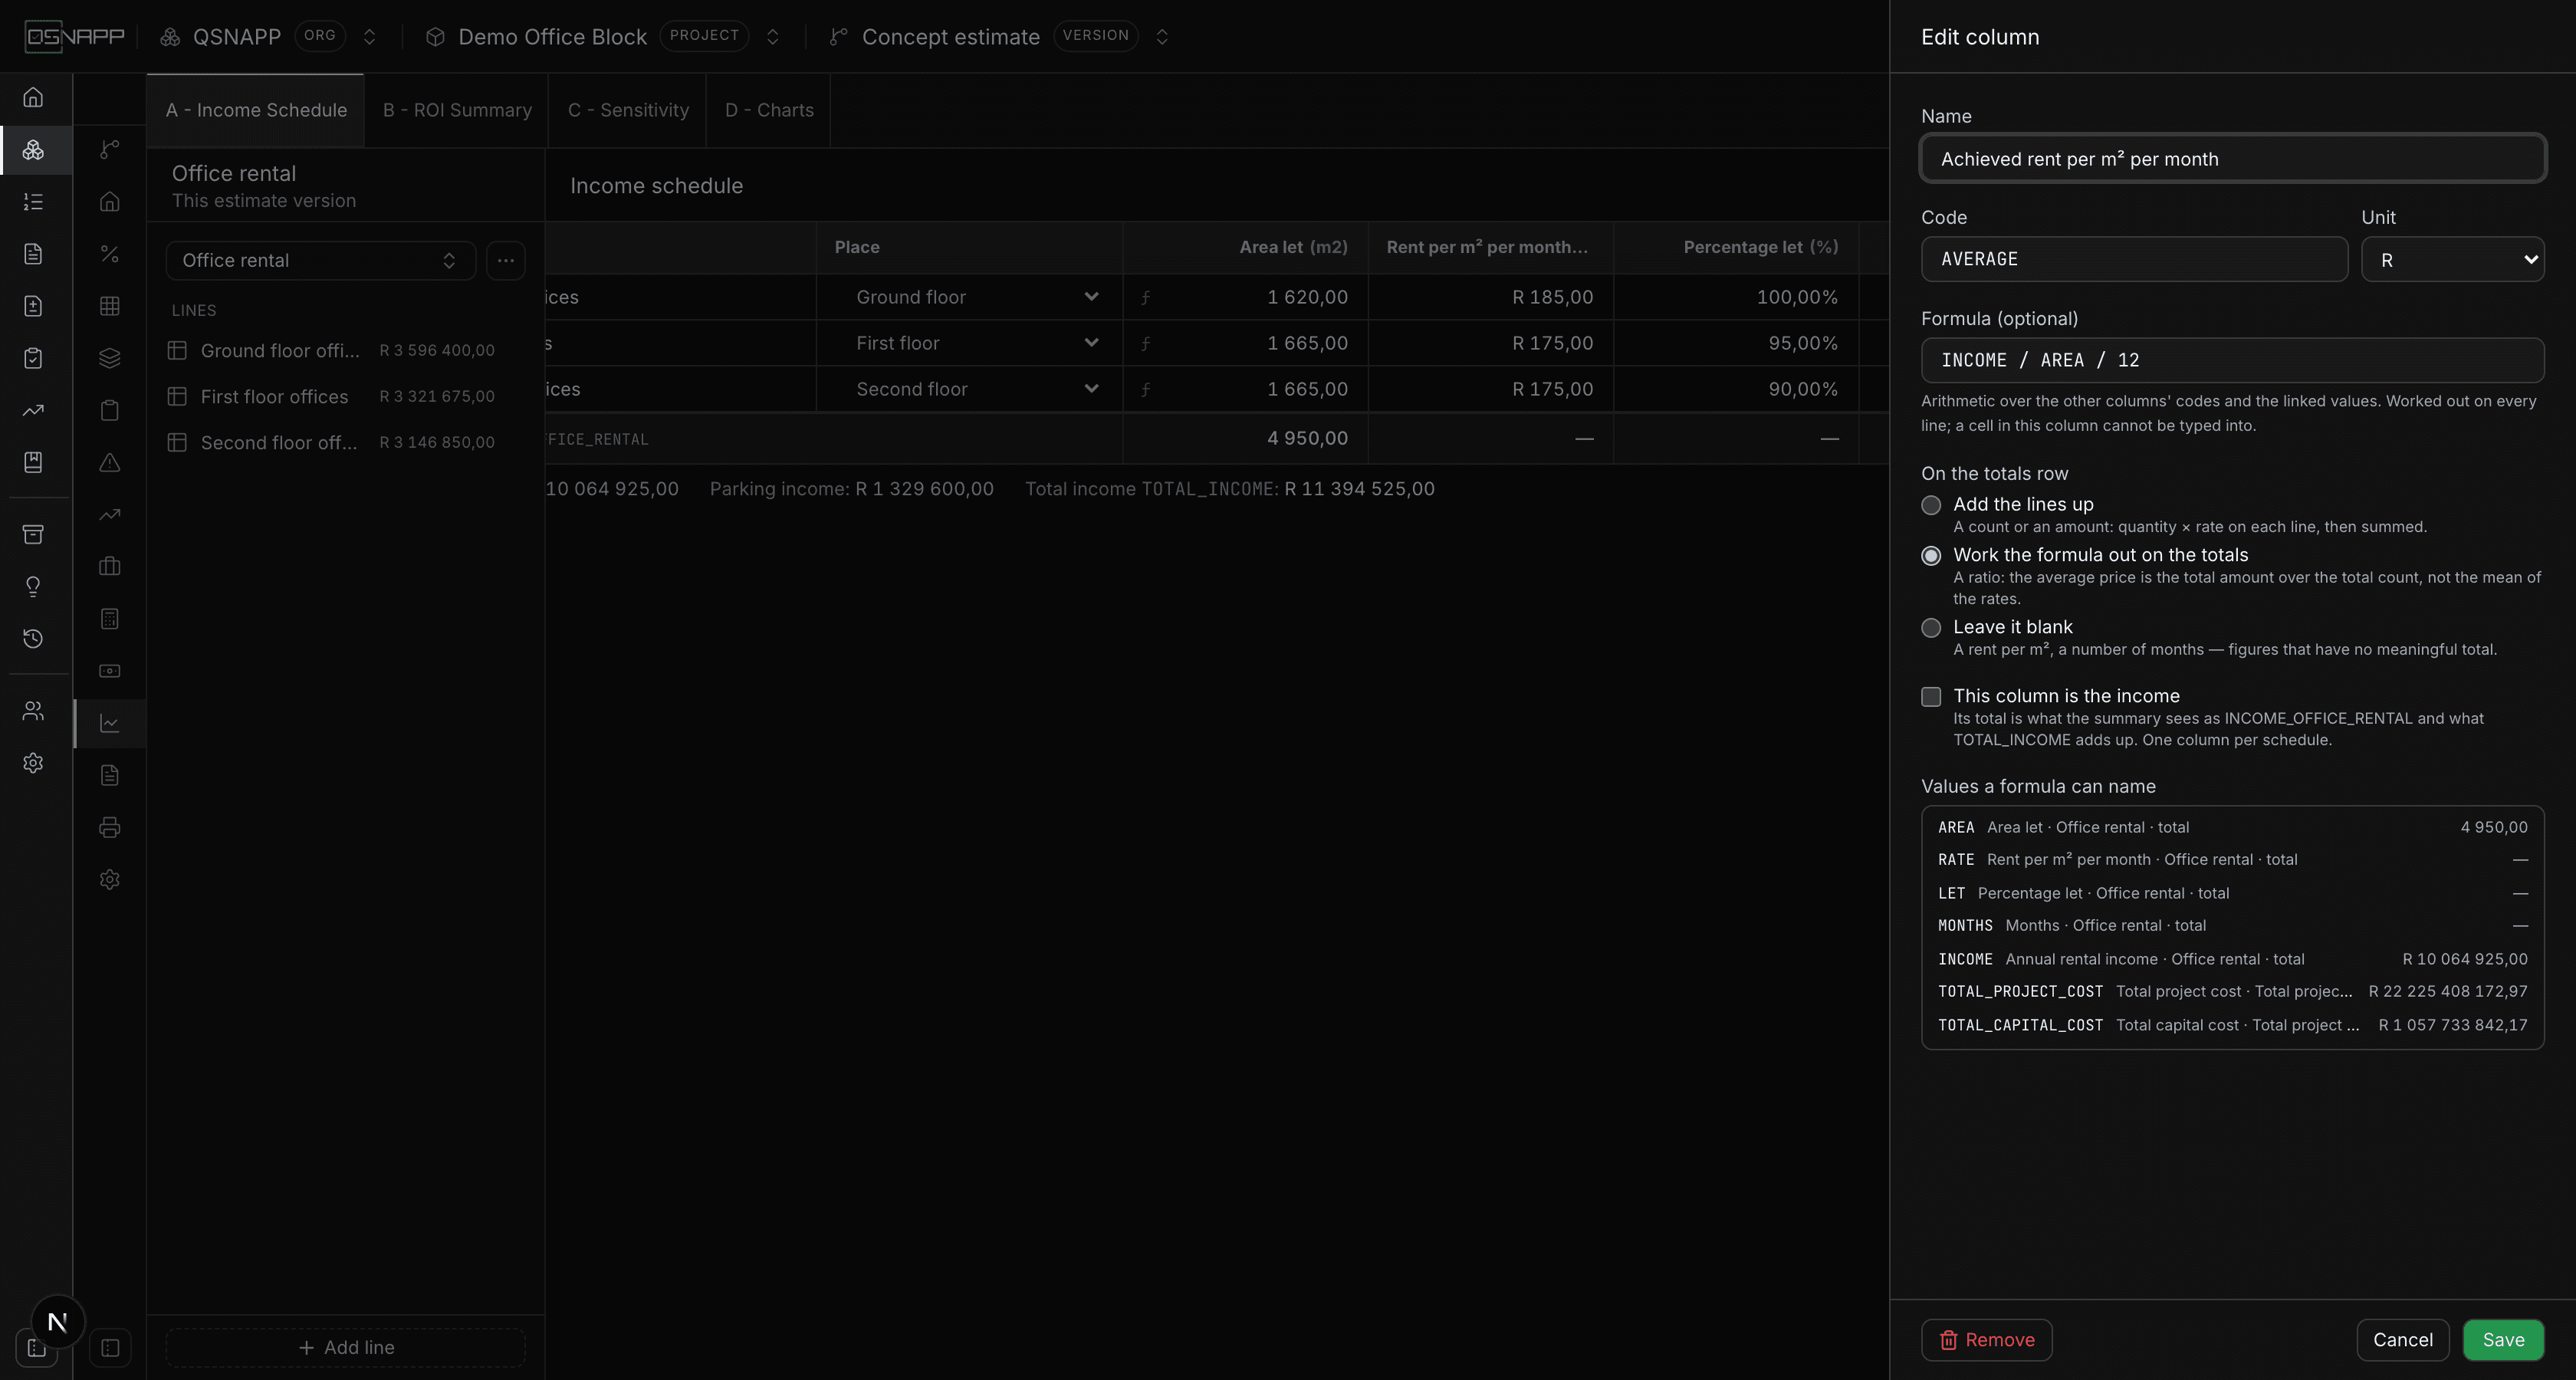
Add column asks for a name, a code, a unit and optionally a formula, exactly as the area schedule does. A new schedule offers to start with three: quantity, rate, and amount as QTY * RATE. Change them or replace them — a rental schedule wants m² let, a rate per m² per month, a percentage let and twelve months; a plot sale wants one lump sum.
One column is the amount.Tick “this column is the income” on it and its total becomes the schedule's income — what the summary refers to as INCOME_followed by the schedule's code, and what TOTAL_INCOMEadds up across schedules. Every other column's total is offered too, as the schedule code and the column code joined: SALES_QTY for the units sold.
A column with a formula is worked out on every line, and its cells cannot be typed into. Its heading carries an ƒ; hover the heading for the code and the formula, and click it to open the column again. The column marked as the income is tagged income in its heading.
On the totals row, each column says how its total is found. Add the lines up is right for a count or an amount — quantity × rate on each line, then summed. Work the formula out on the totals is for a ratio: an average price is the total amount over the total count, not the mean of the rates. Leave it blank is for a rent per m² or a number of months — figures that have no meaningful total, where a summed one reads as a figure somebody meant. The unit — R, No, m², m, %, months — decides how the column is shown: a % column as a percentage, an R column and the income column in rand, the rest as plain numbers.
Remove, at the foot of the column drawer, deletes the column and the figures entered in it, and asks first — naming any formula that refers to the column.
A cell left empty is not entered, not zero. A line whose amount cannot be worked out shows —, the schedule total leaves it out, and the total income says so by being empty rather than short.
A line about a place
Most income schedules are written per unit type: so many two-bedroom units at this price, so many one-bedroom at that. The unit counts are already in the area schedule, so the line does not ask you to type them again. Choose the place in the Placecolumn — the “2 Bed unit” row of the area schedule — and the area columns on that line read that row's figures. UNIT_NO in a cell is then that unit type's count, and it changes when the area schedule does.
A line with no place reads the schedule totals instead, which is what a line about the whole development wants. The Place column offers every row of every area schedule, indented as the schedule nests them, with the schedule's name beside the top-level places when there is more than one schedule; choosing a place re-works the line's formulas at once.
Any cell can be a formula
Type a figure or a formula into any entered column. UNIT_NO for a count; GLA * 250 * 12 for a year's rent; 1600000 - QTY * 10000 for a price that falls with volume — the other columns on the line are named by their codes. A cell holding a formula carries an ƒ; hover it for the working. Click in and the formula is what you edit; leave and the figure comes back. A cell can name the other entered columns on its line and the linked values, but not a derived column — that is worked out from the cells, so reading it back would be a loop.
= at the front is accepted and ignored, and so are × and ÷, which is what a formula pasted from a spreadsheet usually carries.
B — ROI summary
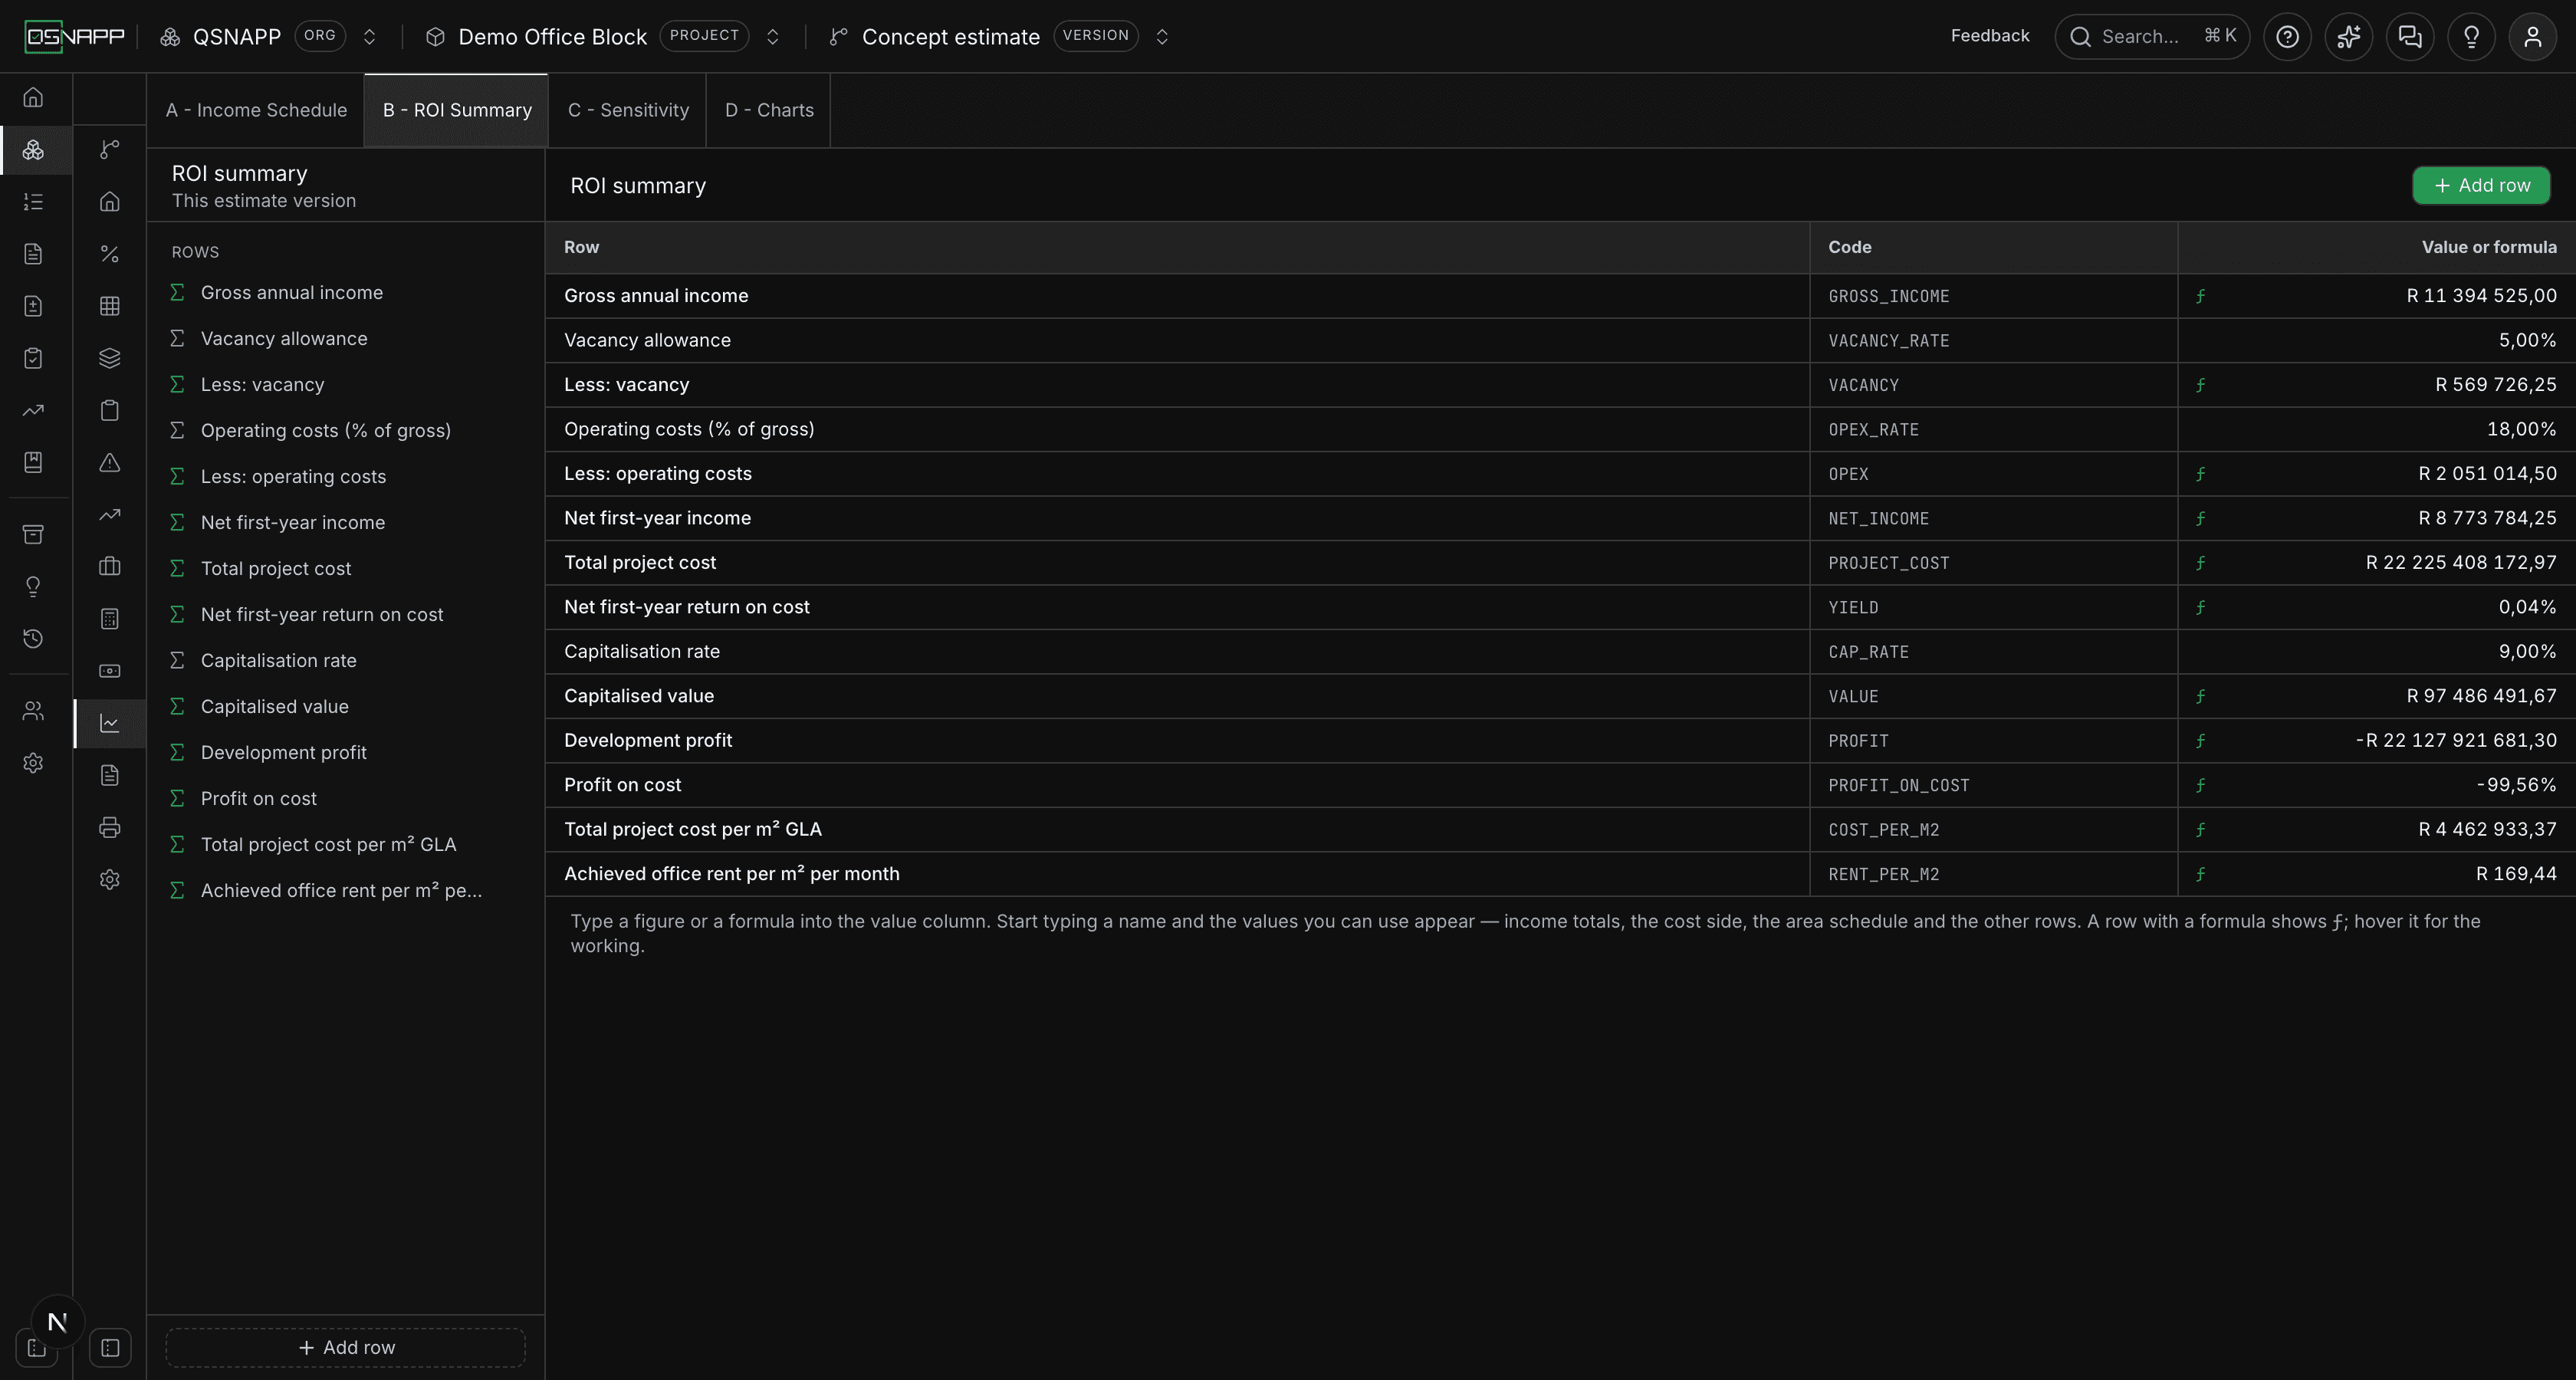
Rows, in the order you want them read. Each has a label, a code, and either a figure you enter or a formula. An entered figure is an input — a VAT rate, a required return, the conveyancing fees. A formula is worked out from the other rows and the values above.
The standard layout
An empty summary offers Use the standard layout. It puts in the rows most viabilities have: gross income taken as VAT-inclusive selling prices, less VAT, less conveyancing, giving total income excluding VAT; less the total project cost; net income; and the return on investment as net income over cost. Beneath those is a required-return block — the net income and project cost that return would need, and how far the current figures are from them — which is what the sensitivity table reads off.
It is a starting point, not a rule. Change any row's formula, rename it, move it, delete it, or add rows the layout does not have: agent's commission, profit on income, a residual land value.
The layout's inputs start at a VAT rate of 15%, conveyancing and dirt on land at nought, and a required return of 25%; a row the version already has under one of its codes is left alone. If the version has no sensitivity analysis yet, the layout also adds one — Required return, varying that row from 23,5% to 26% in half-percent steps, reading off the required-return block, with break-even where the difference in project cost reaches nought — and a chart of it: the project cost at the required return as bars, with the net income it needs as a line.
Rows, codes and formulas
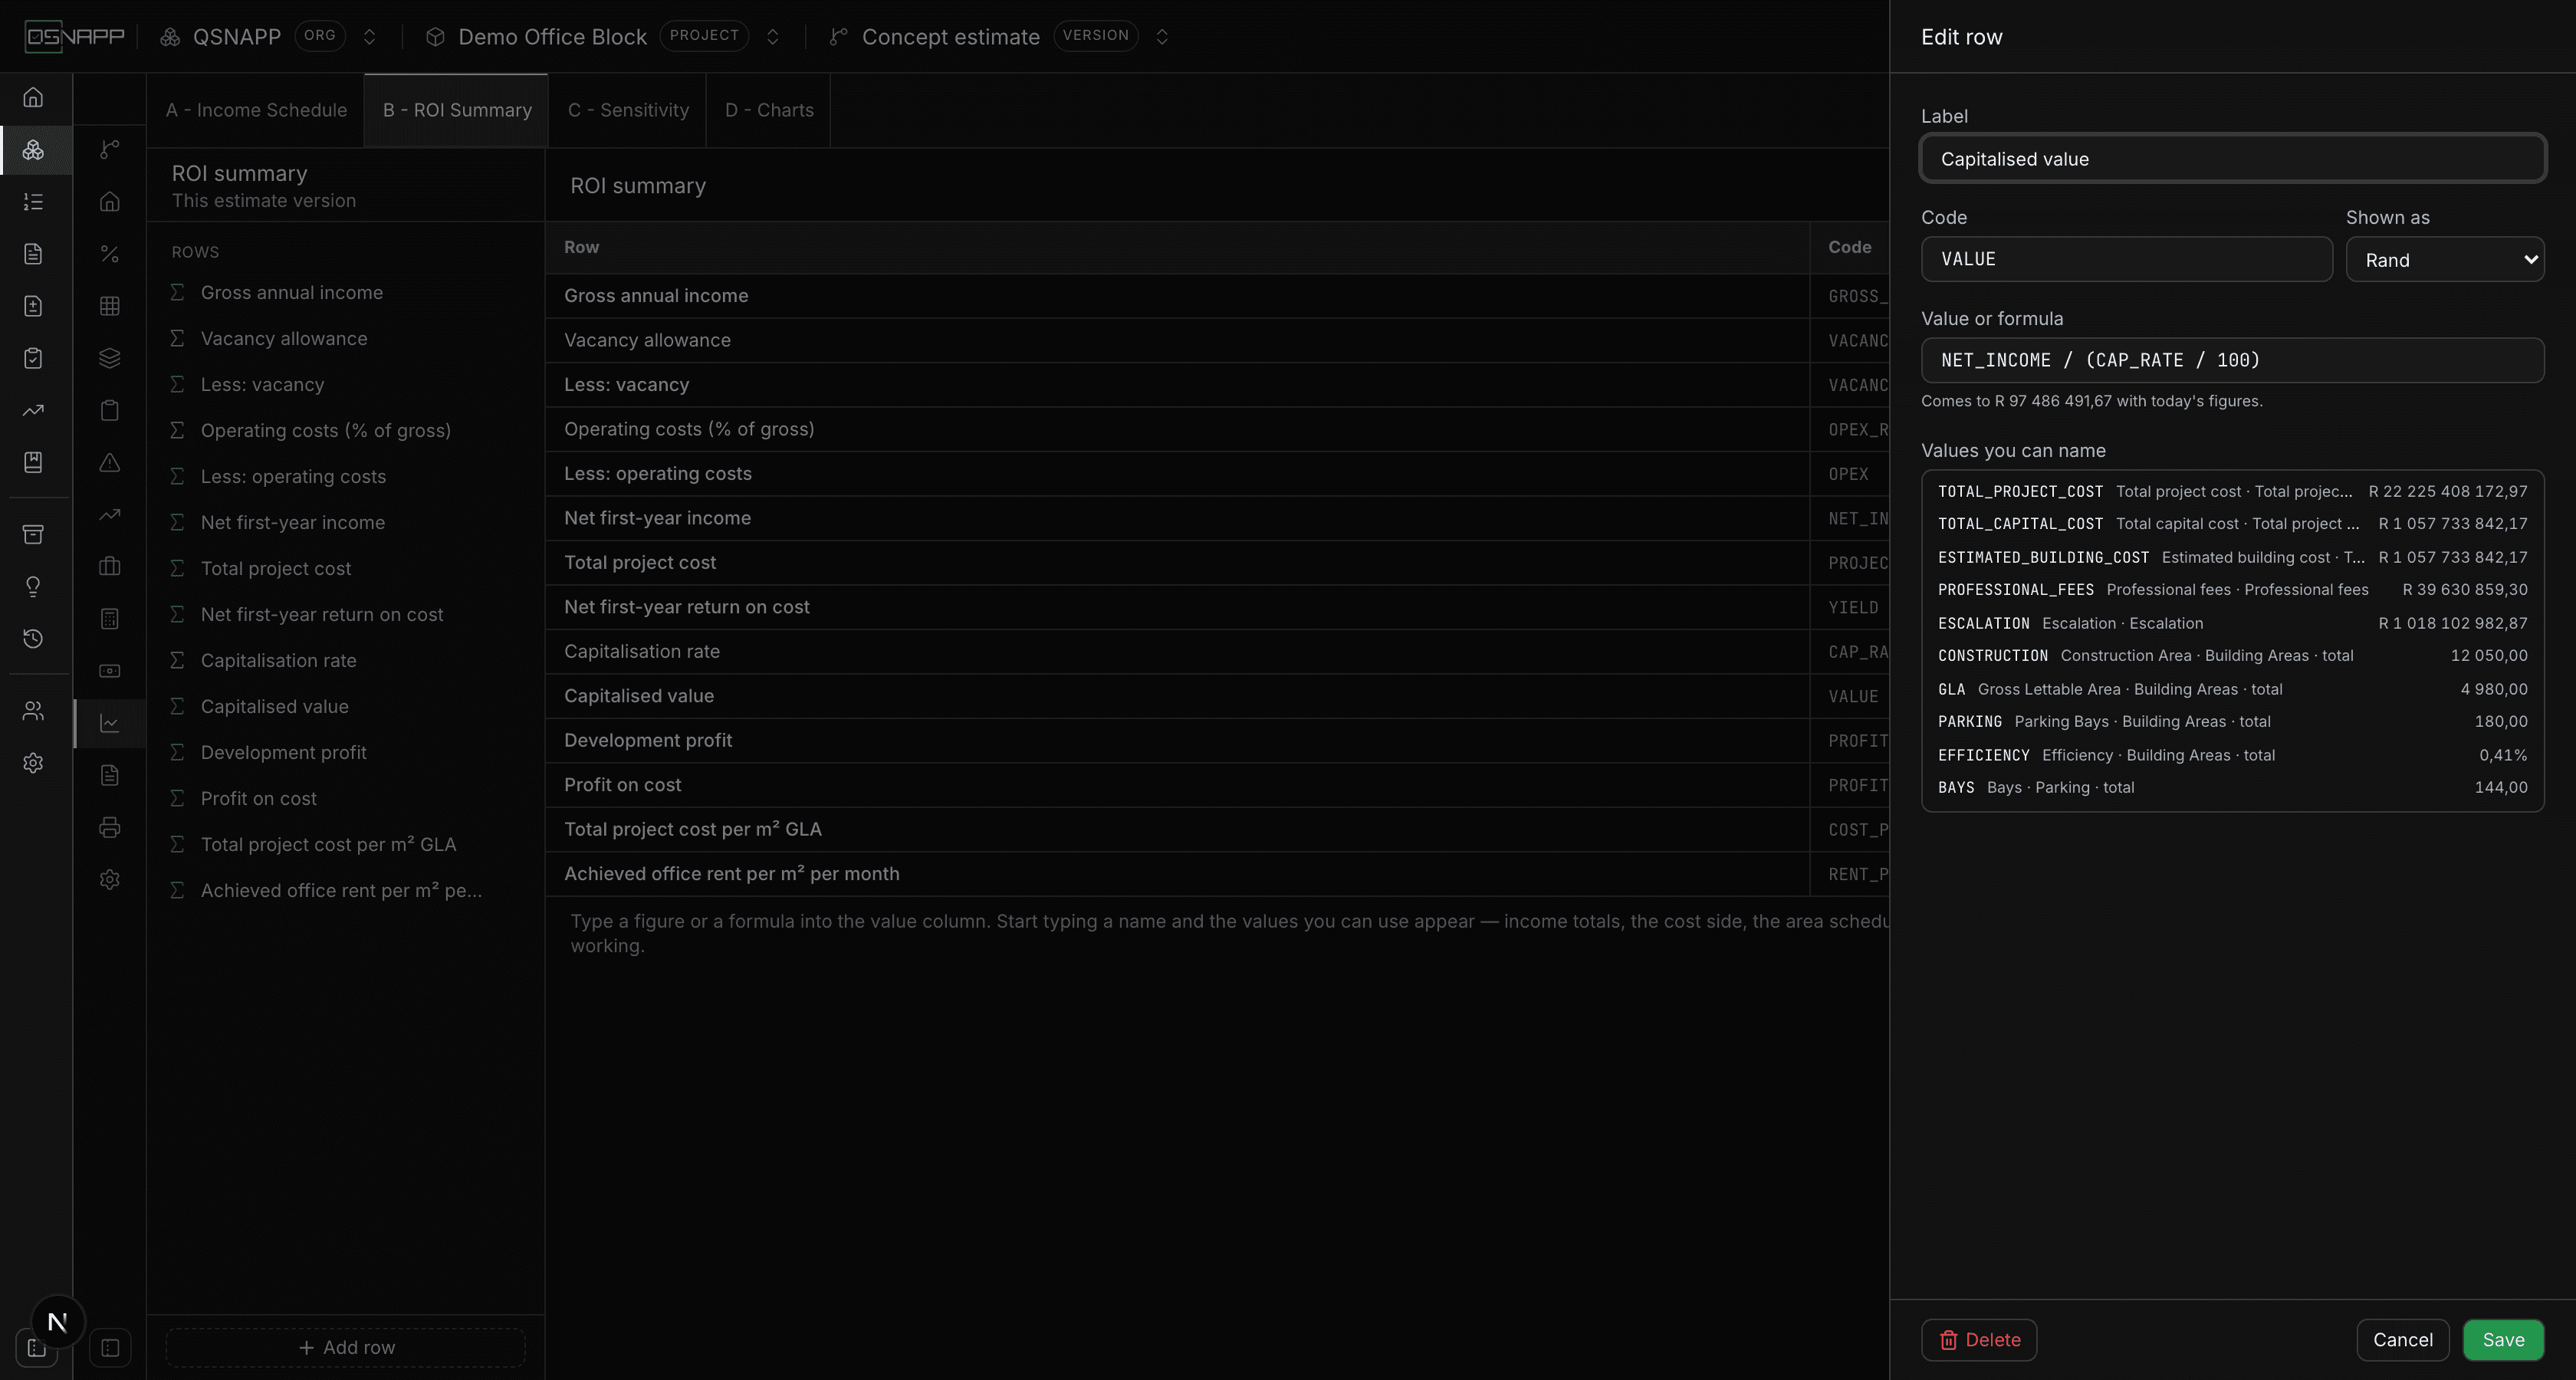
Add row asks for a label, a code, how the figure is shown — rand, percent or a plain number — and a value or formula. The code is what other rows refer to, so it is letters, digits and underscores, starting with a letter; spaces become underscores as you type. It cannot be the code of a linked value: TOTAL_INCOME is the income schedule's, and a row called that would hide it.
The value column of the table takes the same thing the drawer does. Type a figure and the row becomes an input; type a formula and it becomes worked out. A row with a formula shows its figure in the accent colour with an ƒbeside it; hover for the formula and what it comes to. The label is edited in place; the code opens the drawer, which is also where the format is changed. A row's menu in the rail moves it up or down, or deletes it.
A percentage is a percentage: a row shown as percent holding 15 is fifteen percent, and a formula that wants the fraction divides by 100.
When a formula does not work out
The row turns amber and keeps showing the formula rather than emptying itself. Hover it for the reason, which is written for this screen: VAT rate has not been entered yet, Total project cost has not been entered yet, GLA is in more than one area schedule — use BUILDING_AREAS_GLA or PARKING_GLA, or two rows that refer to each other in a loop, named in order. A row that depends on a broken one says which, rather than claiming the other does not exist.
Deleting a row that other formulas name asks first and lists them. They stop working out until they are rewritten; nothing is silently rewritten for you.
C — Sensitivity
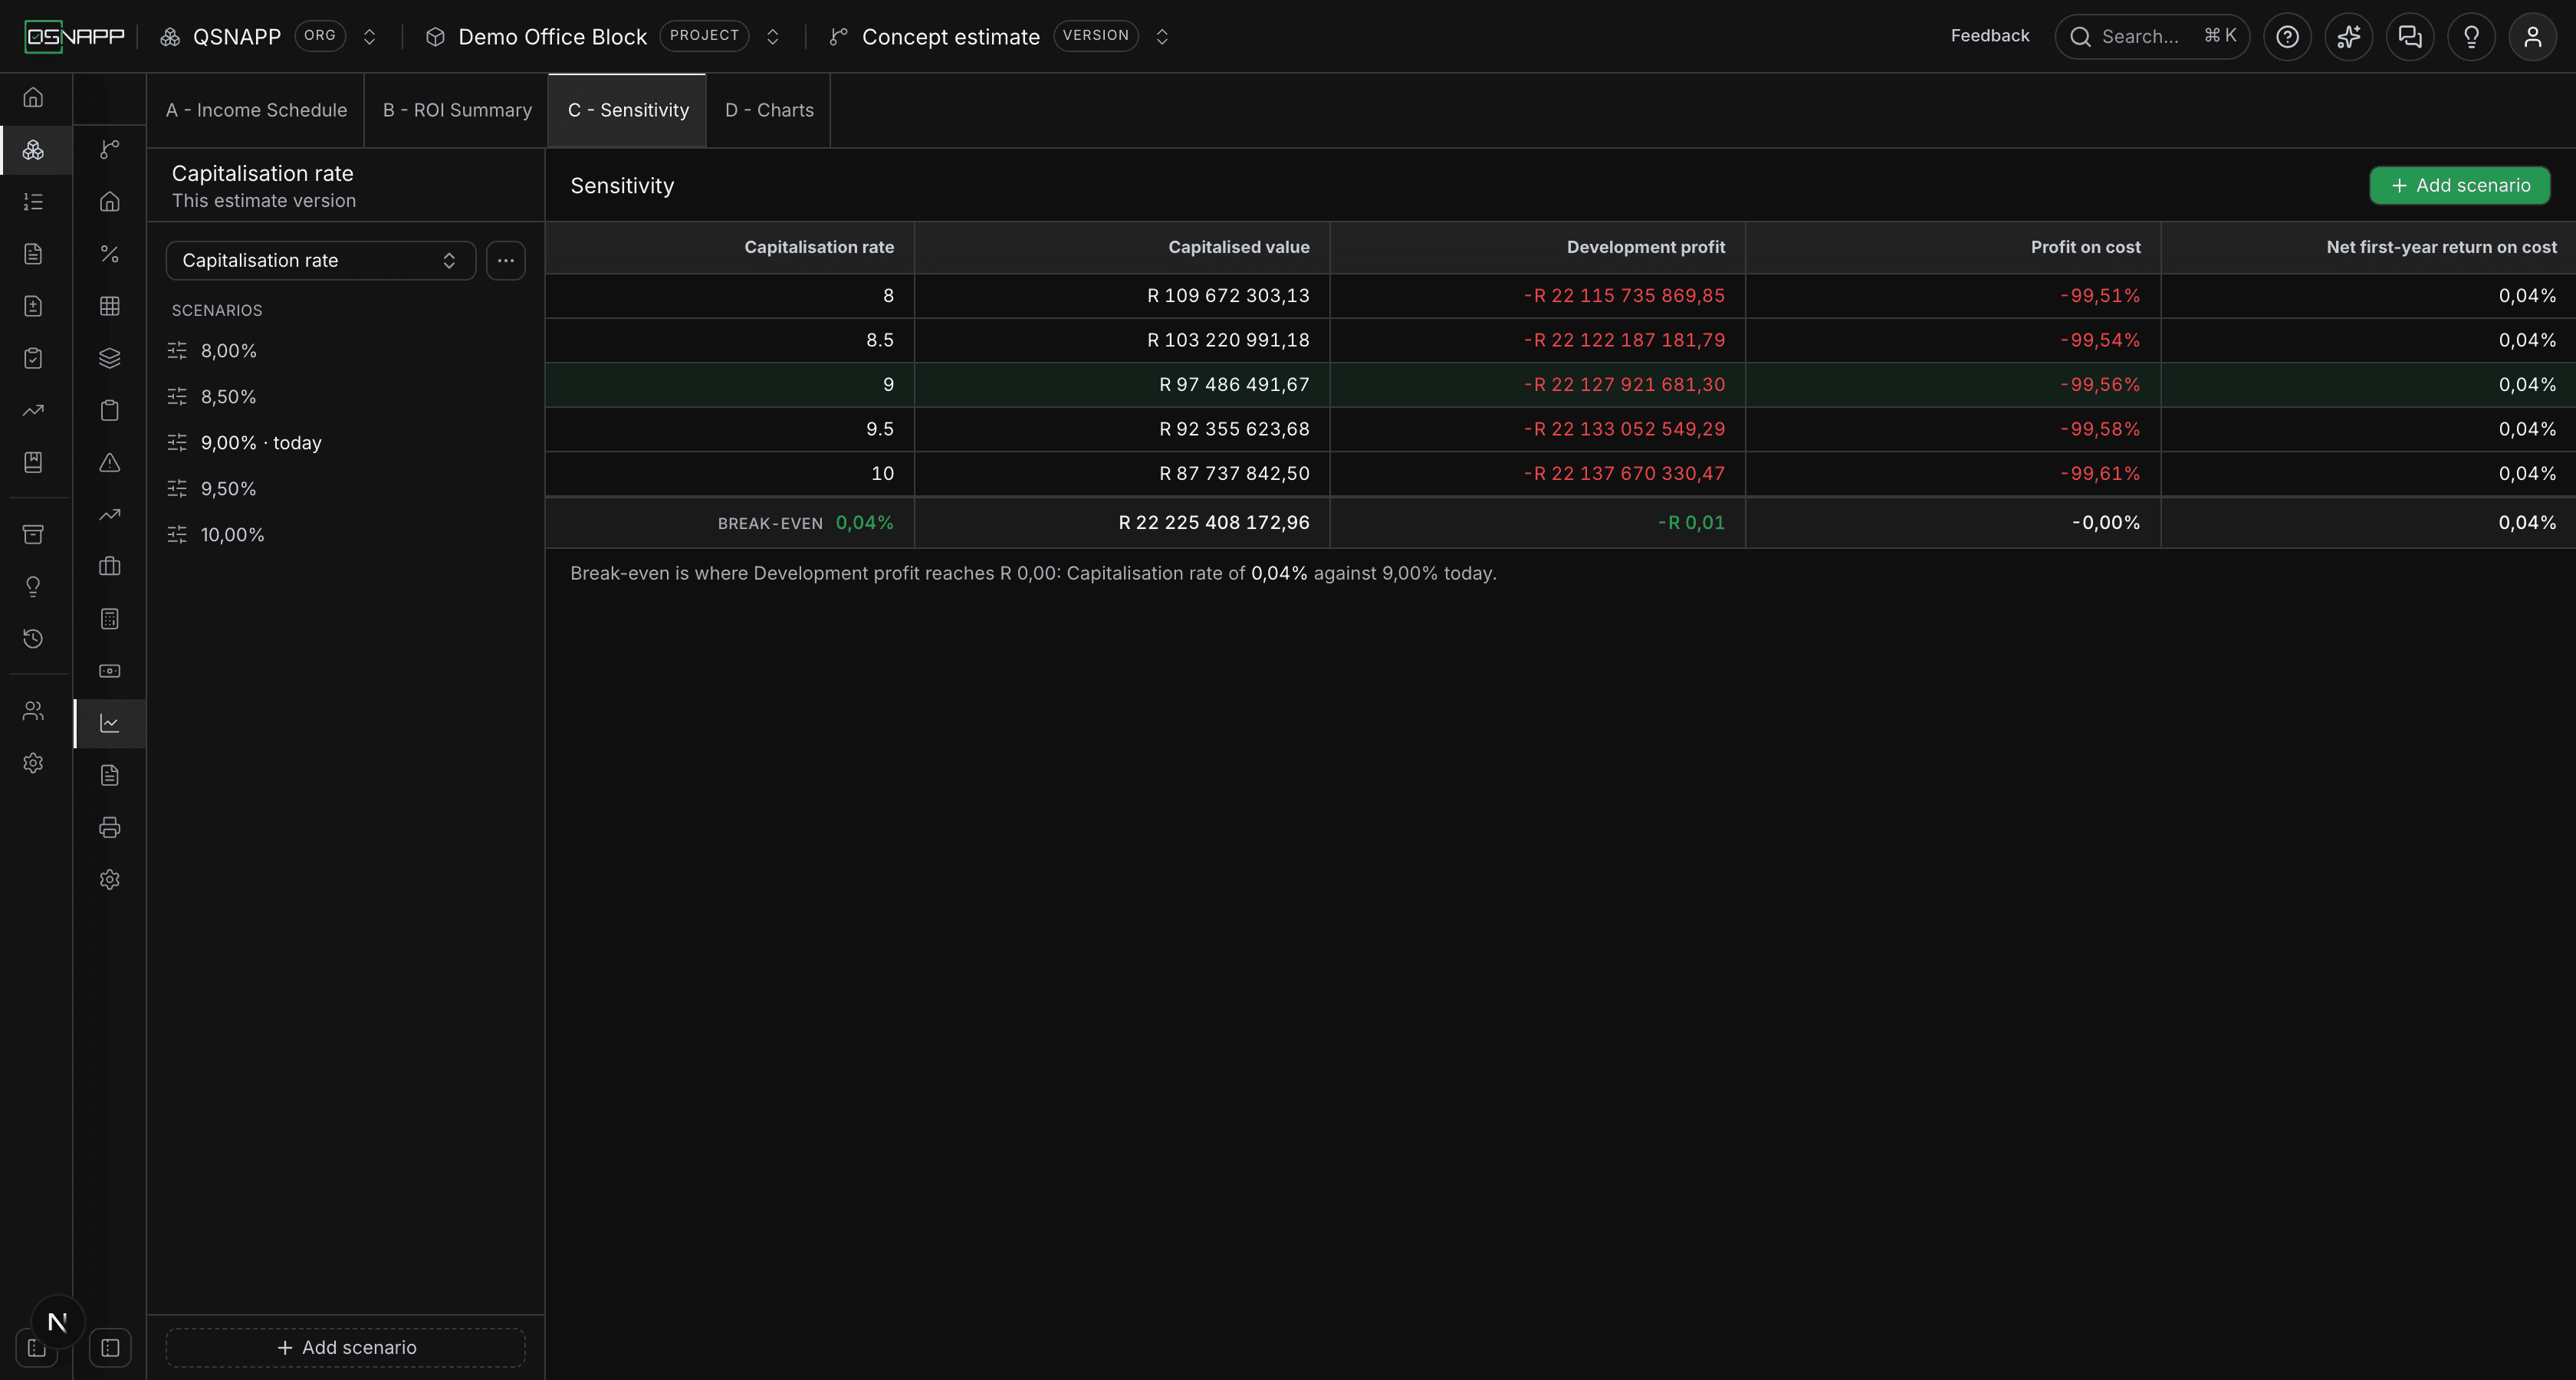
A sensitivity analysis varies one row of the summary over a set of scenarios and reads off the rows you choose. A version holds as many analyses as you like — the picker at the top of the rail moves between them — because the question is rarely one question: what the required return does to the cost you can afford, what a 10% fall in rental does to the return, what a 10% rise in cost does to the profit.
Setting one up
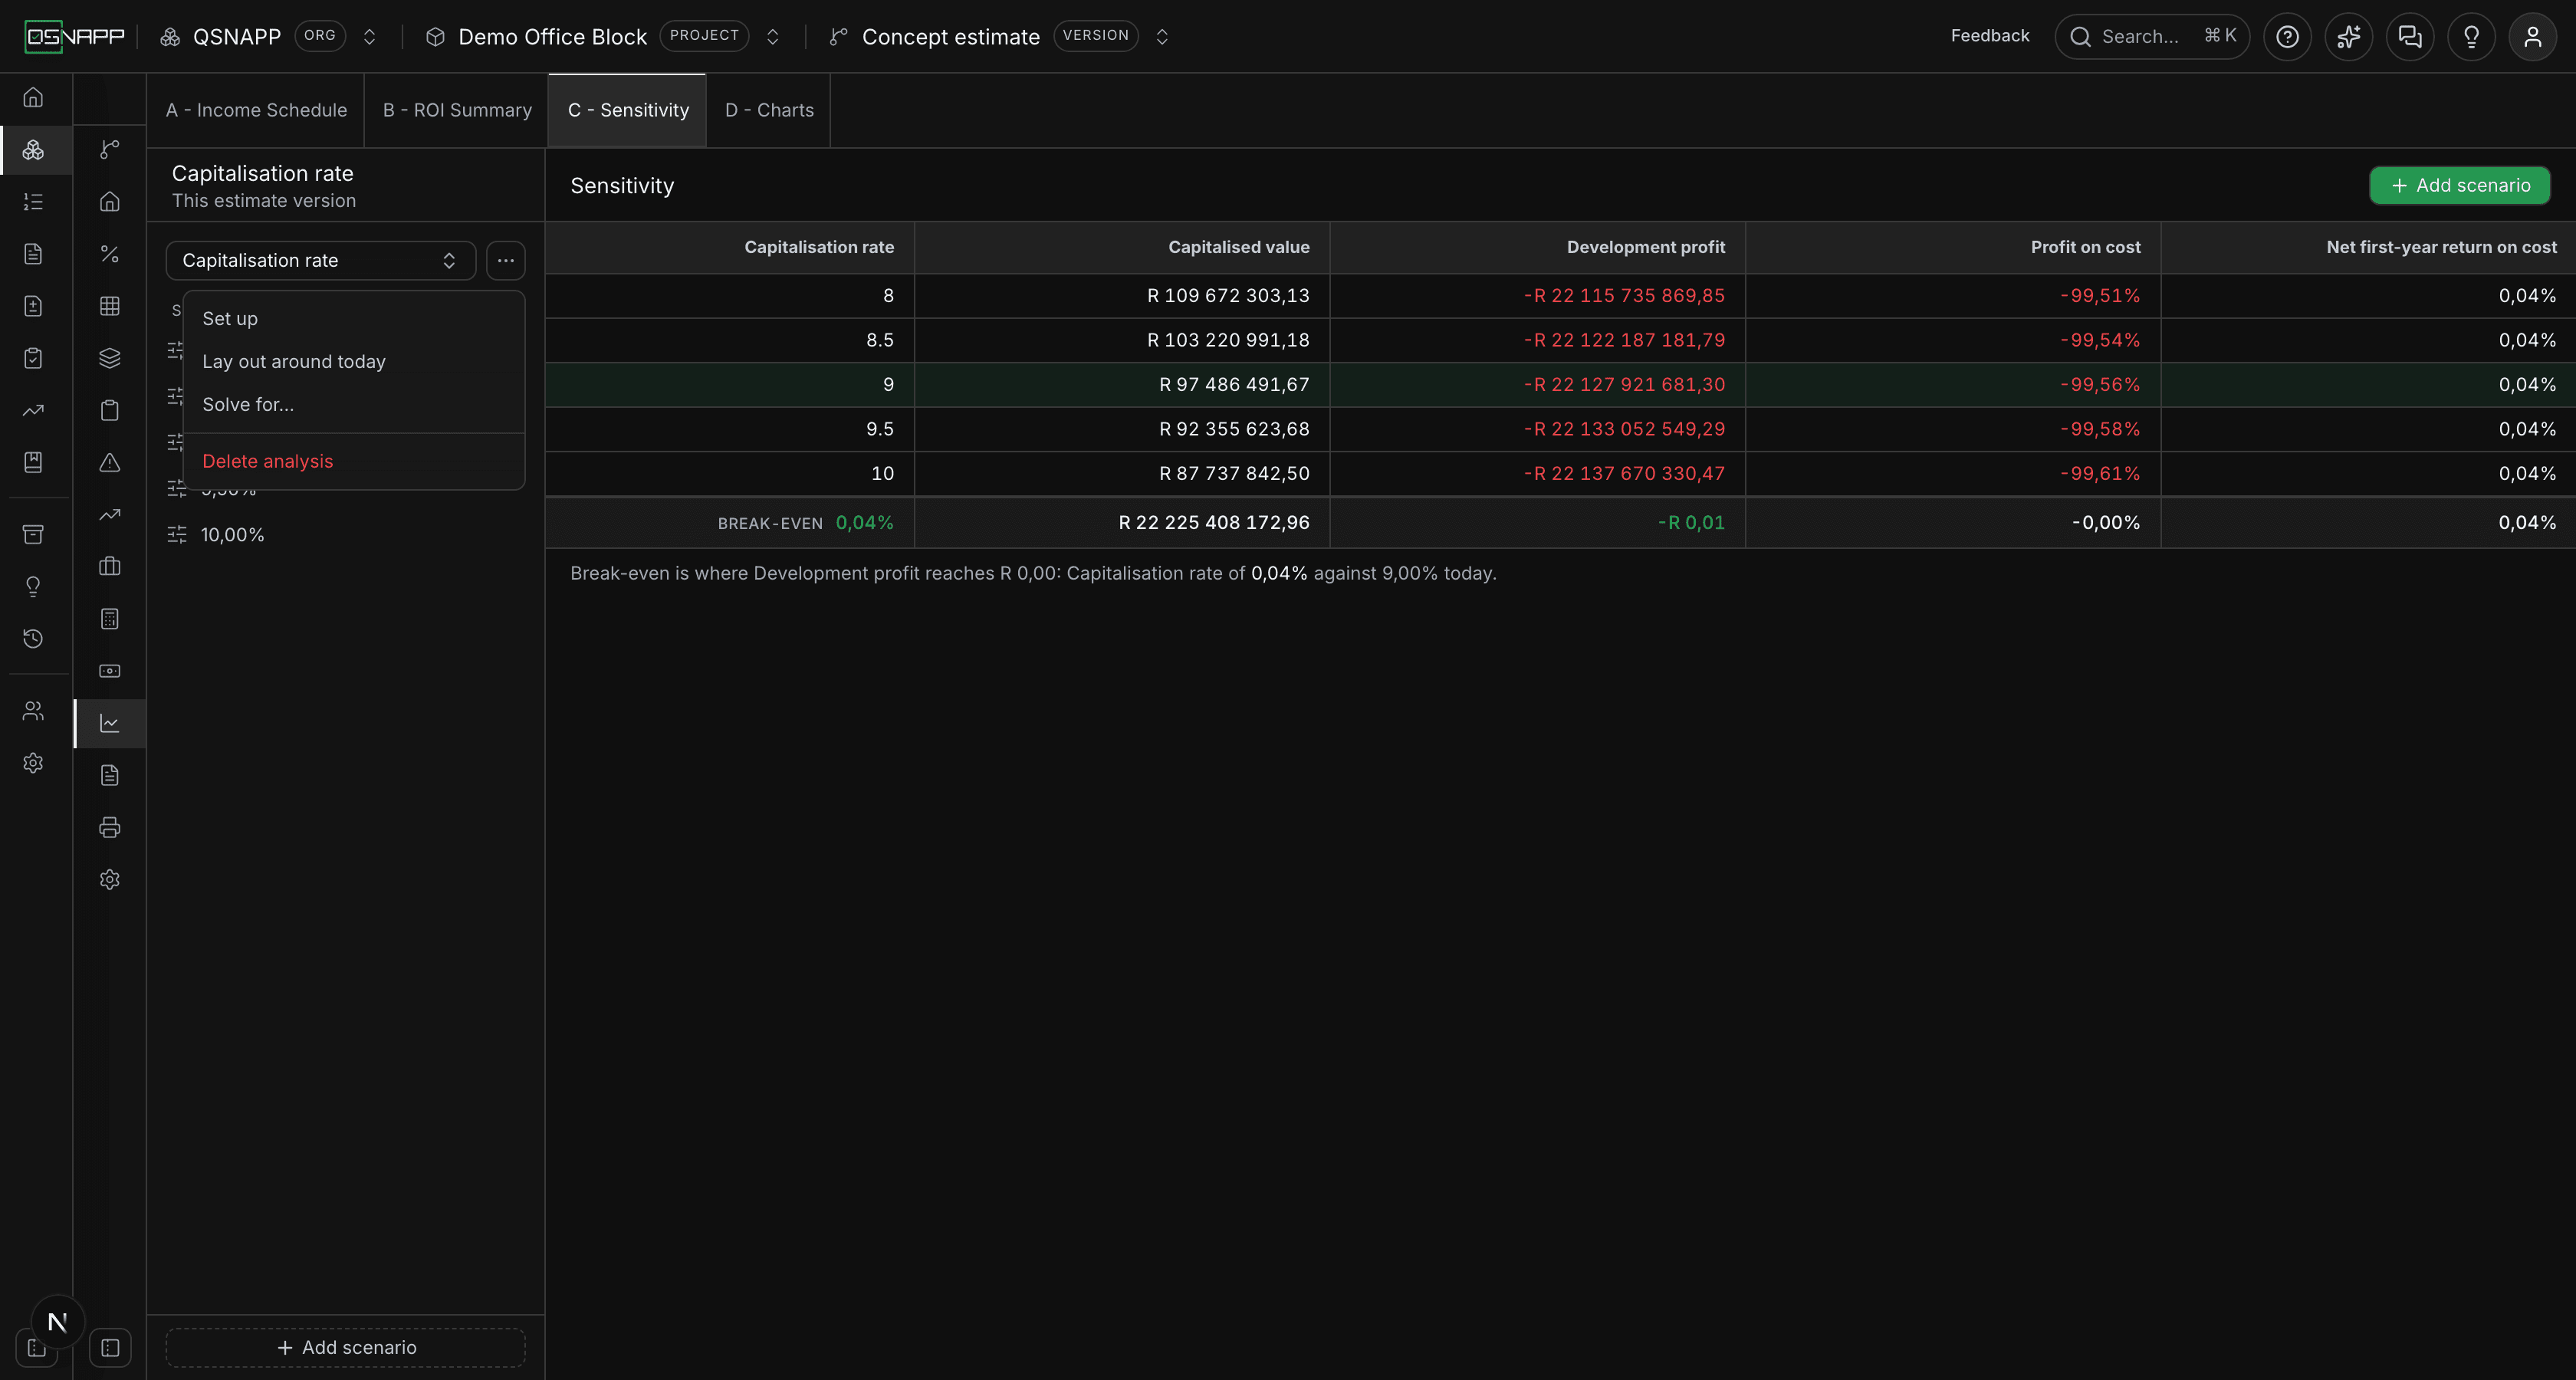
Add sensitivity analysis, at the top of the picker, asks for a name, the row to vary, how the scenarios are stated, the rows to read off (in the order ticked), and what break-even means; Set upin the menu beside the picker opens the same drawer again. The row to vary is usually an input, but a worked-out row can be varied too — each scenario simply replaces its formula with the scenario's figure. Scenarios are stated one of two ways, which is how the two kinds of viability sheet do it:
- Figures — 23,5% · 24% · 24,5% — the figure the row takes in each scenario. The residential viabilities list required returns this way, centred on the return the scheme makes today.
- Changes on today's figure — −10% · −5% · +5% · +10% — applied to whatever the row comes to now. The commercial template varies rental and capital cost this way. The figure each change comes to is shown beside it.
Add scenarios one at a time from the rail — Add scenario adds one at today's figure, or at 0% for an analysis stated as changes — or Lay out around today: a step and a number of steps each side (a half-percent and three, or 2,5% and three, to begin with; up to twenty each side), and the scenarios are laid out either side of today's figure, snapped to the step, replacing whatever the analysis held. The scenario that is today's figure is highlighted in the table and on the chart, and marked today in the rail.
The scenarios are edited in the table: type a figure into the first column, or a change into the Change column, and leave the cell. A row read off that comes to less than nought is shown in red. If the row an analysis varies is later deleted from the summary, the analysis says so and asks to be set up again.
Break-even
Every sensitivity is really asking where break-even is: the selling price at which profit reaches nought, the capitalisation rate at which value falls to cost, the rental at which the return meets the required one. Name the row and the figure that mean break-even for the analysis, and the figure the varied row must take for that is solved for on the same chain the scenarios use, shown as a row under them, and marked on the chart where it falls between two scenarios. Where it lies outside the scenarios, the table still shows it and the chart says so in words. Where it cannot be found — the target row does not depend on the varied one, or never reaches the figure — the reason is written out rather than a number guessed. On an analysis stated as changes, the break-even row also gives the change on today's figure it amounts to, and a line under the table spells the whole thing out: what the varied row must be for break-even, against what it is today.
Solving for a figure
Solve for… is the same question asked once, and written back: what must one input be for another row to reach a figure? Choose the row to change, the row to reach and the figure, and the input is set to the answer and saved. It starts from the analysis you are looking at — its varied row, its break-even row and figure — so break-even is one click from being the figure the summary uses. A worked-out row can be chosen as the one to change; its formula is then replaced by the figure found.
D — Charts
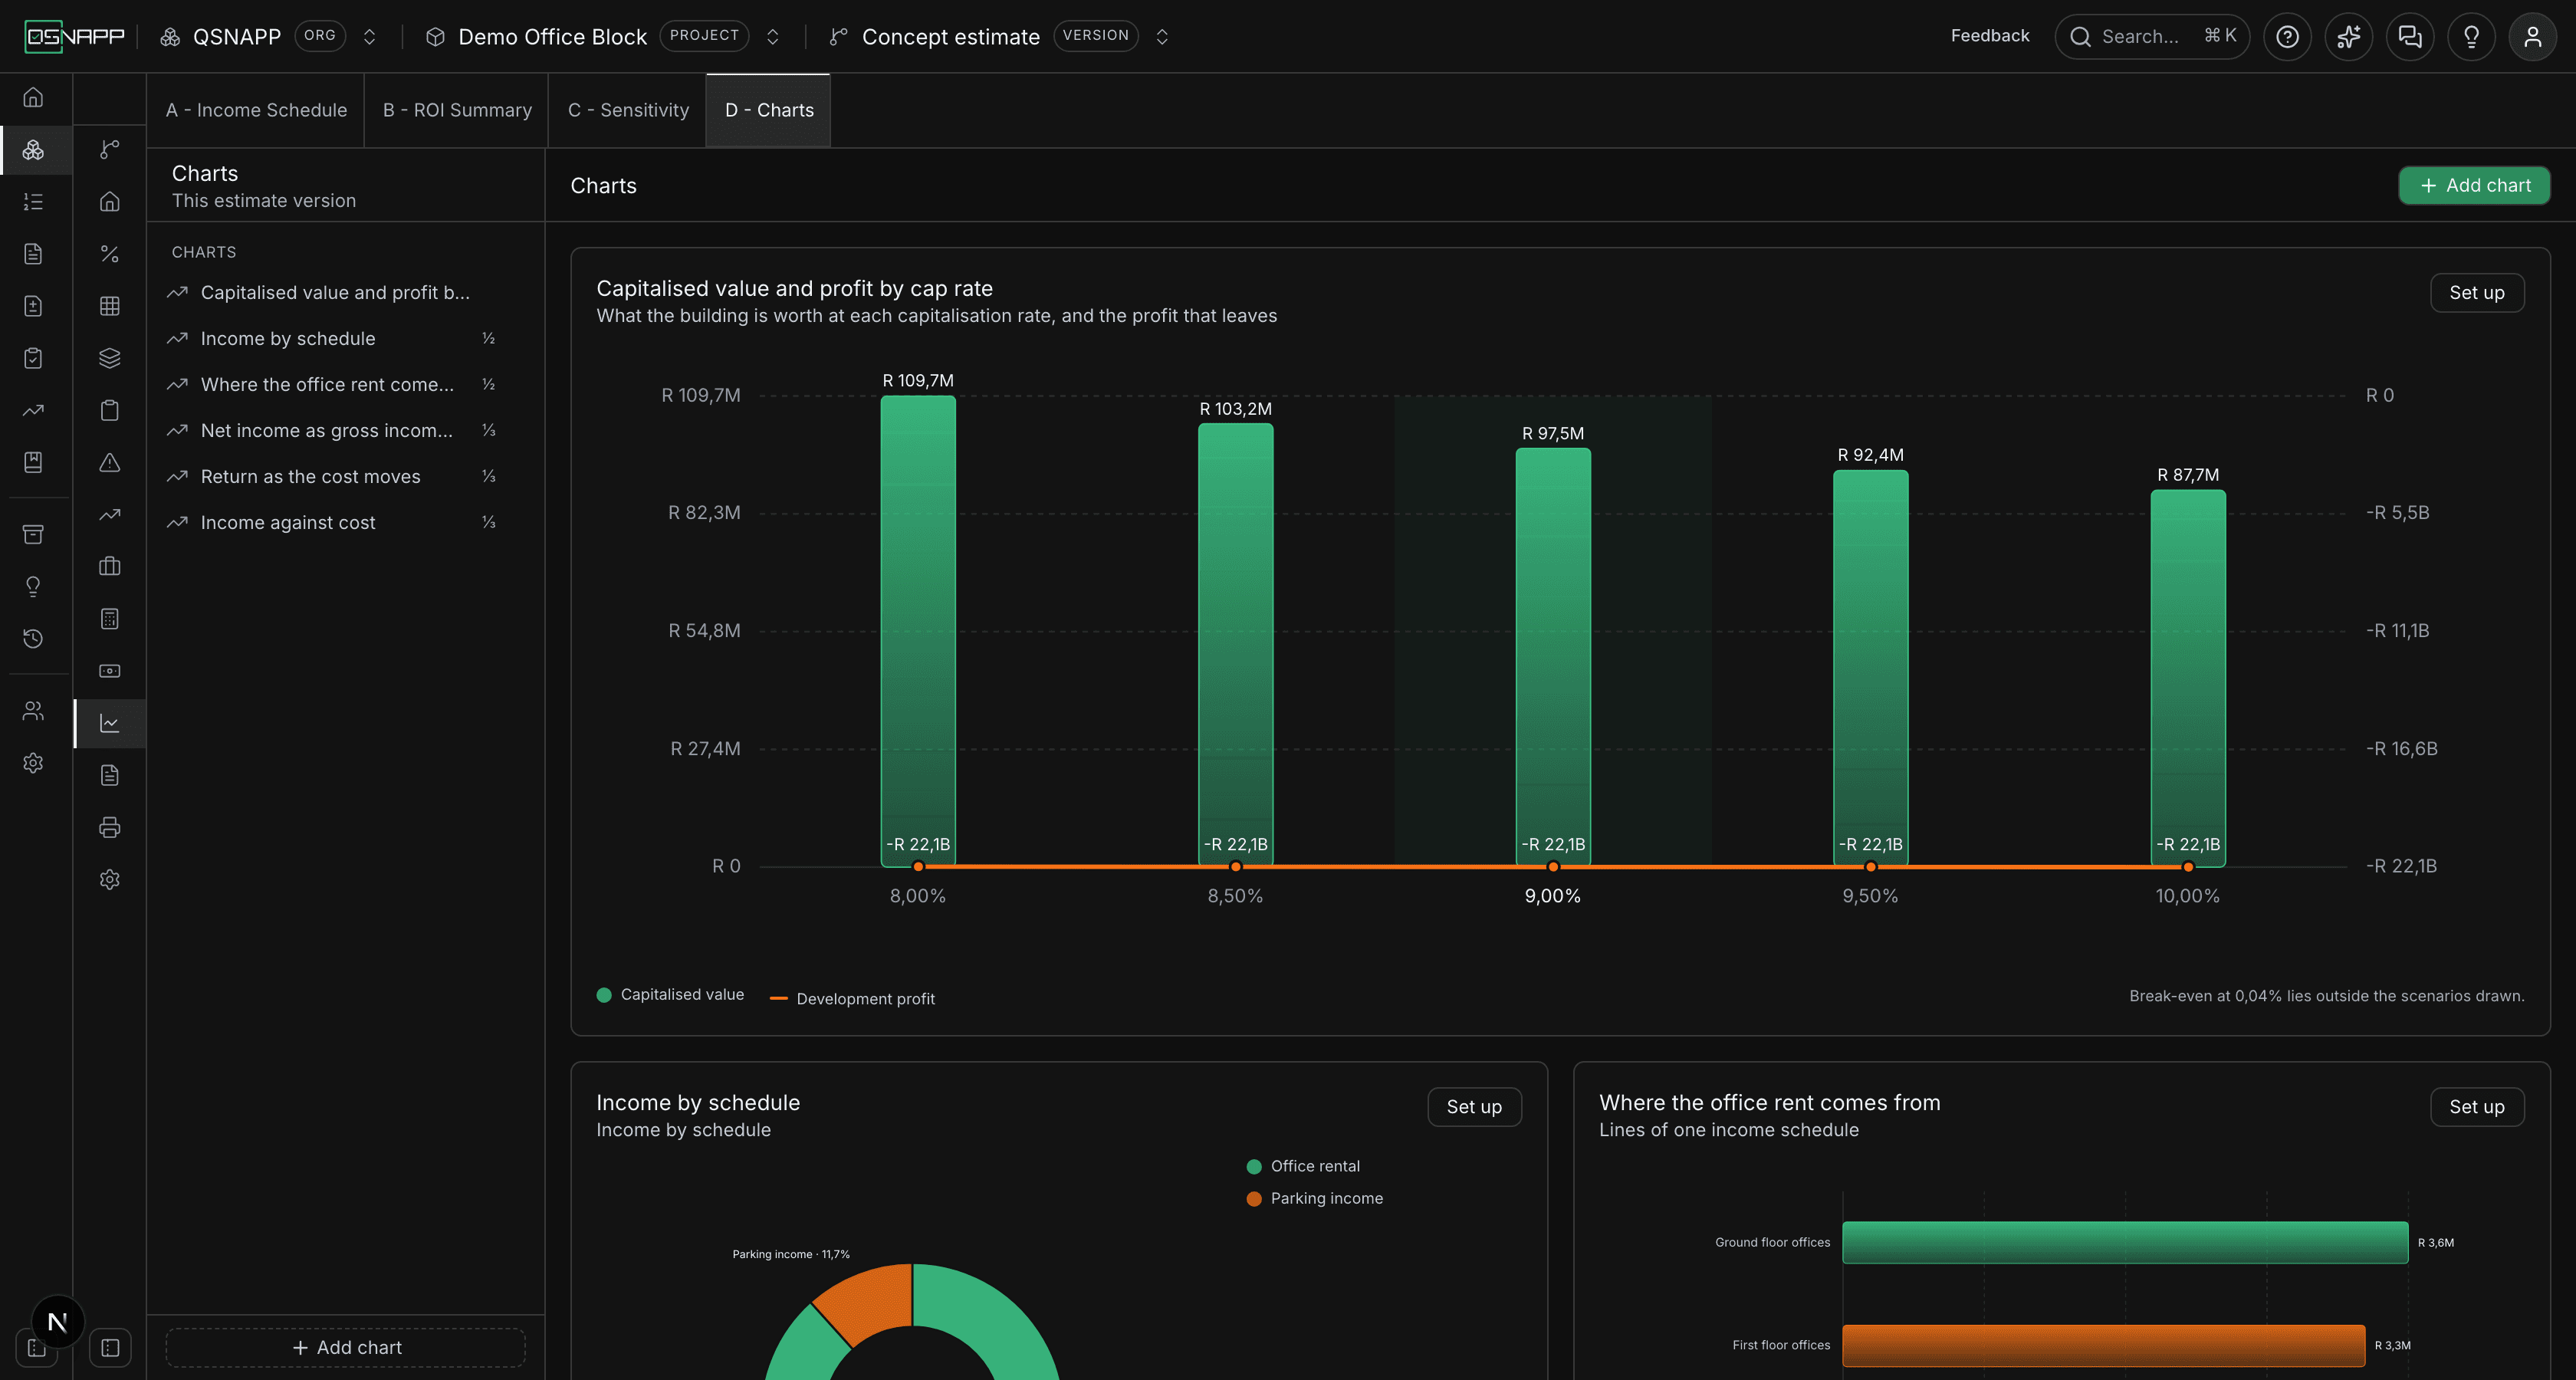
A chart draws what you tell it to, how you tell it to. A version holds as many charts as you like, in the order you give them, each at full width, half width or a third, so two or three sit side by side. The rail lists them in that order, marking the narrower ones ½ or ⅓; click a name to jump to the chart, and use its menu to set it up, move it up or down, duplicate it or delete it. Each chart also carries its own Set up button, and a subtitle: yours, or, when you give none, what the chart draws — the analysis and the row it varies, with break-even where there is one.
What a chart draws
- A sensitivity analysis: its scenarios along the bottom, and the rows it reads off across them — as bars and lines together, as stacked bars, or as plain bars. Only the rows the analysis reads off are offered; set the analysis up to add one. Break-even and today's figure are marked unless the chart is told not to. Deleting an analysis deletes the charts drawn from it, and says how many first.
- Figures from the summary: any rows and totals side by side — gross income against total project cost, capitalised value against profit — as bars, horizontal bars, a pie or a donut.
- The income: each schedule's income, or one schedule's lines, as bars or a pie of who pays what. Every schedule or line is drawn, in the palette's colours.
How it looks
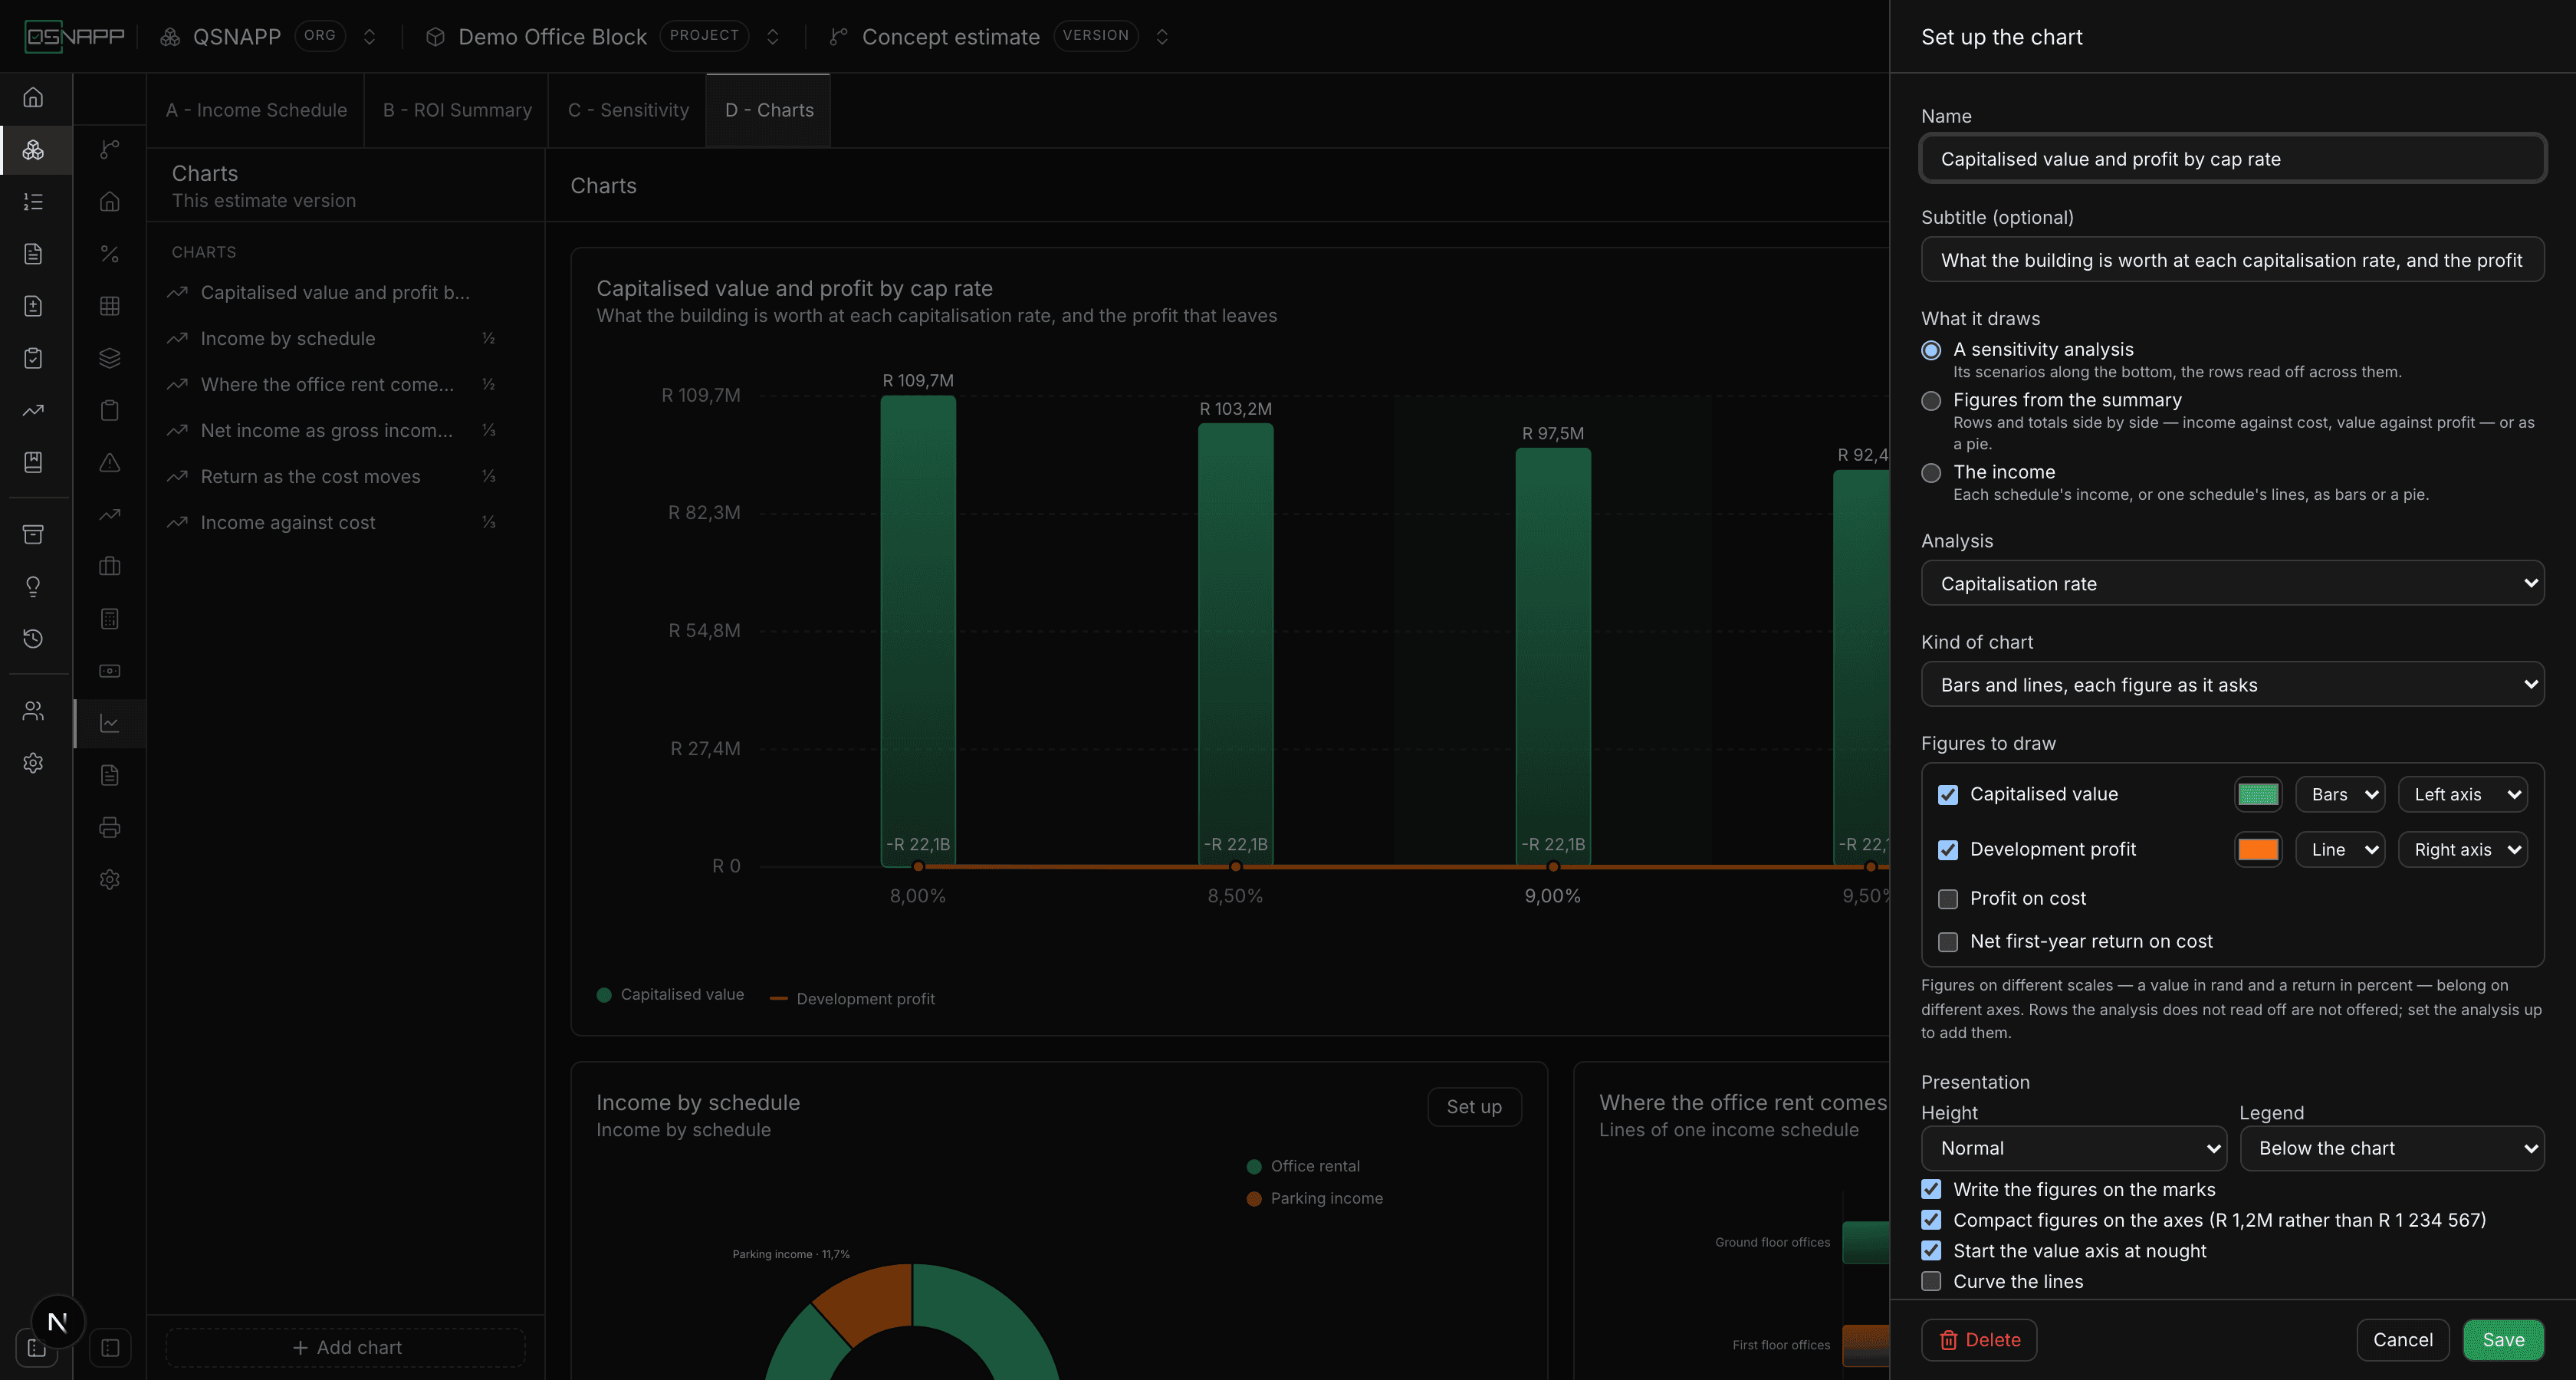
Each figure drawn is a series with its own colour — the palette's, or one you pick beside it. On a bars-and-lines chart each series is bars, a line or an area on the left or the right axis — put figures on different scales, a value in rand and a return in percent, on different axes, and each axis is scaled to the series on it. Several bar series share each slot side by side; stacked, they share one bar.
The rest is presentation: a subtitle, the height, where the legend sits, whether the figures are written on the marks, compact axis figures, whether the value axis starts at nought or at the smallest figure, curved lines, gridlines. A donut writes the total of what it shows in its middle. Duplicate a chart from the rail to try a variation without rebuilding it.
Reading a chart
Move the pointer over any scenario and every figure drawn there is listed, with today's marked; over a slice, its figure and its share. Click an entry in the legend to hide that series and read the others alone; click again to bring it back — a hidden series is struck through in the legend, and a donut's middle then says Shown rather than Total. Where break-even is marked, the legend carries it as a dashed green line. A pie takes the positive figures only and says which it left out; a bar chart leaves out a figure that has no value yet, and says so too.
What the rest of the estimate sees
Every formula's answer is also stored as a number — a line's quantity, rate and amount, a row's value — and the numbers are brought up to date whenever this tab is opened, which is how a line written as UNIT_NO * RATE catches up after the area schedule changed.
Printing it
On Print & Export the Return on Investment section — off until you tick it — prints what you built, as you built it: a table per income schedule with its own columns and totals (and a Total income table when there is more than one), the summary as its rows with an entered figure marked entered and a broken one not worked out, each sensitivity analysis with its break-even on a line of its own, and the charts drawn as they are on screen, in their order. Each part has a tick of its own. Tick the columns to choose which print — a schedule left with none drops out — and Print the place each line is aboutto print each line's place beside it, or Whole project for a line without one.
The other cost sections read by place too. Choose All locationsor particular places under a section's options and it gains a column per place beside the total: the elemental breakdown by each component's allocation, preliminaries and contingencies by their section's share, fees and the total project cost by the project's, escalation and the cash flow by the lines that belong there. What is measured in no place prints under Unallocated, so the columns always come to the total.