Print and export
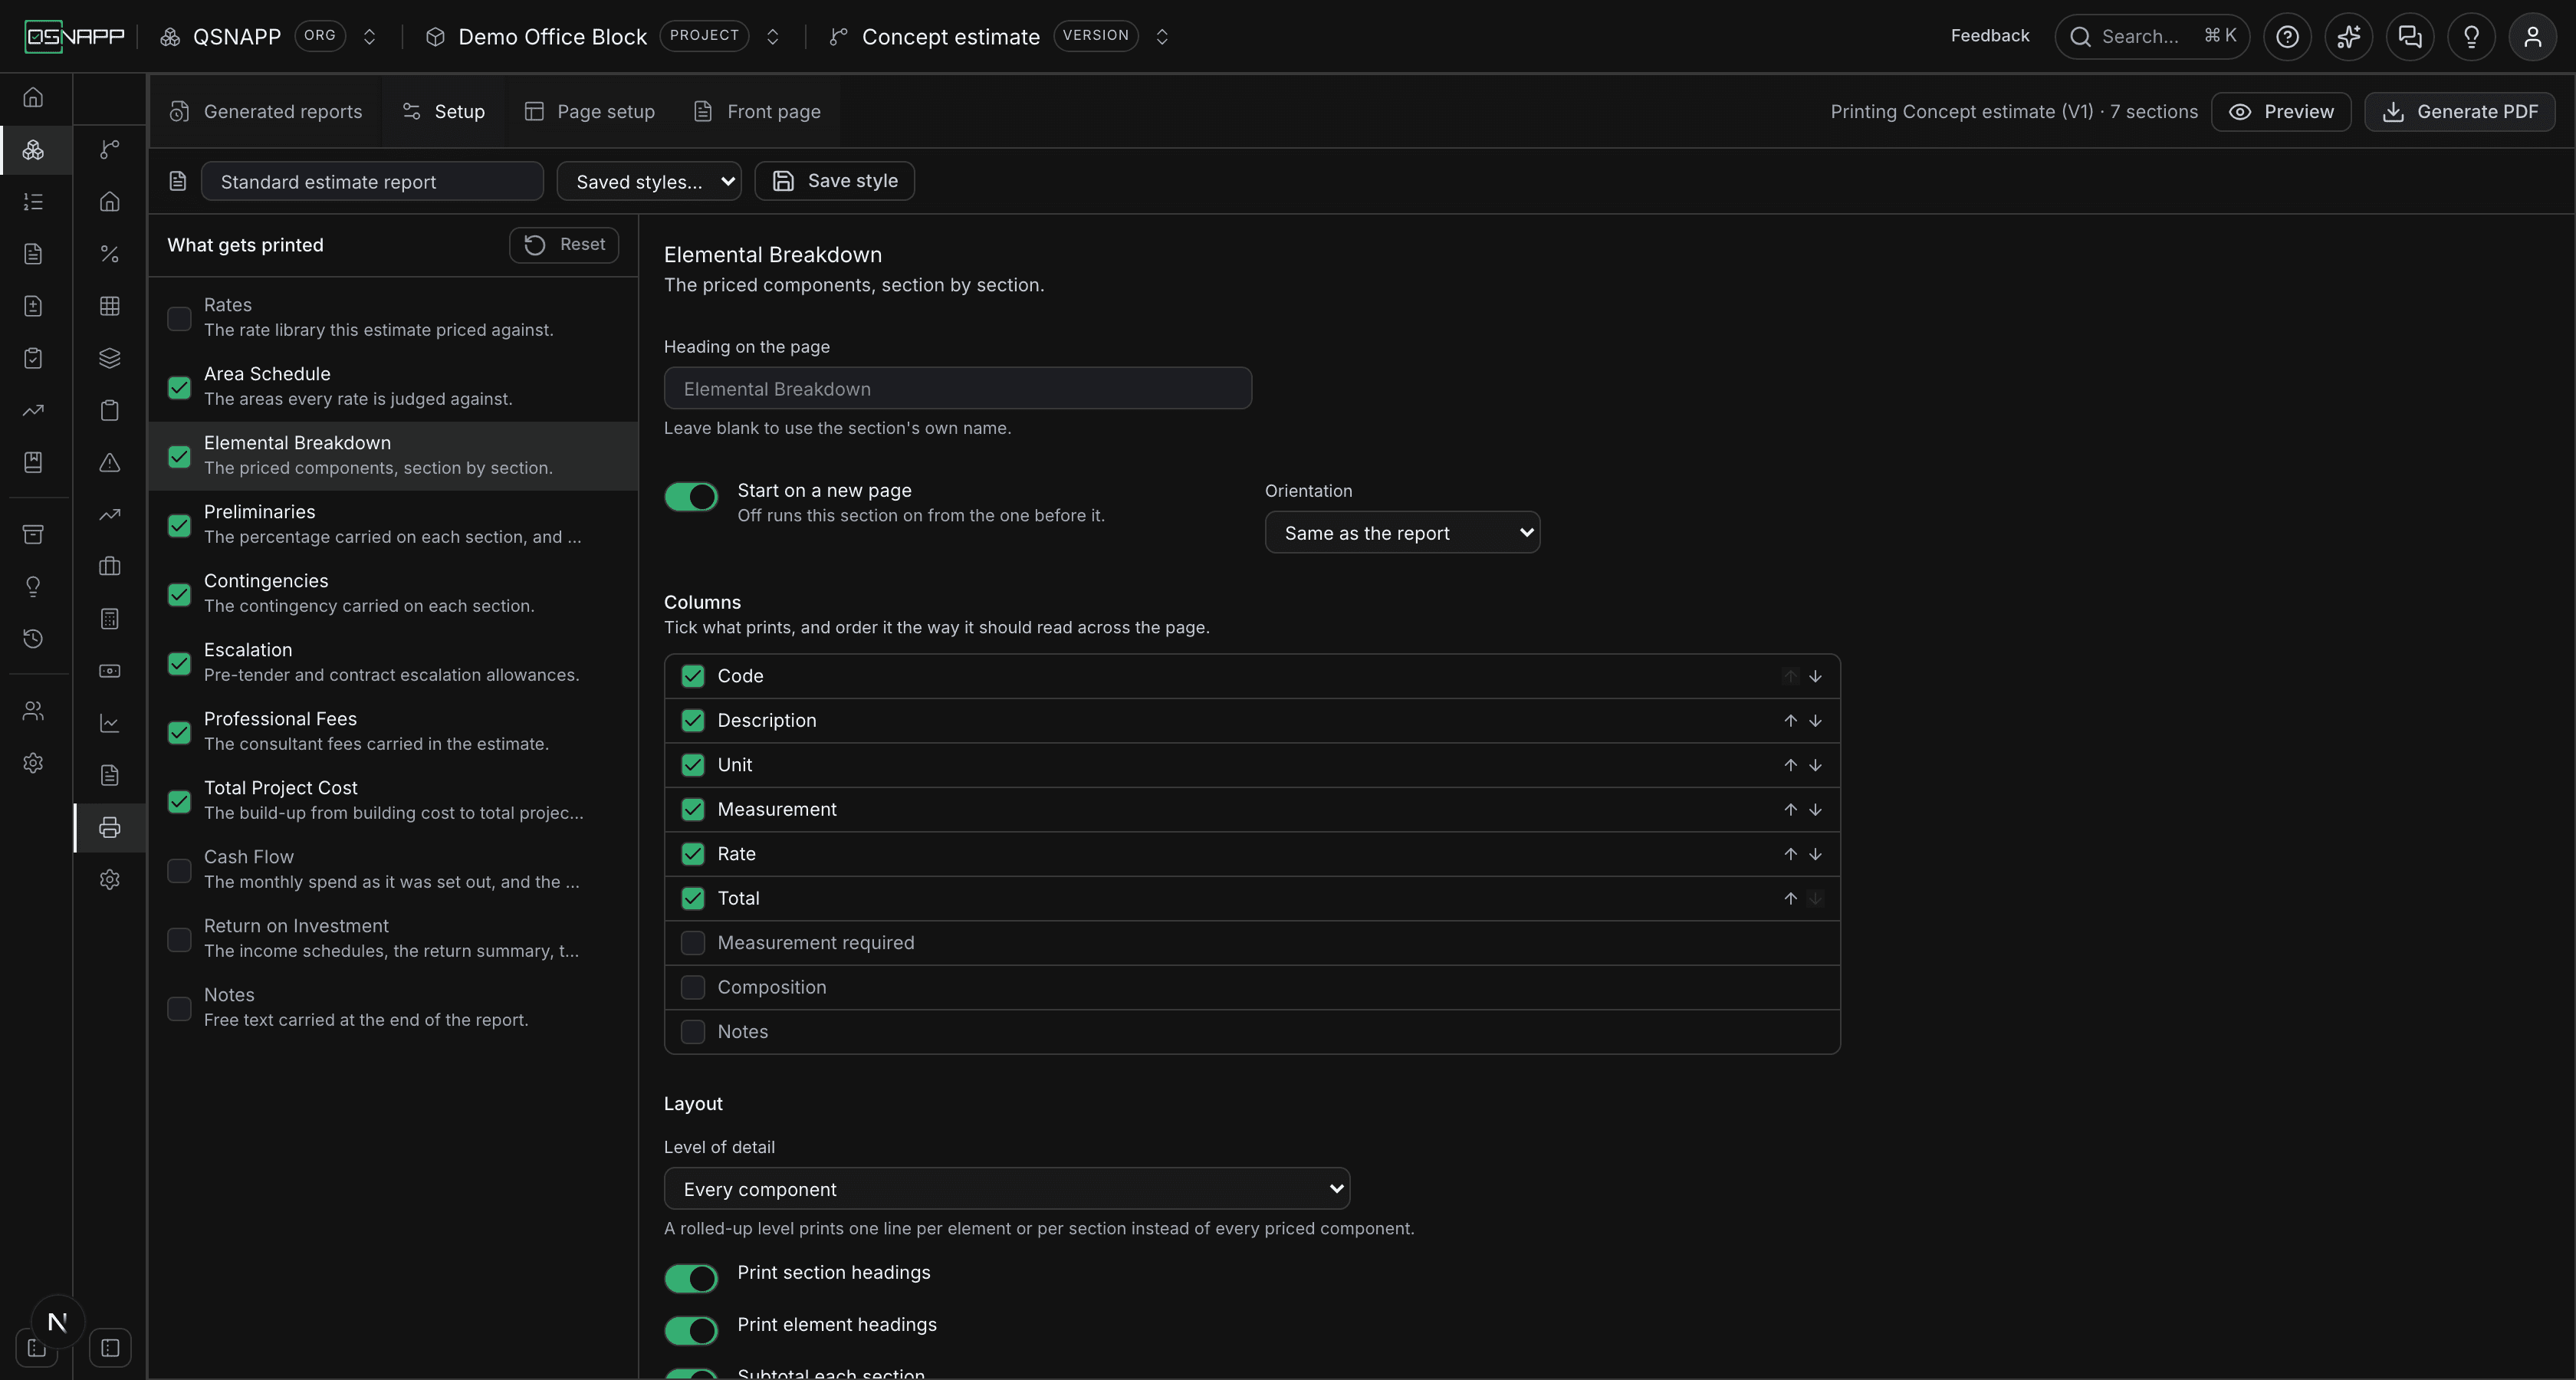
Print & Export turns an estimate version into a PDF. You choose which sections go in and in what order, what each one prints, and what the page and the front page look like; the report is generated on the server from the stored figures, and every report you generate is kept, with its setup, so there is always an answer to which one was sent. This guide goes through every setting on the tab: where it is, what it starts as, and what it does on paper.
What this screen is
An estimate is issued — to a client, a bank, a board — and what is issued is a document, not a screen. This tab is where that document is put together. It does not reprice anything and it does not draw the pages itself: it holds a setup (a list of sections, each with its columns and options, plus the page and the front page), posts that setup to the server, and gets a PDF back. The same setup can be saved as a house style and used again.
A report belongs to one estimate version — the one chosen in the header. The buttons are disabled until a version is chosen, and the list of reports already generated is the list for that version alone.
PDF is the only format. There is no Excel or Word export.
Finding your way around
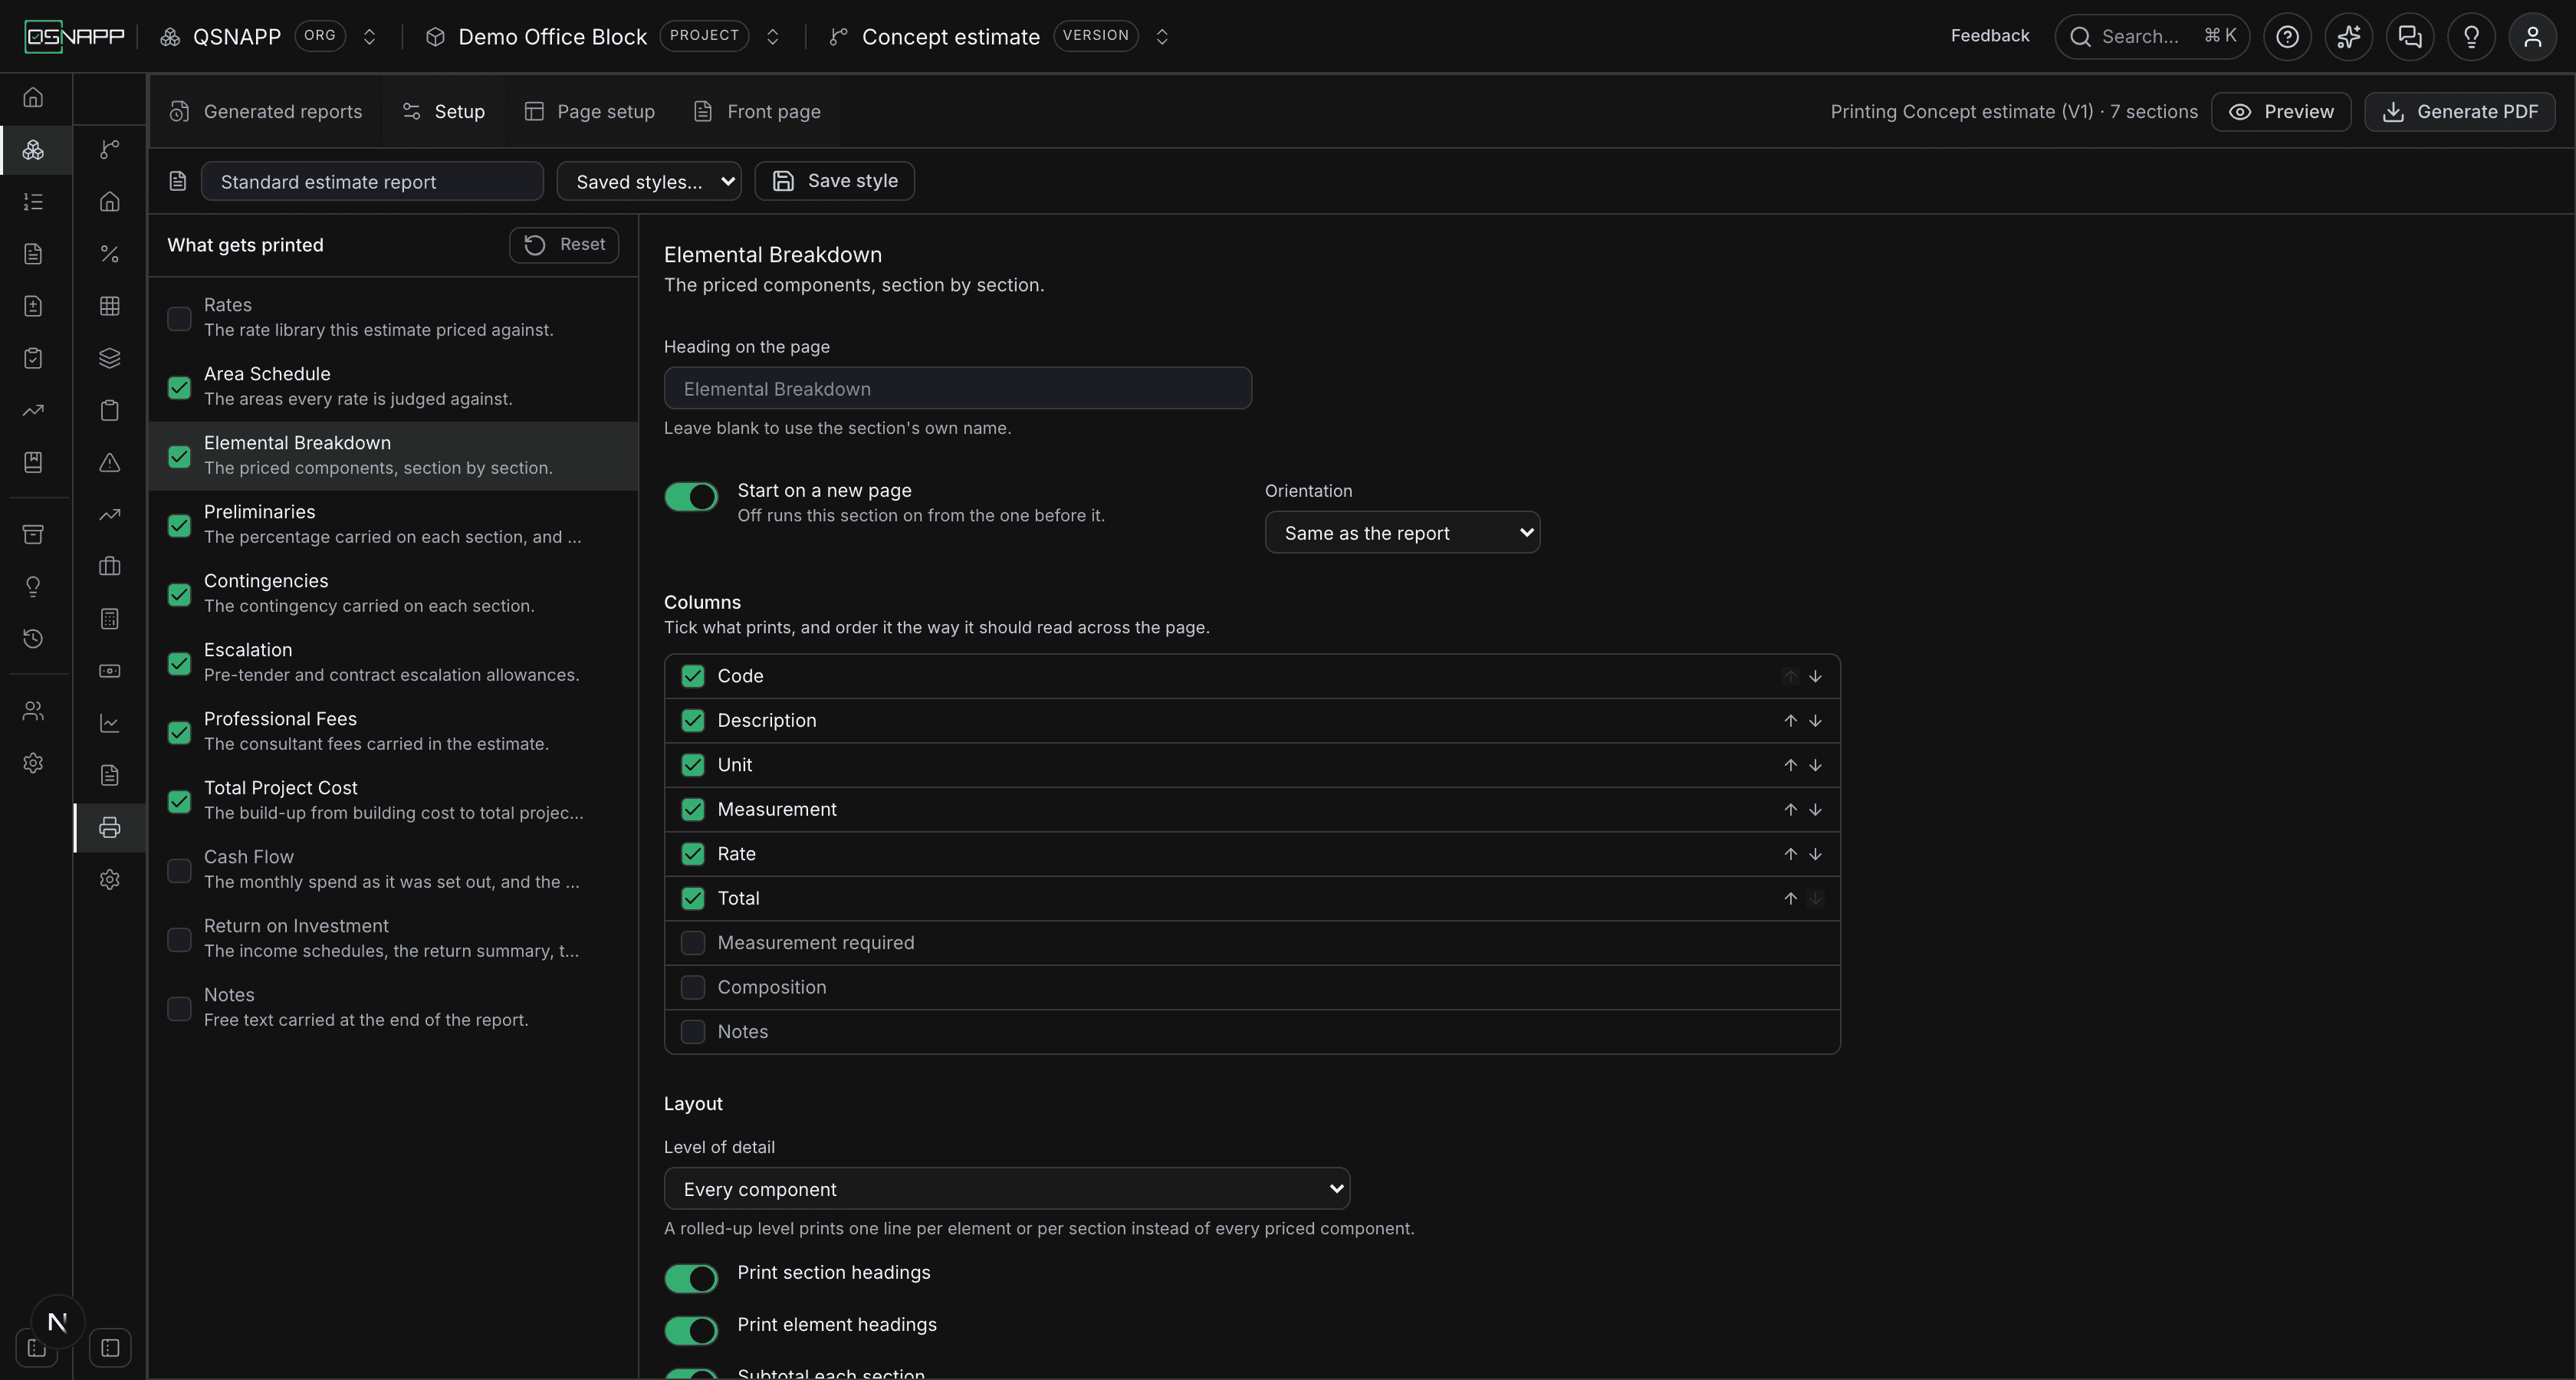
The strip across the top holds everything that is not a setting:
| Control | What it does |
|---|---|
| Generated reports | The view the screen opens on: every report already issued from this version. See Generated reports. |
| Setup | The builder: the rail of sections on the left and the selected section's settings on the right. |
| Page setup | Appears beside Setup while it is open. Paper, margins, page numbers, header and footer, logo and the draft mark — everything that applies to the whole document. See Page setup. |
| Front page | Also appears while Setup is open. The sheet the report opens on. See The front page. |
| Printing Concept estimate · 7 sections | A line at the right of the strip saying which version will be printed and how many sections are ticked. It reads No version selected until one is chosen, and is hidden on a narrow window. |
| Preview | Opens the PDF in a new tab without filing it. See below. |
| Generate PDF | Downloads the PDF and files it under Generated reports. Both buttons are disabled until a version is chosen, and while a report is being made. |
The style bar
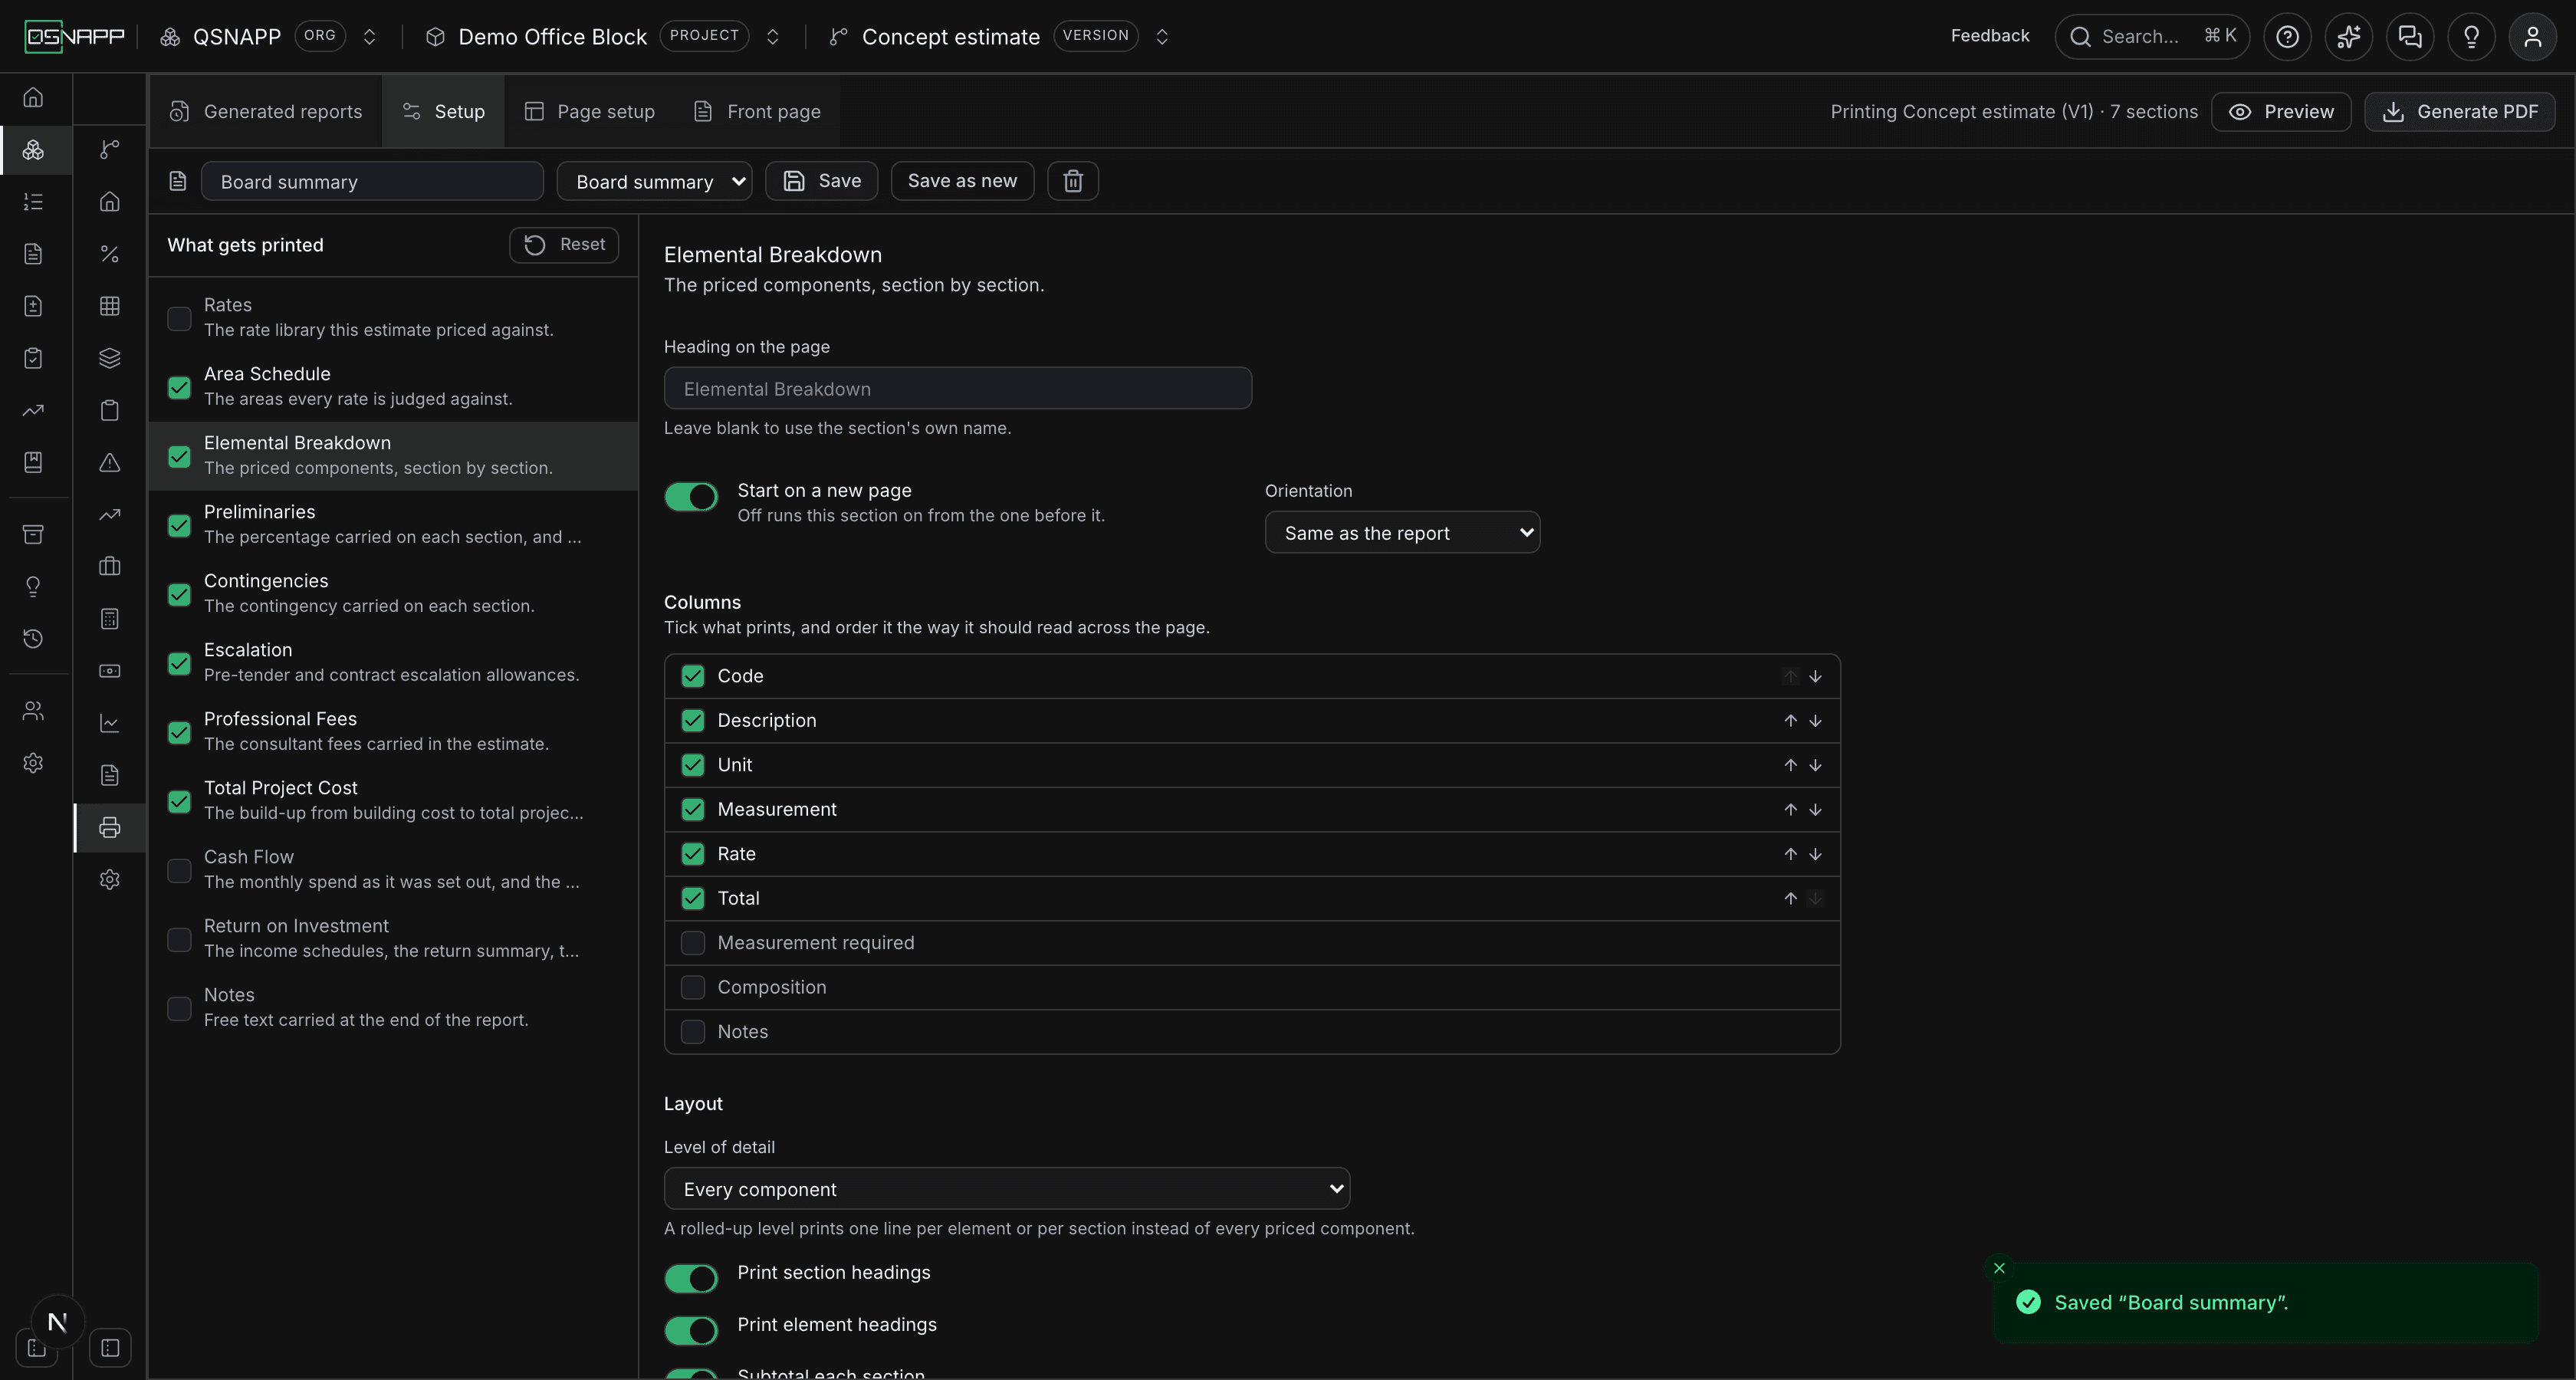
Under the strip, in Setup, is the row that names the setup you are working on and keeps it for later. A setup with a name is a style.
| Control | To start with | What it does |
|---|---|---|
| Report style name | Standard estimate report | The name of the setup. It is printed nowhere; it is what the setup is saved as, what a generated report is listed under, and the first half of the name a stored document downloads with. |
| Saved styles… | empty | The styles saved in this browser, alphabetically. Choosing one loads it into the builder, replacing every setting with the style's. |
| Save style | Saves the current setup under the name in the box and selects it in the list. With a style already loaded the button reads Save, and writes over that style. | |
| Save as new | Shown once a style is loaded. Saves the current setup as a second style, under the name in the box, leaving the loaded one as it was. | |
| Bin | Shown once a style is loaded. Deletes that style, with no confirmation. The setup stays in the builder; only the saved copy goes. |
Styles live in this browser only — see Saved styles for what that means.
What gets printed
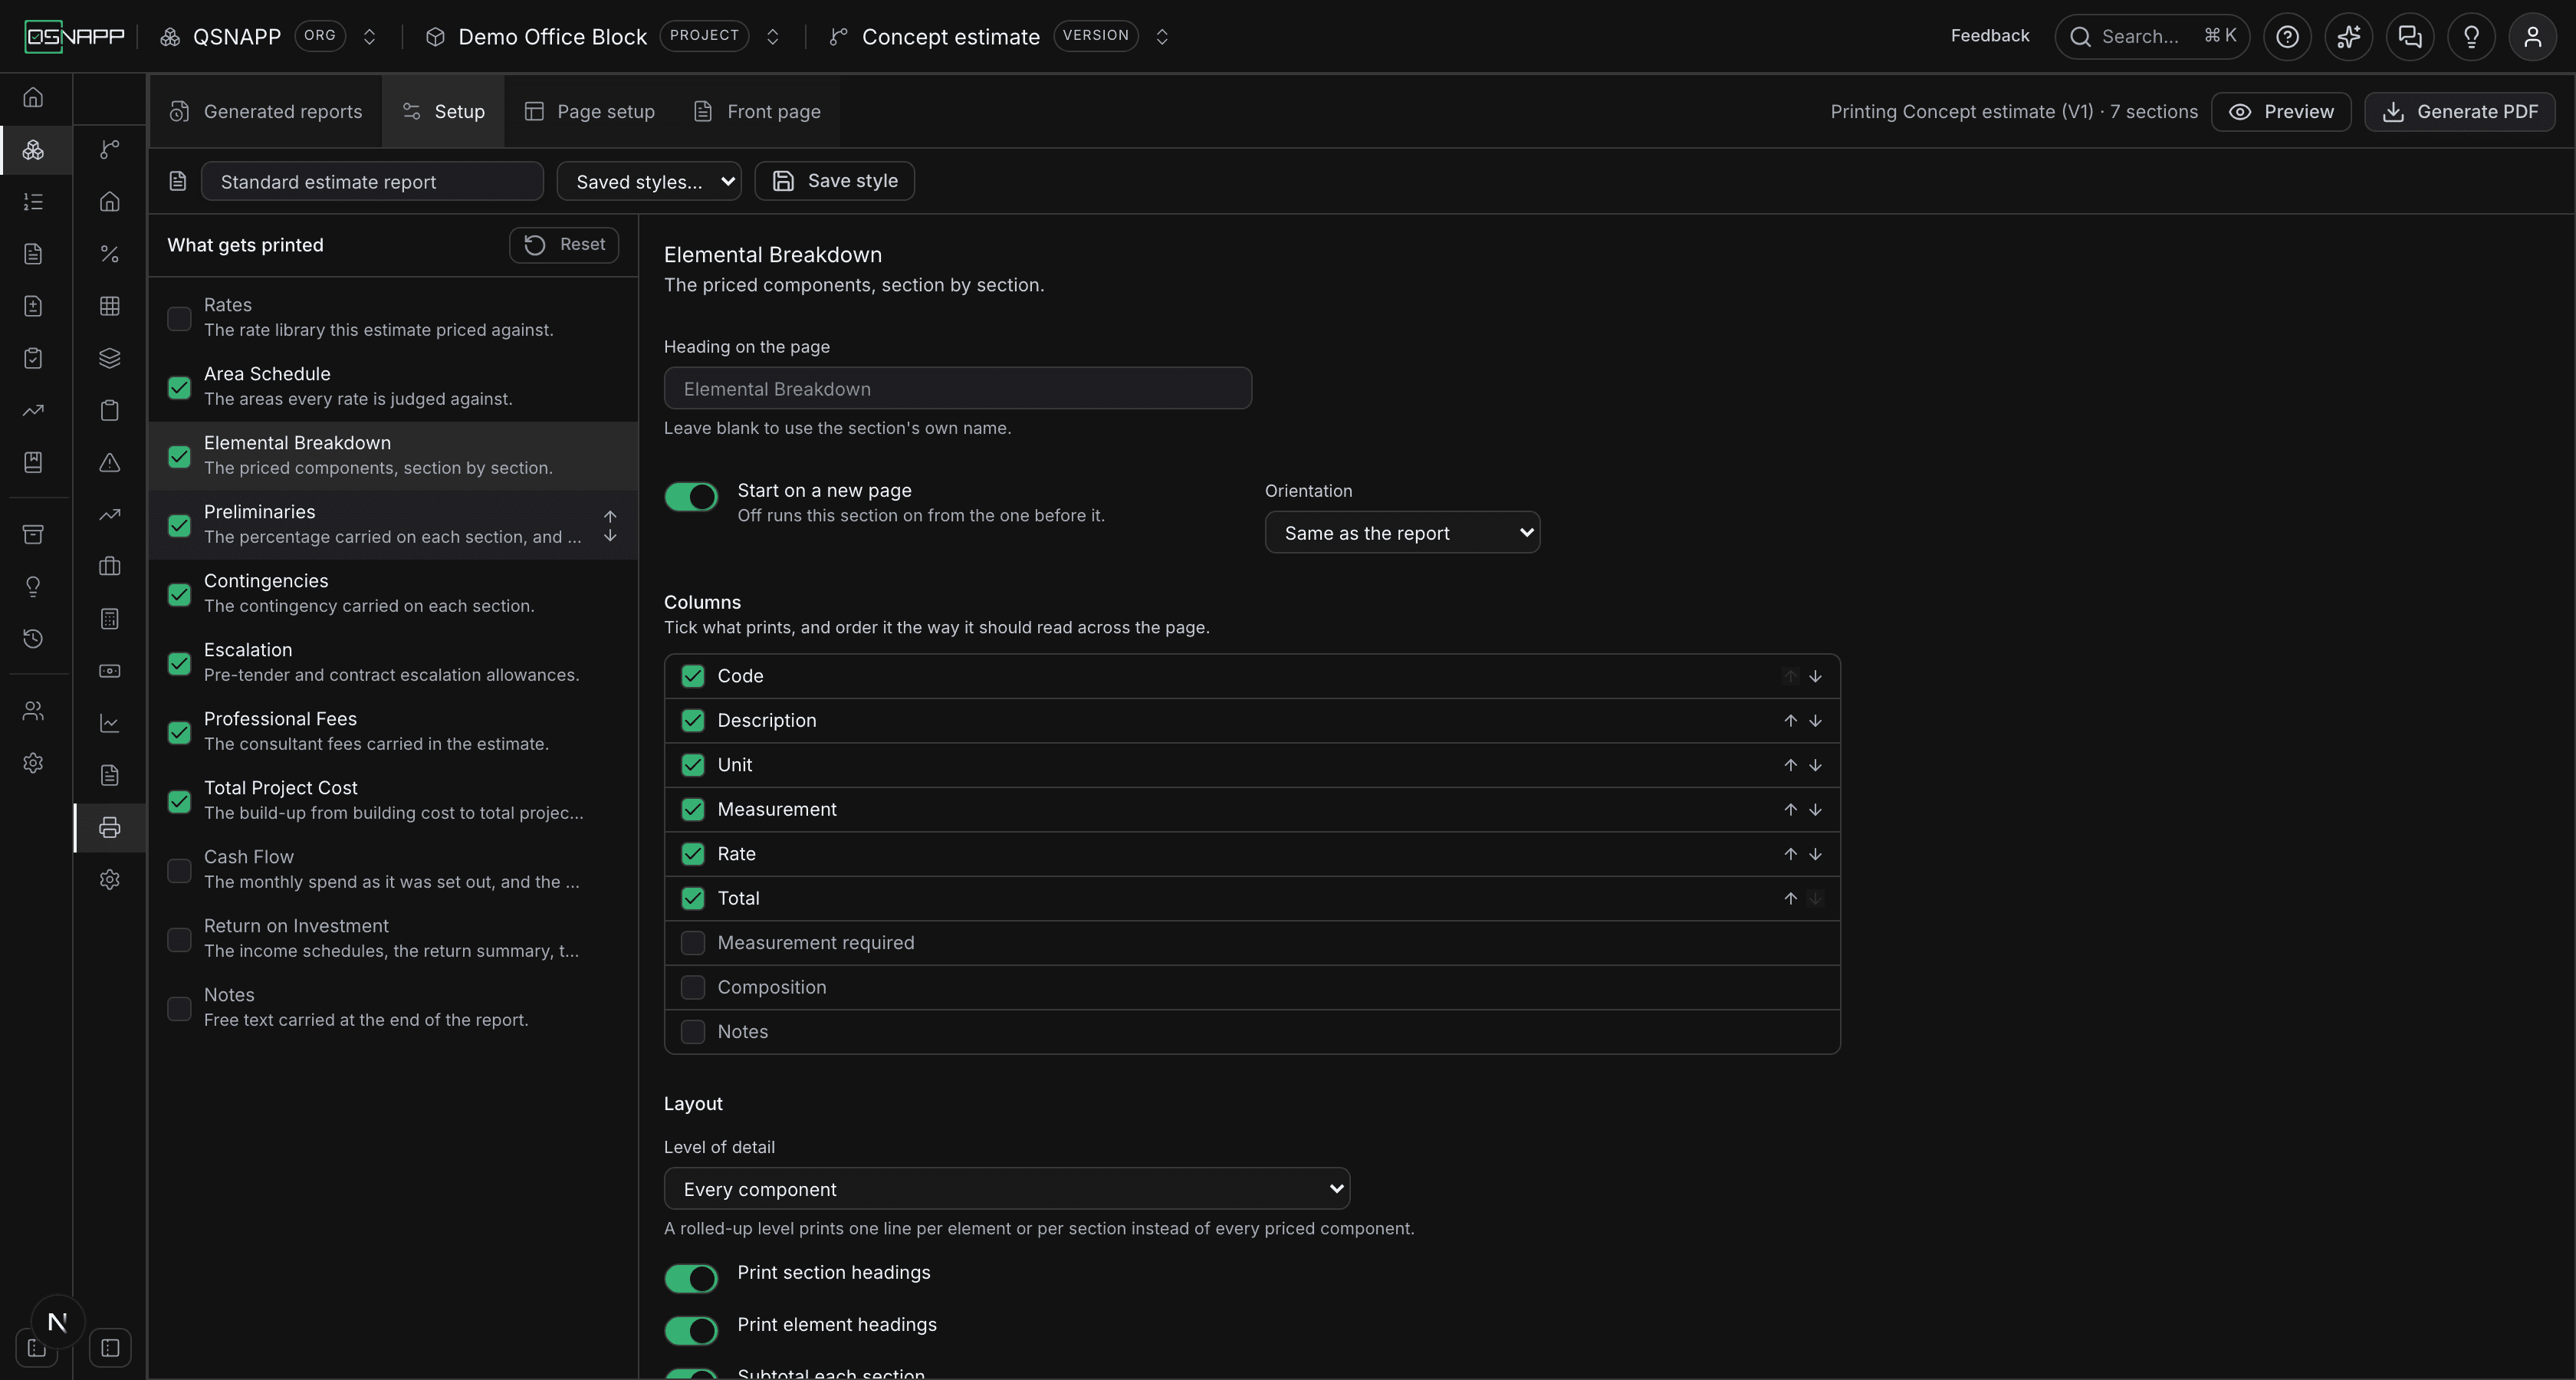
The rail on the left, headed What gets printed, is the report. It lists every section the report can hold, top to bottom in print order. Each row has:
- A tick. Ticked, the section prints; unticked, it is kept in the rail with its settings but left out of the document. Its name goes grey.
- The name and a line under it.The section's own name, or the heading you have given it under its settings, with a line saying what it prints. Click the name to open the section's settings on the right.
- Two arrows, shown when the pointer is over the row, that move the section one place up or down. The top row cannot move up and the bottom row cannot move down.
Reset, at the top of the rail, puts every section, column and option, the page setup and the front page back to their defaults. Only the style name is kept. It does not touch any saved style.
The sections and what each prints
A fresh setup lists the sections in the order the estimate is built up, which is the order of the tabs. Seven are on to start with; the four that are off are the ones an issued estimate usually does not carry. Every section starts on a new page and takes the report's orientation, except the cash flow, which starts at landscape.
| Section | On to start | What it prints |
|---|---|---|
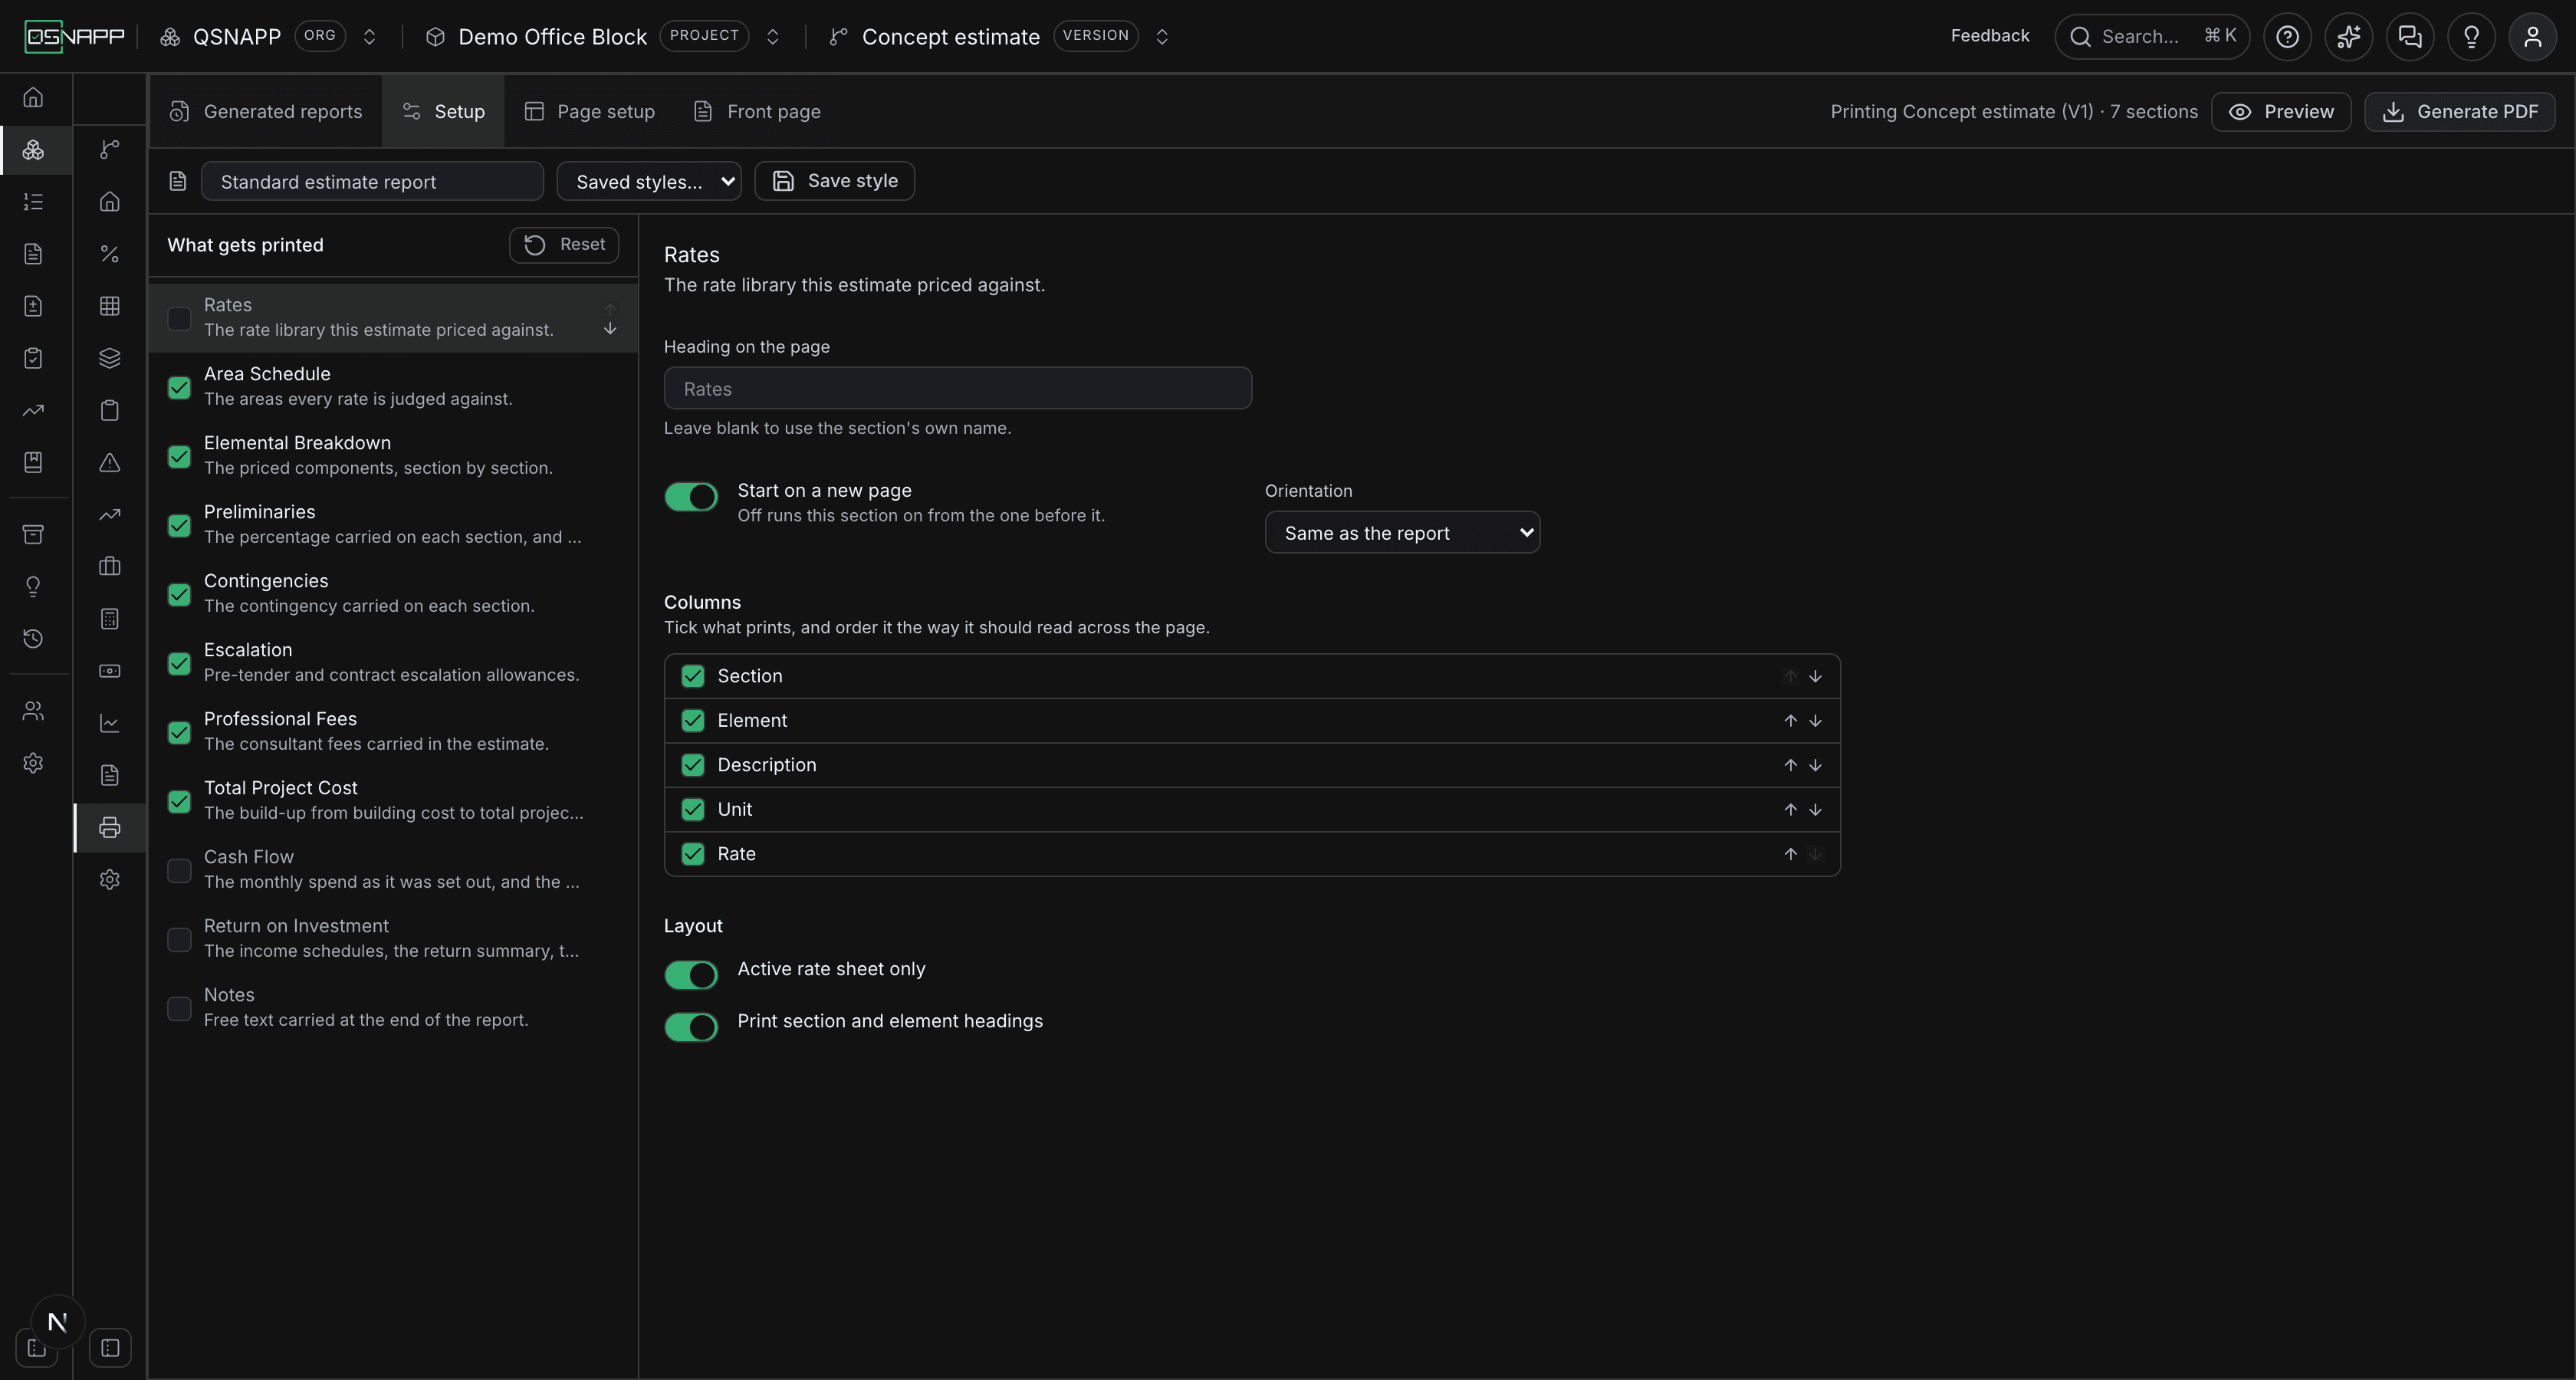
| Rates | No | The project's rate sheet: section, element, description, unit and rate, sheet by sheet, leaving out sections with no priced items. |
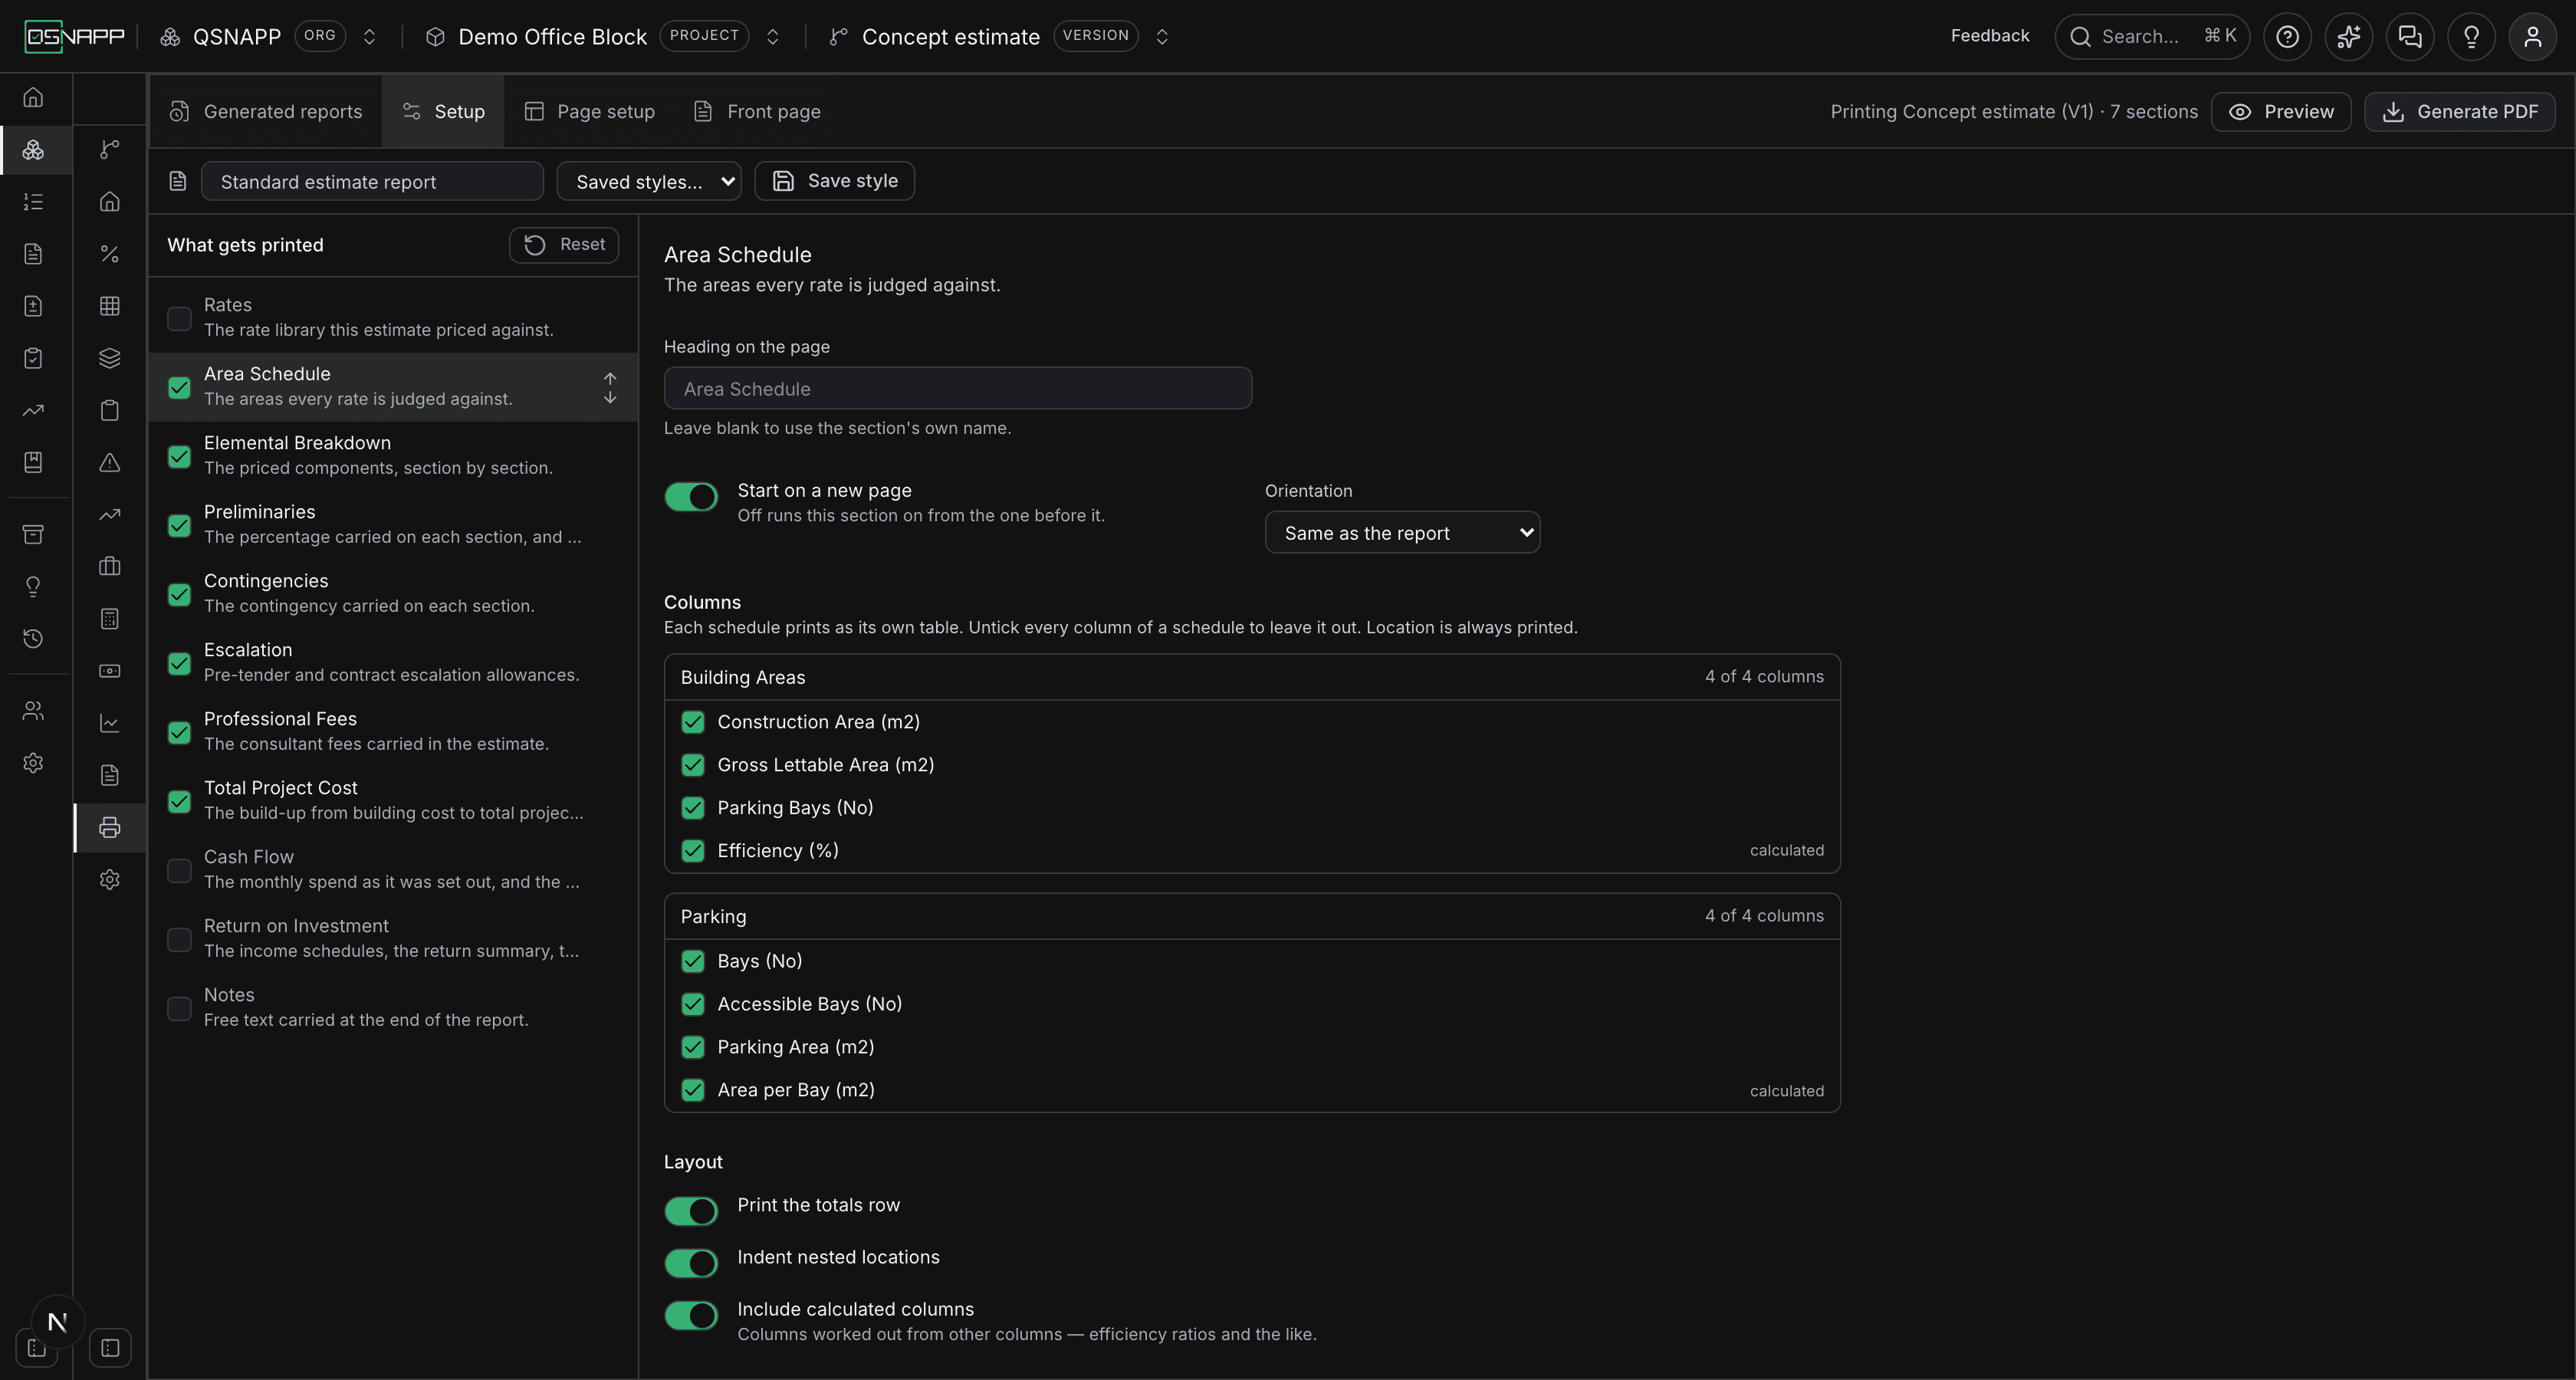
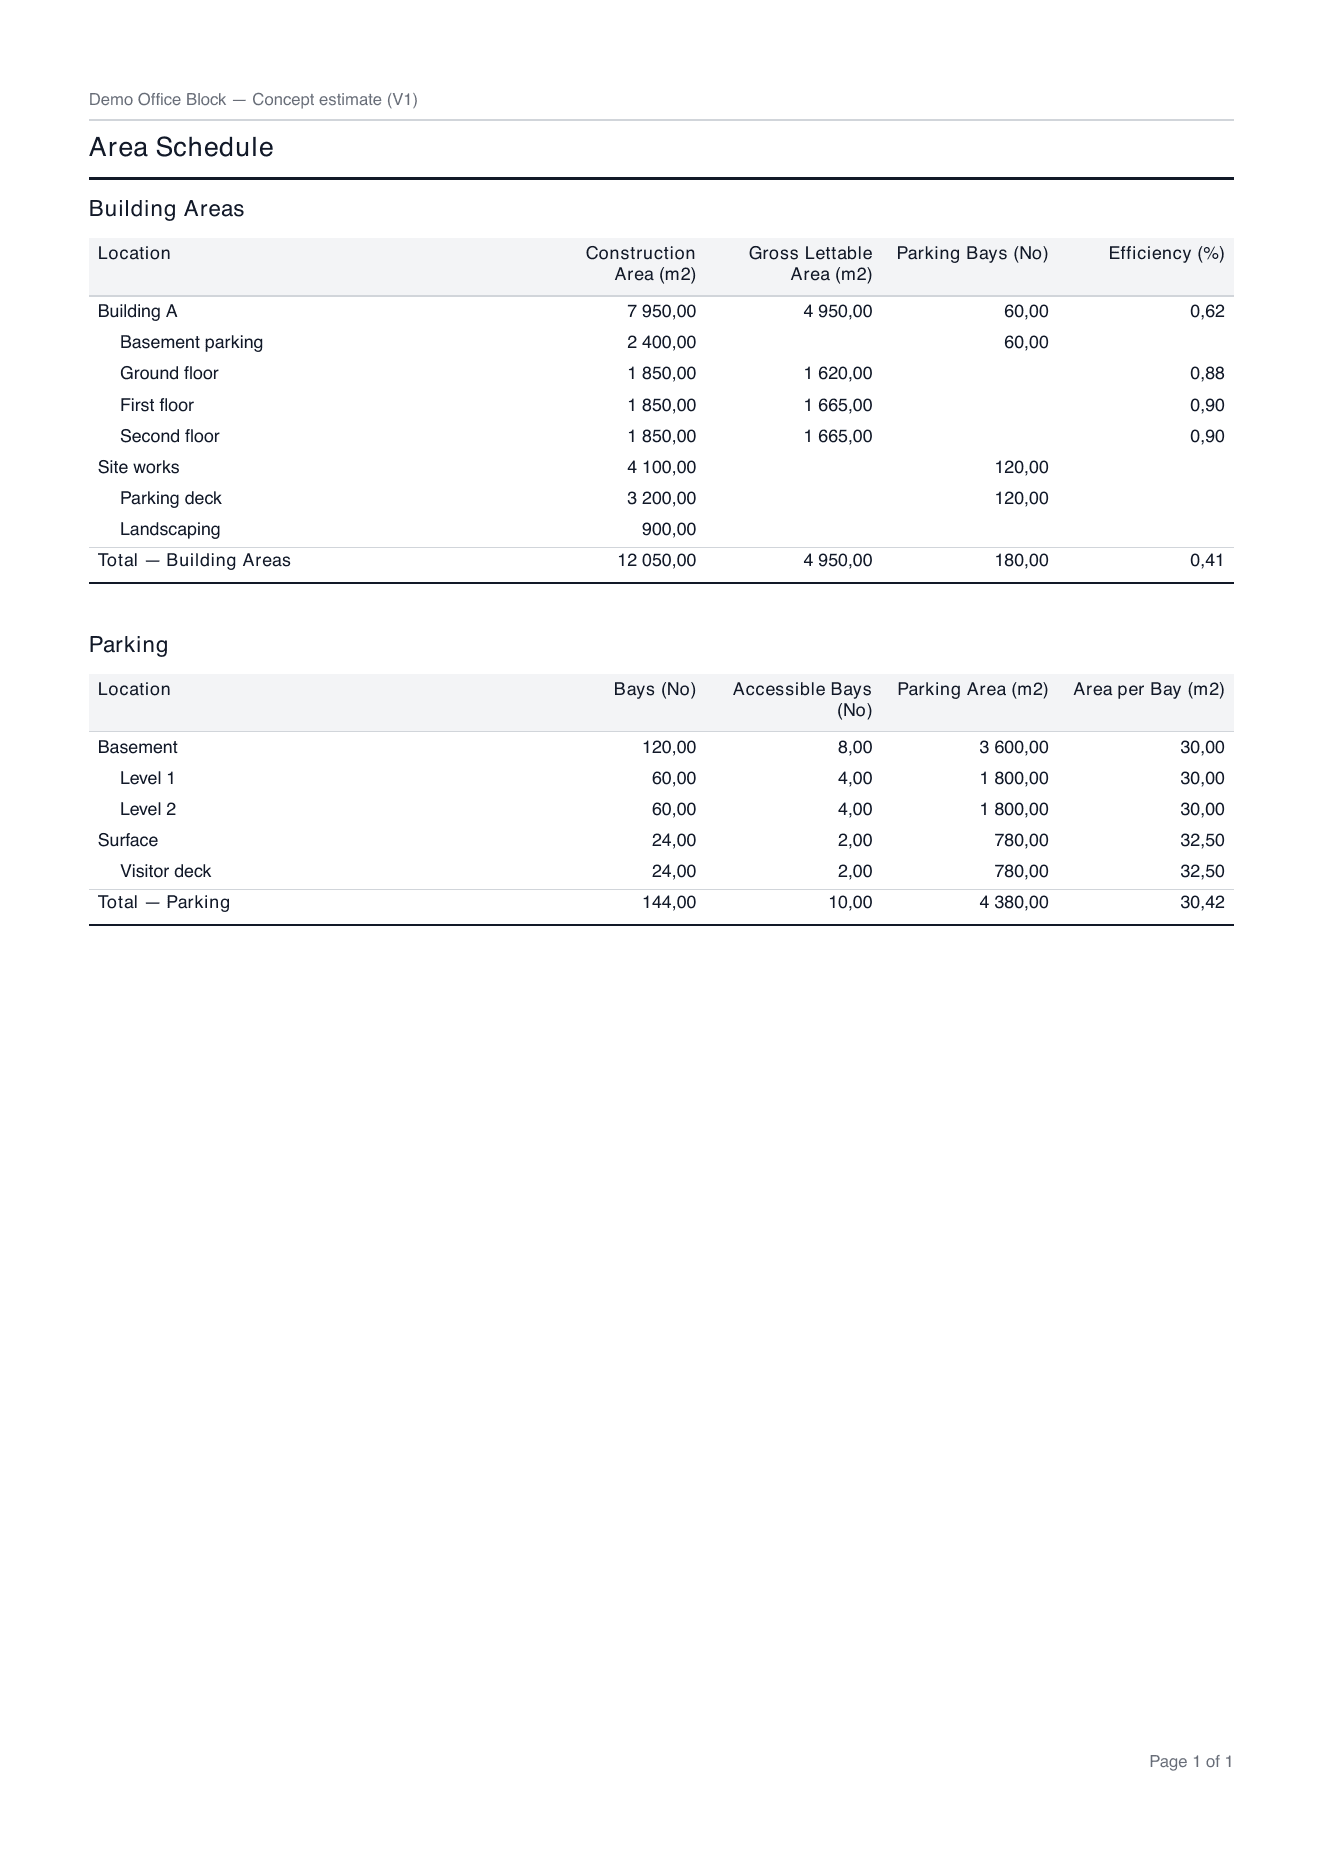
| Area Schedule | Yes | One table per area schedule, each with its own columns, its places, and a Total row. |
| Elemental Breakdown | Yes | The priced components of the elemental breakdown under their section and element headings, a subtotal per section, and Total estimated building cost at the foot — or one line per element or per section, if you ask for less. |
| Preliminaries | Yes | One row per elemental section: code, section, section total, the percentage and the preliminaries it comes to, with Total preliminaries. |
| Contingencies | Yes | The same shape, the base column being the section with its preliminaries on — Section + prelims — and the contingency on it. |
| Escalation | Yes | The escalation rows under Pre-tender escalation and Contract escalation headings, each with its amount, dates, months, rate and escalation, and Total escalation. |
| Professional Fees | Yes | One line per consultant from Professional fees: name, discipline, basis (Standard or ASAQS scale), fee base and fee excluding VAT, with Total professional fees. |
| Total Project Cost | Yes | The lines of the Total project cost tab under Development costs, Land costs and Post-capital costs, and a Total project cost adjustments line. |
| Cash Flow | No | The cash flow as it was set out — every line across the months, or one row per month — with its graph. Landscape by default. |
| Return on Investment | No | The income schedules, the ROI summary, the sensitivity analyses and the charts, as the ROI guide describes them. |
| Notes | No | Free text, typed on this screen, printed at that point in the report. Left blank, the section prints No notes were entered. |
A section with nothing to print is not dropped; it prints its heading and a line saying so — This version has no priced components, No consultants have been added, No escalation has been allowed for, This project has no rate sheet, and the like — so a reader can tell an empty section from a forgotten one.
Settings every section has
Select a row and the panel on the right opens with the section's name, the line that says what it prints, and then these three, which every section has:
| Setting | To start with | What it does |
|---|---|---|
| Heading on the page | blank | The heading printed at the top of the section. Blank prints the section's own name — Elemental Breakdown. Anything typed replaces it, on the page and in the rail, and in the Generated reports list afterwards. |
| Start on a new page | On | On, the section begins at the top of a fresh page. Off, it runs on from the section before it, a little below that section's last line — the way a short preliminaries table can follow the breakdown without a page to itself. The first section always starts on the first page after the front page, whatever the switch says. |
| Orientation | Same as the report | Same as the report takes the orientation under Page setup; Portrait and Landscape — wide tables turn this section on its own. A section turned differently from the one before it always begins a new page, whatever Start on a new page says, and the page after it turns back. |
Below those come Columns — which print and in what order — and then, under Layout, the options the section has of its own. Notes has neither; it has a text box instead.
Columns
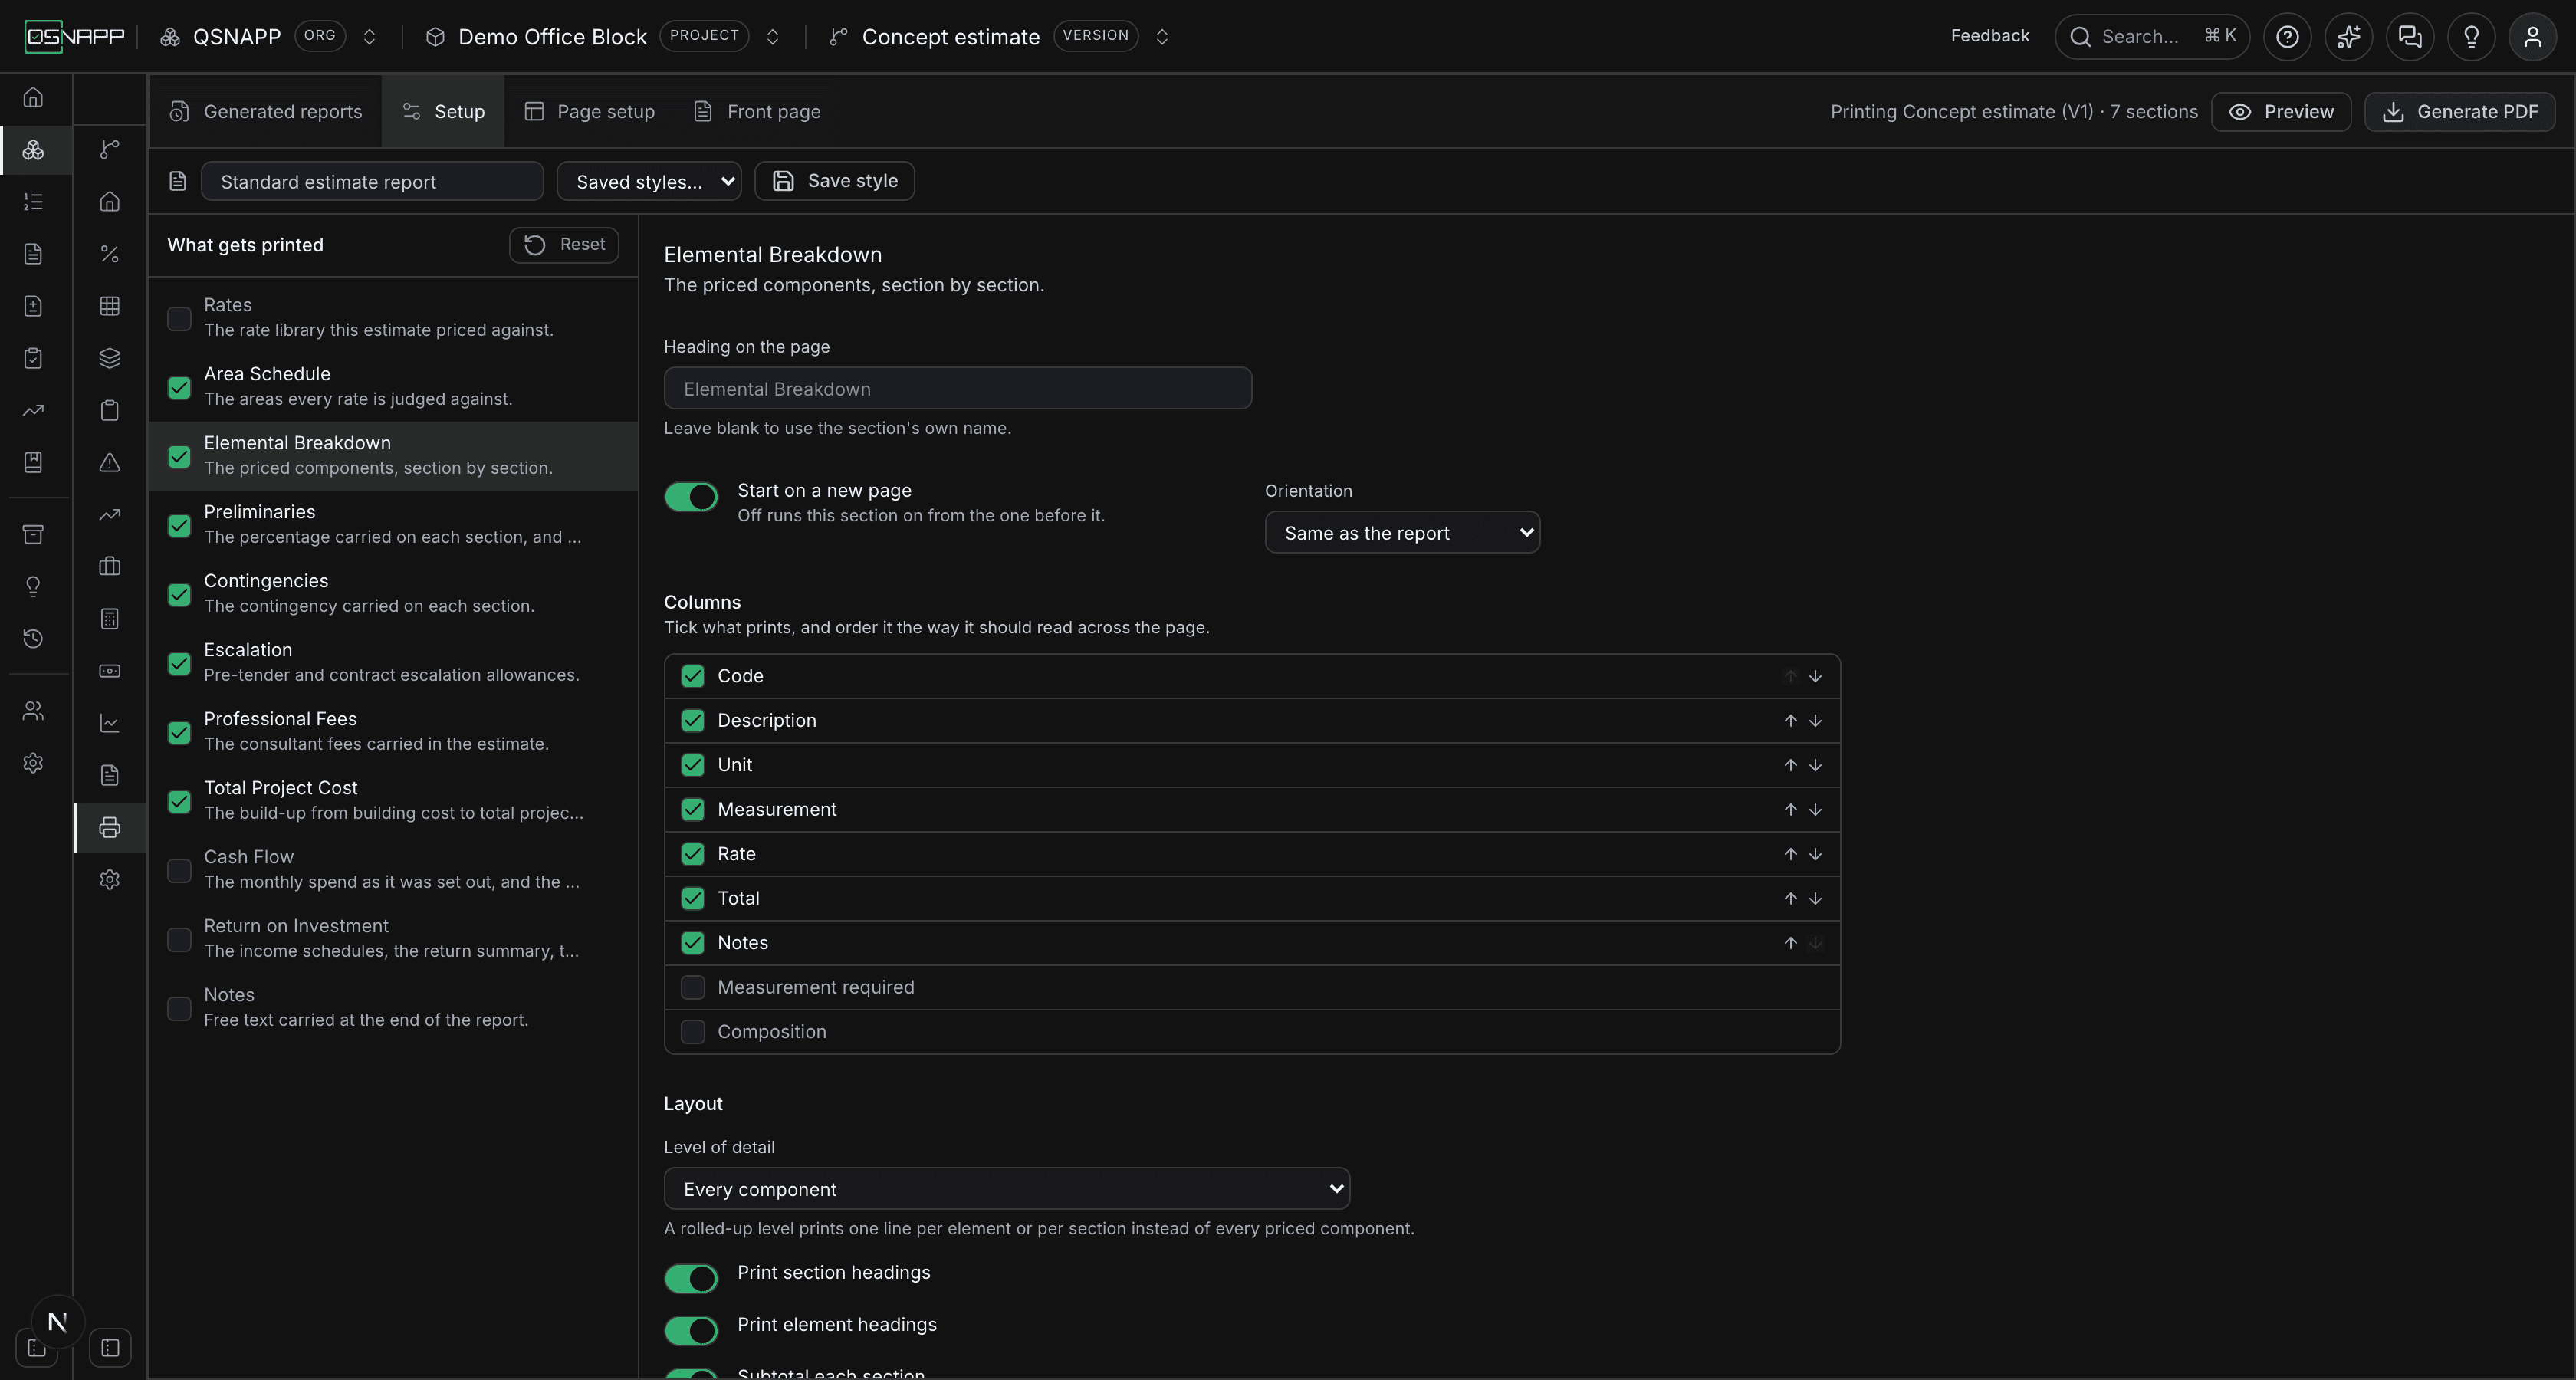
Most sections list their columns with a tick against each. The ticked ones are listed first, in the order they will read across the page, and each carries two arrows that move it one place left or right; the unticked ones follow, greyed. Tick a column and it joins the end of the printed ones; untick it and it drops out. The last ticked column cannot be unticked — a table of no columns is not a thing to print.
Column widths on the page are shares of the width, not fixed measurements, so the same setup prints sensibly on A4 portrait and A3 landscape. Money columns are right-aligned and print in the South African convention; text columns wrap.
Which columns each section has, and which start ticked:
| Section | Ticked to start | Unticked to start |
|---|---|---|
| Rates | Section, Element, Description, Unit, Rate | — |
| Elemental Breakdown | Code, Description, Unit, Measurement, Rate, Total | Measurement required, Composition, Notes |
| Preliminaries | Code, Section, Section total, %, Preliminaries | — |
| Contingencies | Code, Section, Section + prelims, %, Contingency | — |
| Escalation | Amount, From, To, Months, % p.a., Escalation | Base index, Index |
| Professional Fees | Consultant, Discipline, Basis, Fee base, Fee (excl VAT) | Discount % |
| Total Project Cost | Description, Rate, Amount | Unit, Quantity, Notes |
| Cash Flow | Description, Total — the months are added by the layout | — |
| Area Schedule, Return on Investment | Your own columns — see below | |
| Notes | None; it is text | |
Columns that are yours
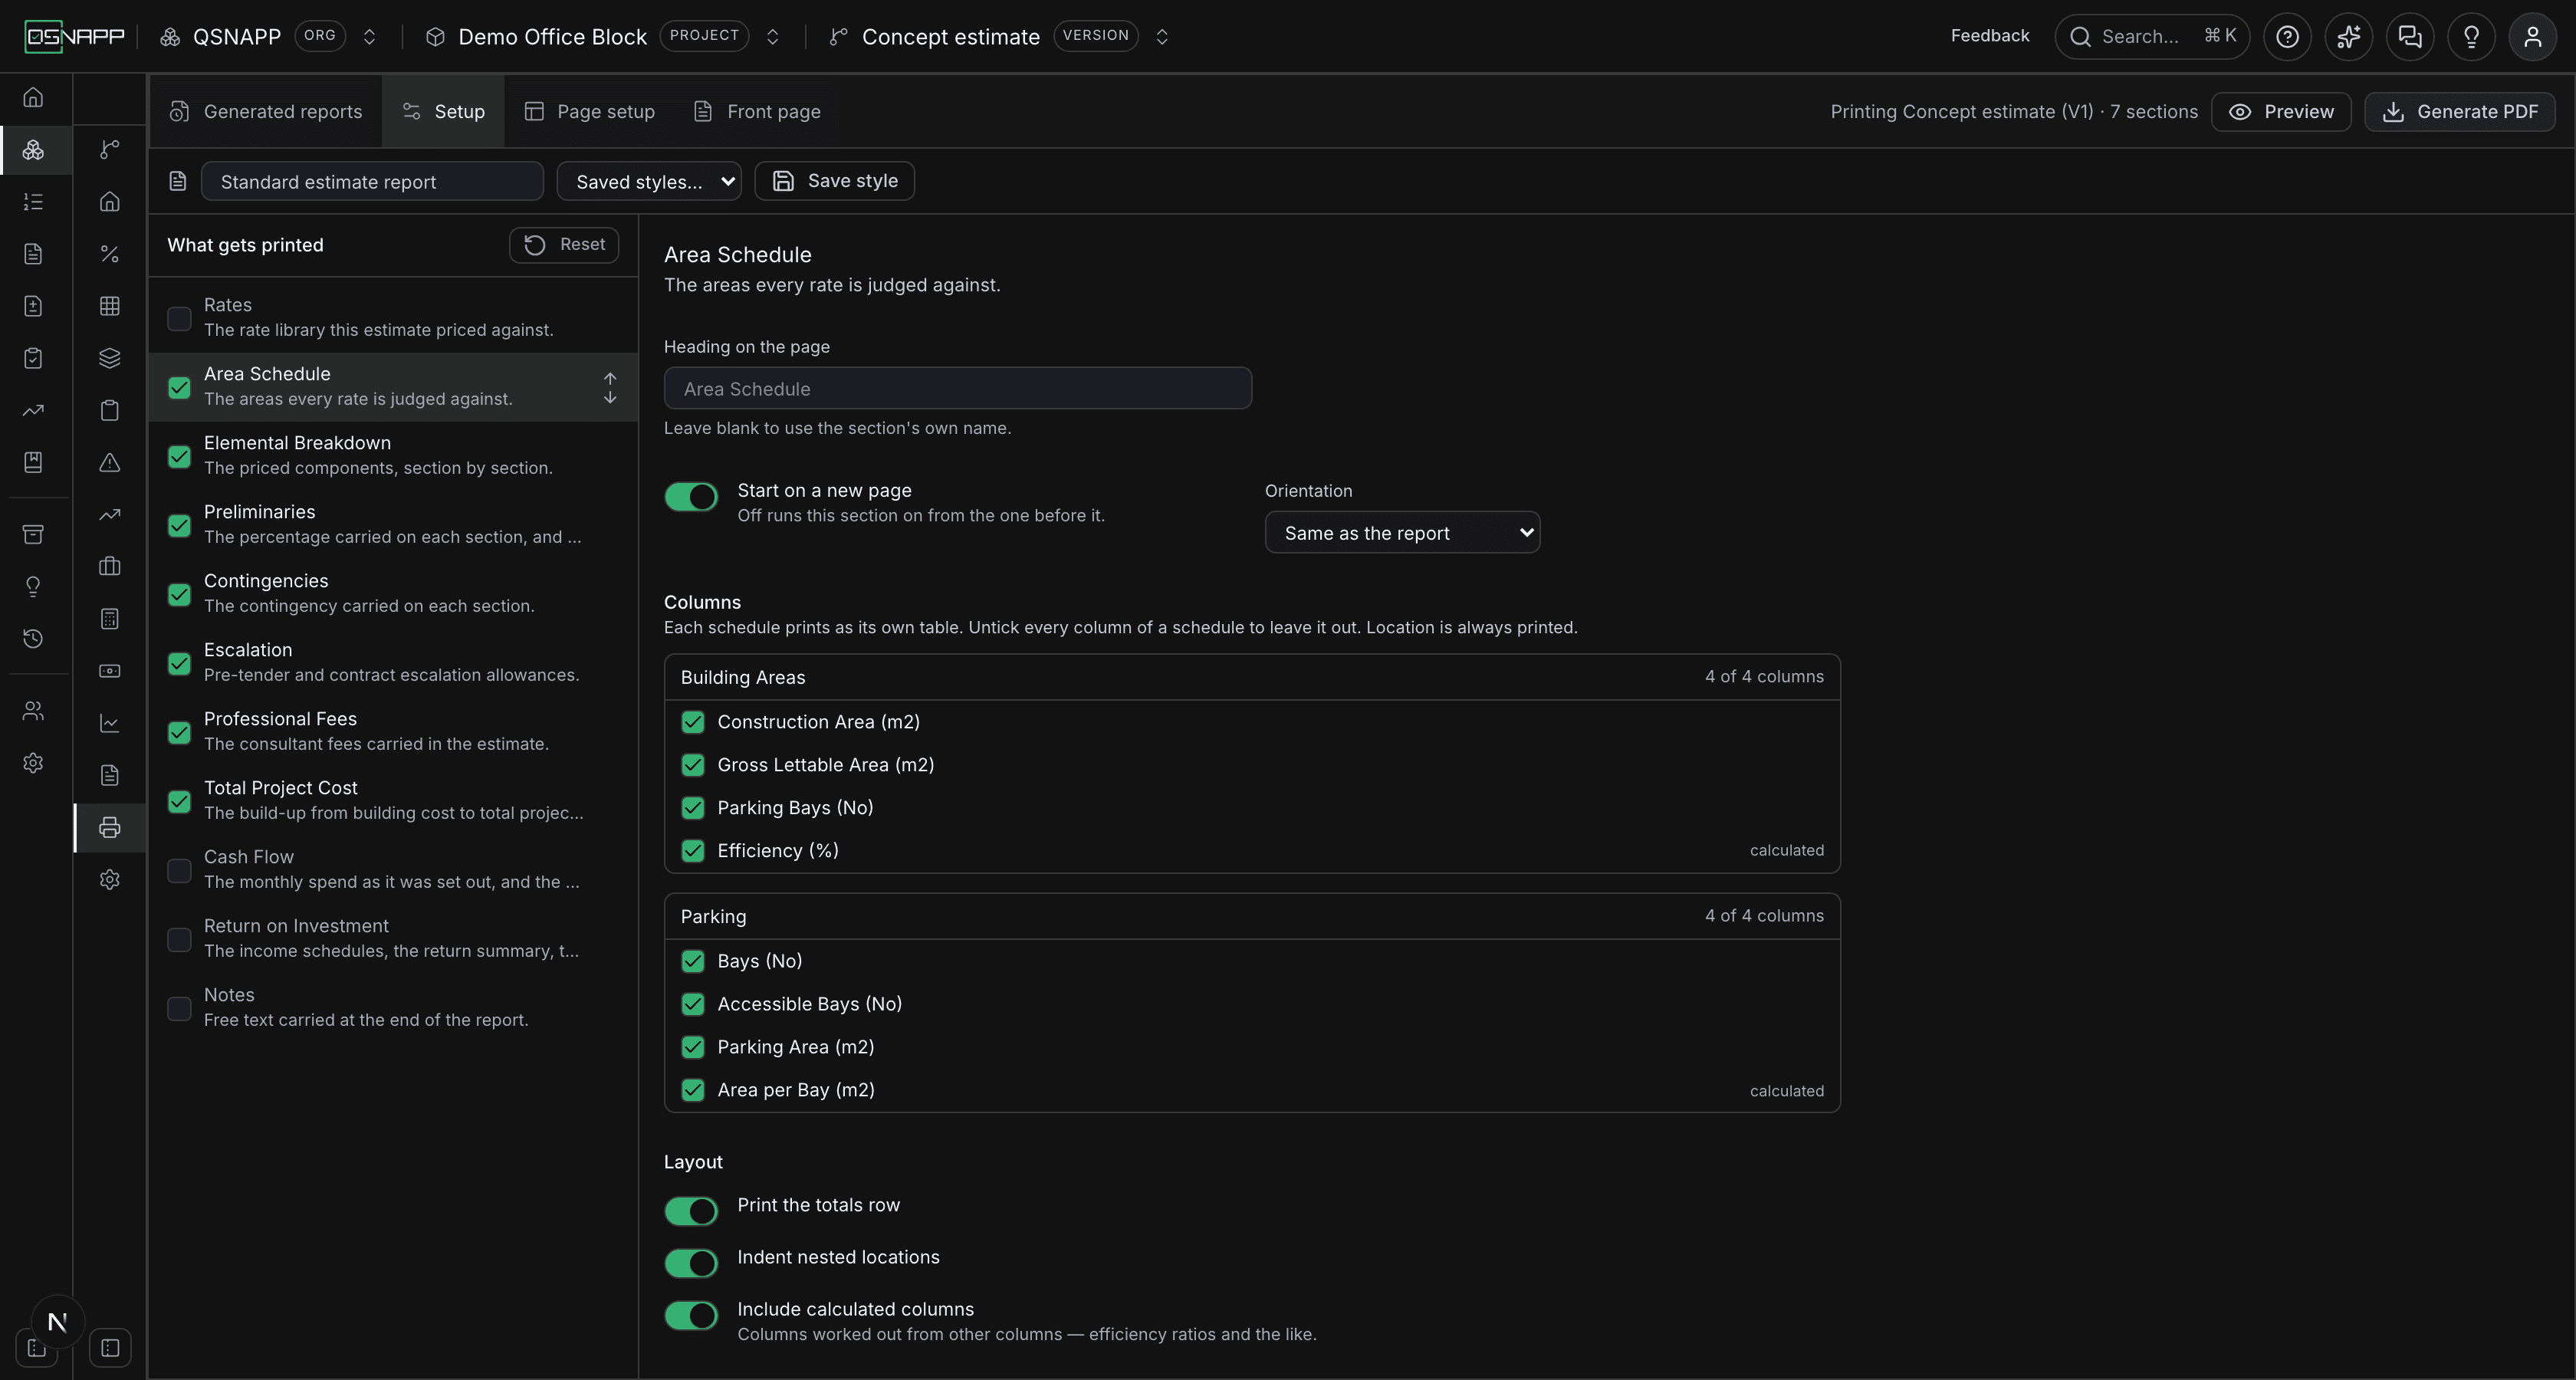
The Area Schedule and the Return on Investmentare different: their columns are the ones you made on those tabs, read from the version, so the picker lists them grouped by the schedule they belong to. Each group's header says how many of its columns are on — 3 of 4 columns — or not printed when none are. A column worked out from a formula is tagged calculated. There are no arrows: the columns print in the order the schedule has them.
- The Location column of an area schedule, and the Description of an income schedule, are always printed and are not in the list.
- Untick every column of a schedule and that schedule is left out of the report. Choosing columns is also the way to choose which schedules print.
- Until you tick or untick anything, the stored choice is “every column the schedule has”, so a schedule that gains a column later prints it without the setup being touched. The moment you untick one, the choice becomes the list as it stands.
- A version with no schedules yet says This version has no area schedule yet or This version has no income schedule yet in place of the list.
Section by section
What each section offers under Layout, with what it starts as and what it does on the page. The Places picker that several of them end with is the same on all of them, and has a section of its own below.
Rates
| Setting | To start with | What it does |
|---|---|---|
| Active rate sheet only | On | Prints the sheet the project is priced from and nothing else. Off prints every sheet the project holds, one after the other, each under its own name. |
| Print section and element headings | On | Groups the rates under their section and element as headings, indented beneath. Off lists them flat, with the section and element in their own columns on every row — which is why those two columns exist. |
Area Schedule
| Setting | To start with | What it does |
|---|---|---|
| Print the totals row | On | Adds the Total row at the foot of each schedule's table. |
| Indent nested locations | On | Steps a place in under the place it belongs to, so a floor sits under its building. Off prints every place flush left. |
| Include calculated columns | On | Prints the columns worked out from other columns — efficiency ratios and the like. Off leaves them off the page. They are still worked out, so nothing else on the page changes. |
Elemental Breakdown
| Setting | To start with | What it does |
|---|---|---|
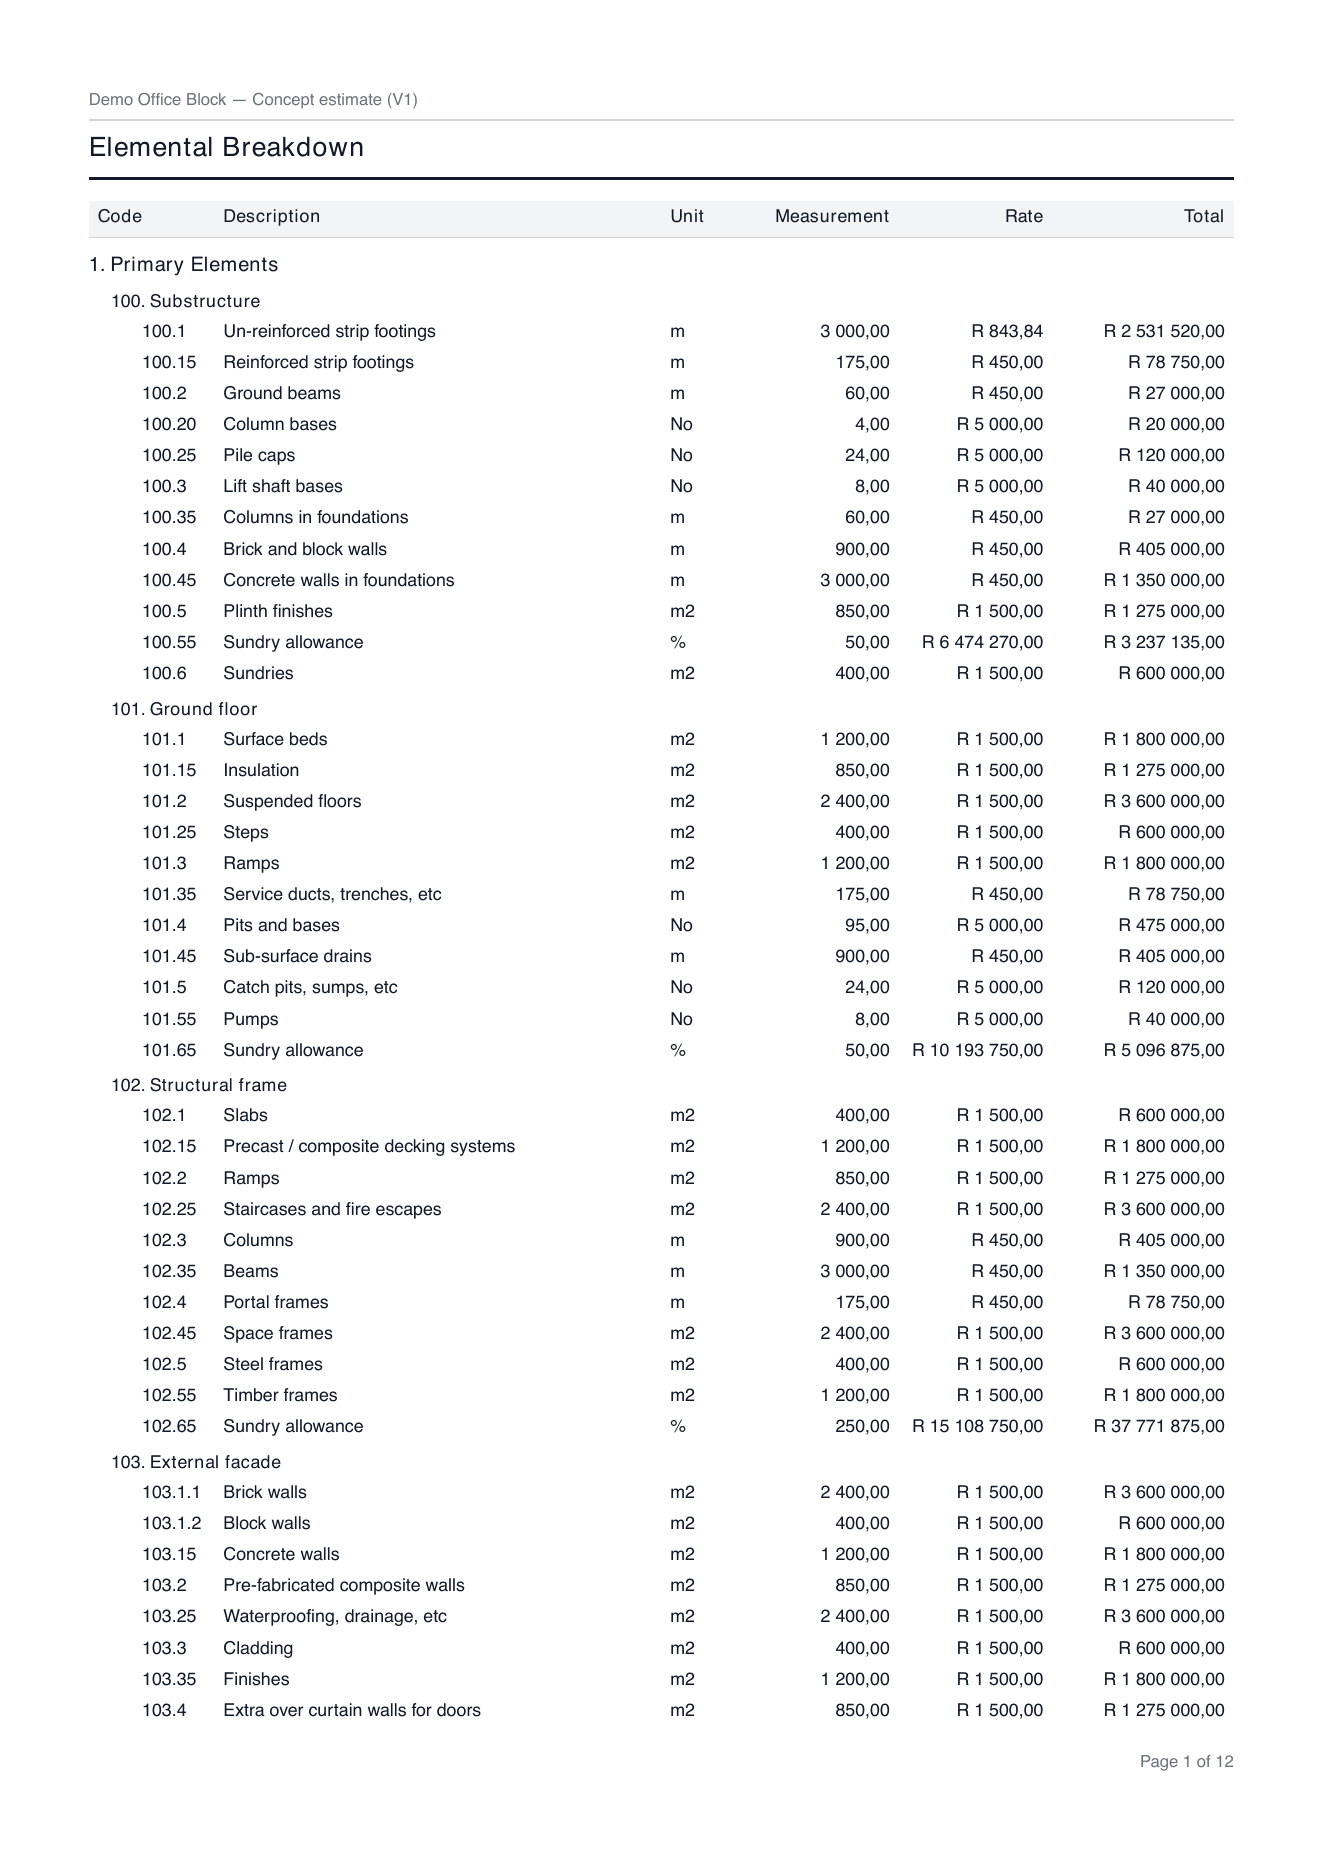
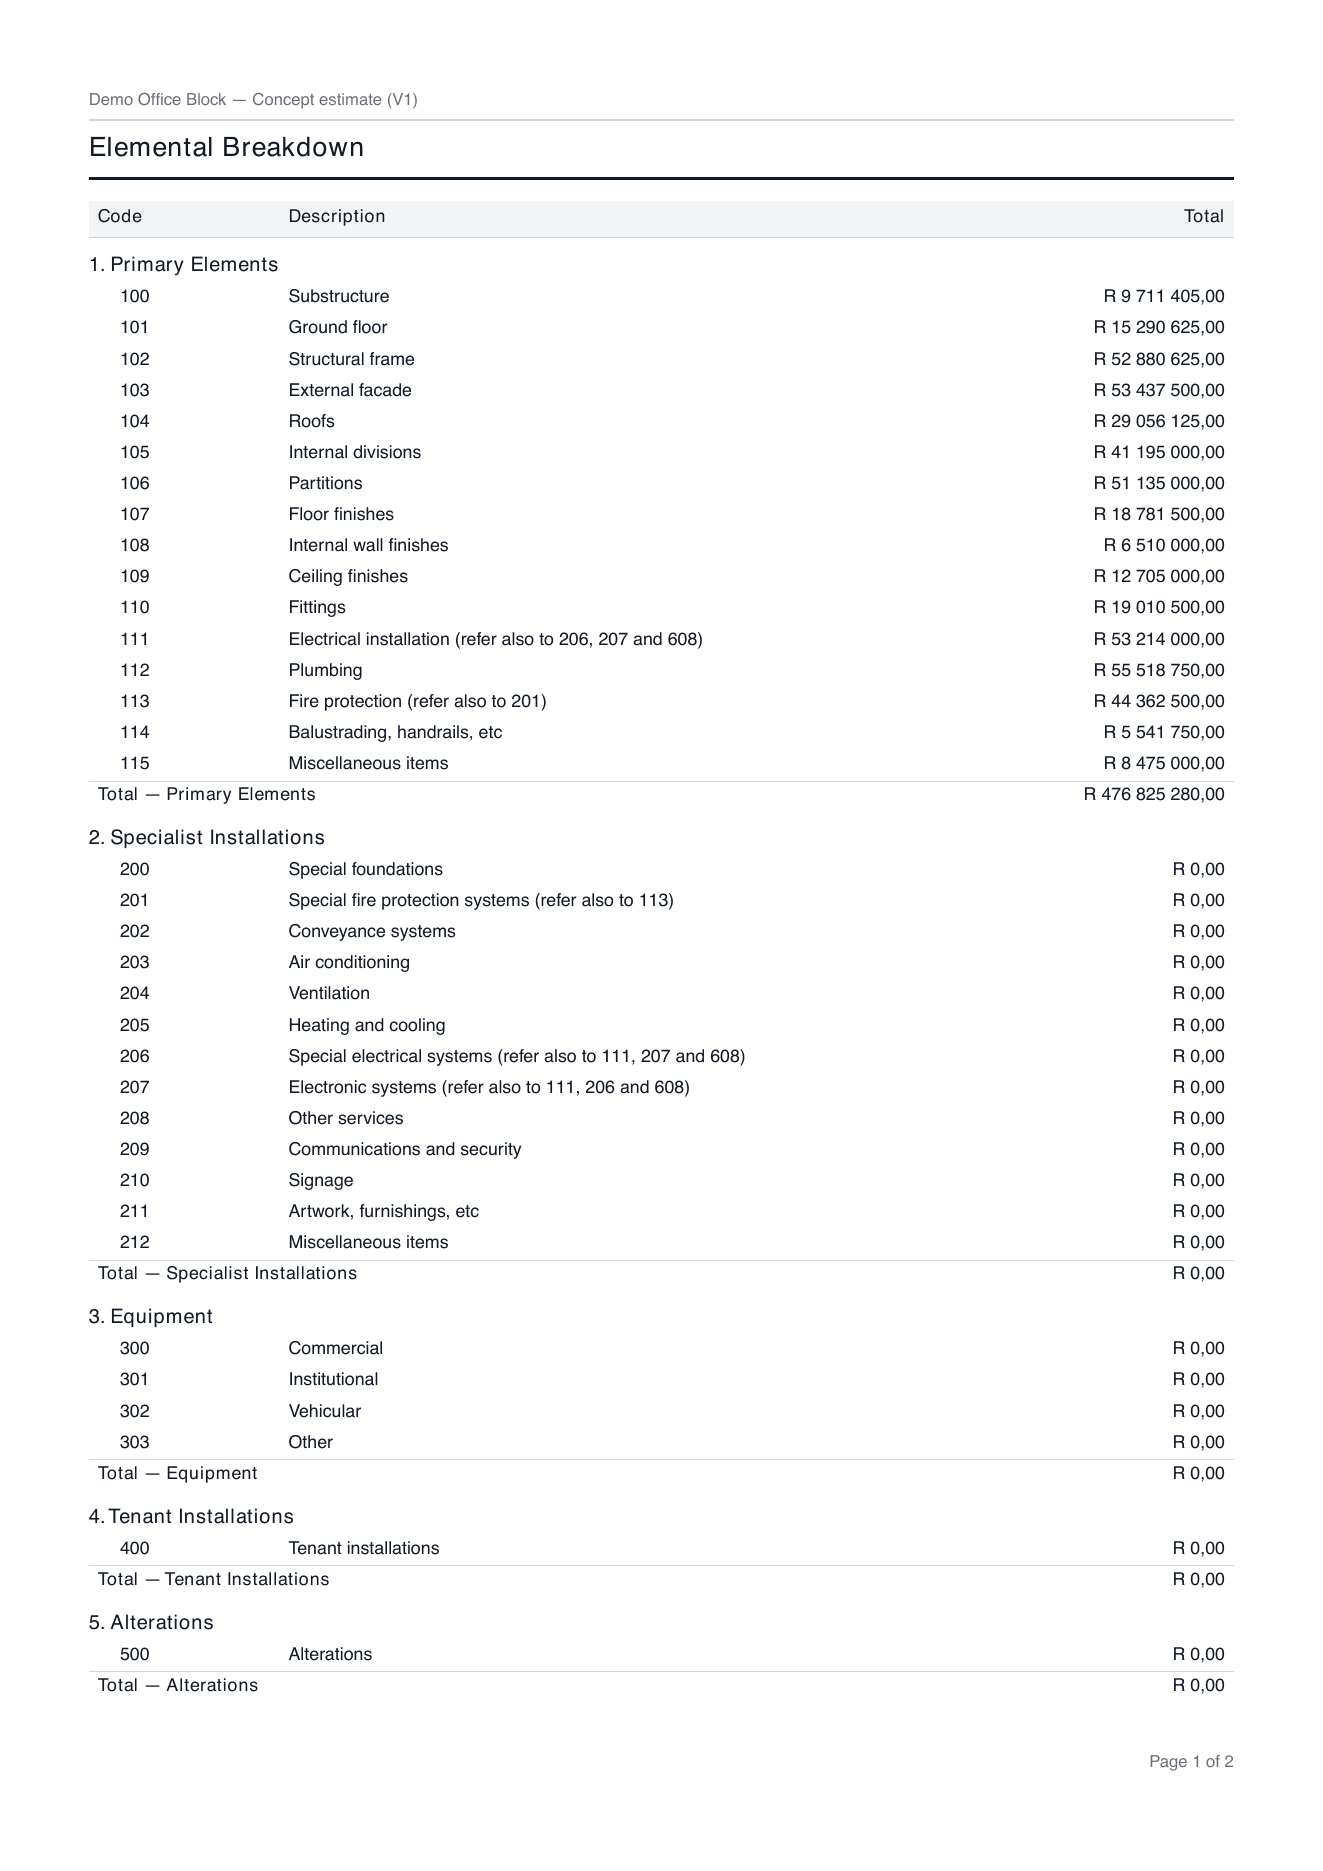
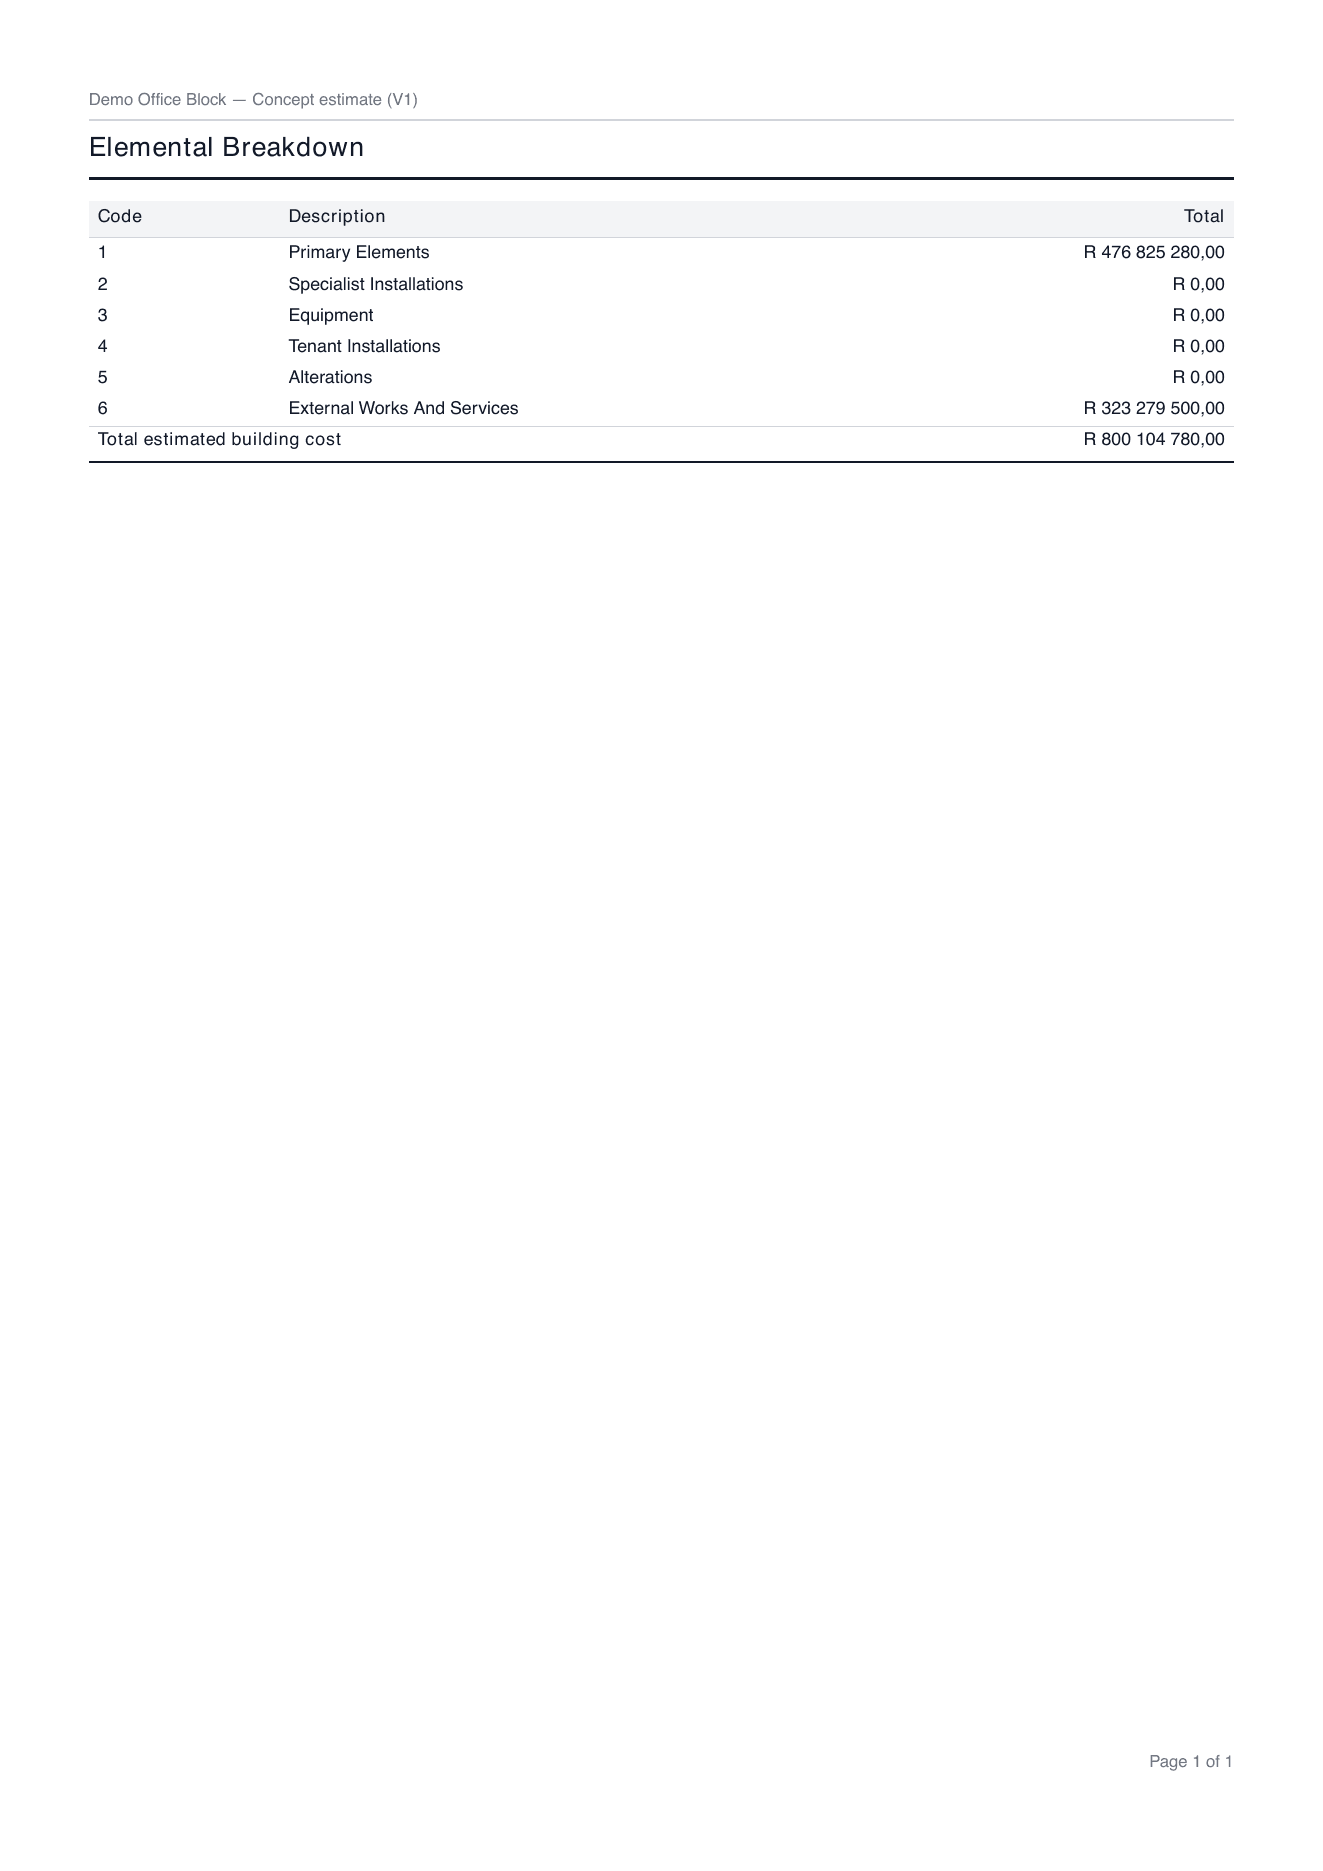
| Level of detail | Every component | How deep the breakdown goes. Every component prints each priced component. Element totals prints one line per element (100. Substructure, 101. Ground floor), each element's components added up. Section totals prints one line per section (1. Primary Elements). The figures are the same; only the depth changes. |
| Print section headings | On | A heading line for each section — 1. Primary Elements — above its elements. |
| Print element headings | On | A heading line for each element — 100. Substructure — above its components. Only read at the component level; a rolled-up level is its own headings. |
| Subtotal each section | On | A subtotal line after each section's last row. |
| Leave out components with no measurement | Off | Drops components measured at zero with no total, which are usually noise on an issued print. At element level it drops elements totalling nothing. Off prints them, with blank cells. |
| Print each component's build-up | Off | Puts a small table under every component that has one: its composition lines as item, unit, quantity, rate and amount, with a Built-up rate line — the same lines the grid shows when a row is expanded. |
| Print the constants a component uses | Off | Puts a table of the named figures the build-up is priced off under the component: code, description, formula and value. Independent of the build-up switch. |
| Places | Combined | A cost column per place you pick, beside the total. See Printing by place. |
A rolled-up line has no unit, measurement or rate — a sum of square metres and cubic metres has no unit — so at element or section level only code, description and total print however the columns are ticked, and the build-up and constants switches are not read. The three levels, printed from the same estimate:
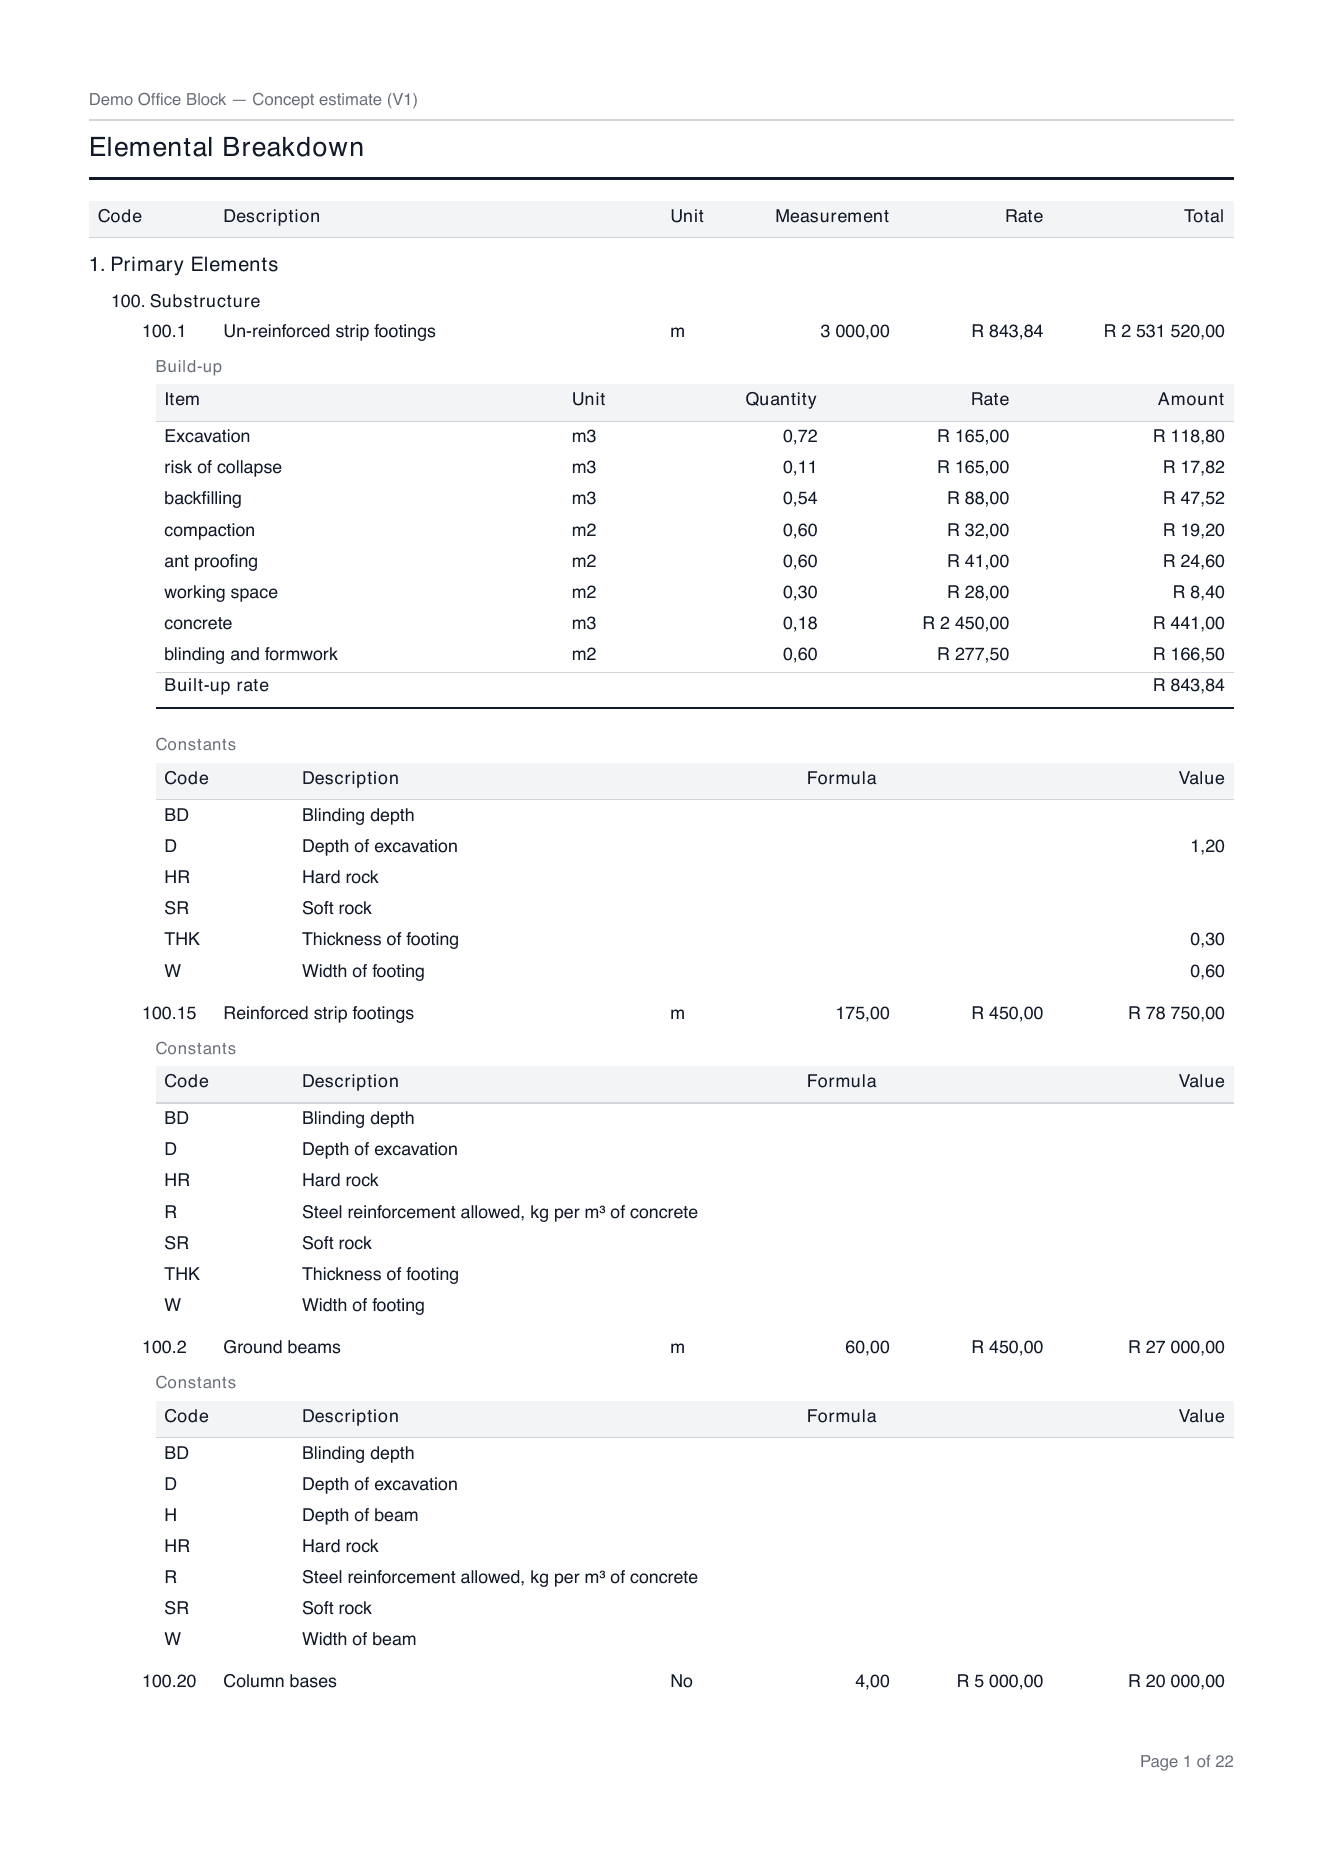
Preliminaries
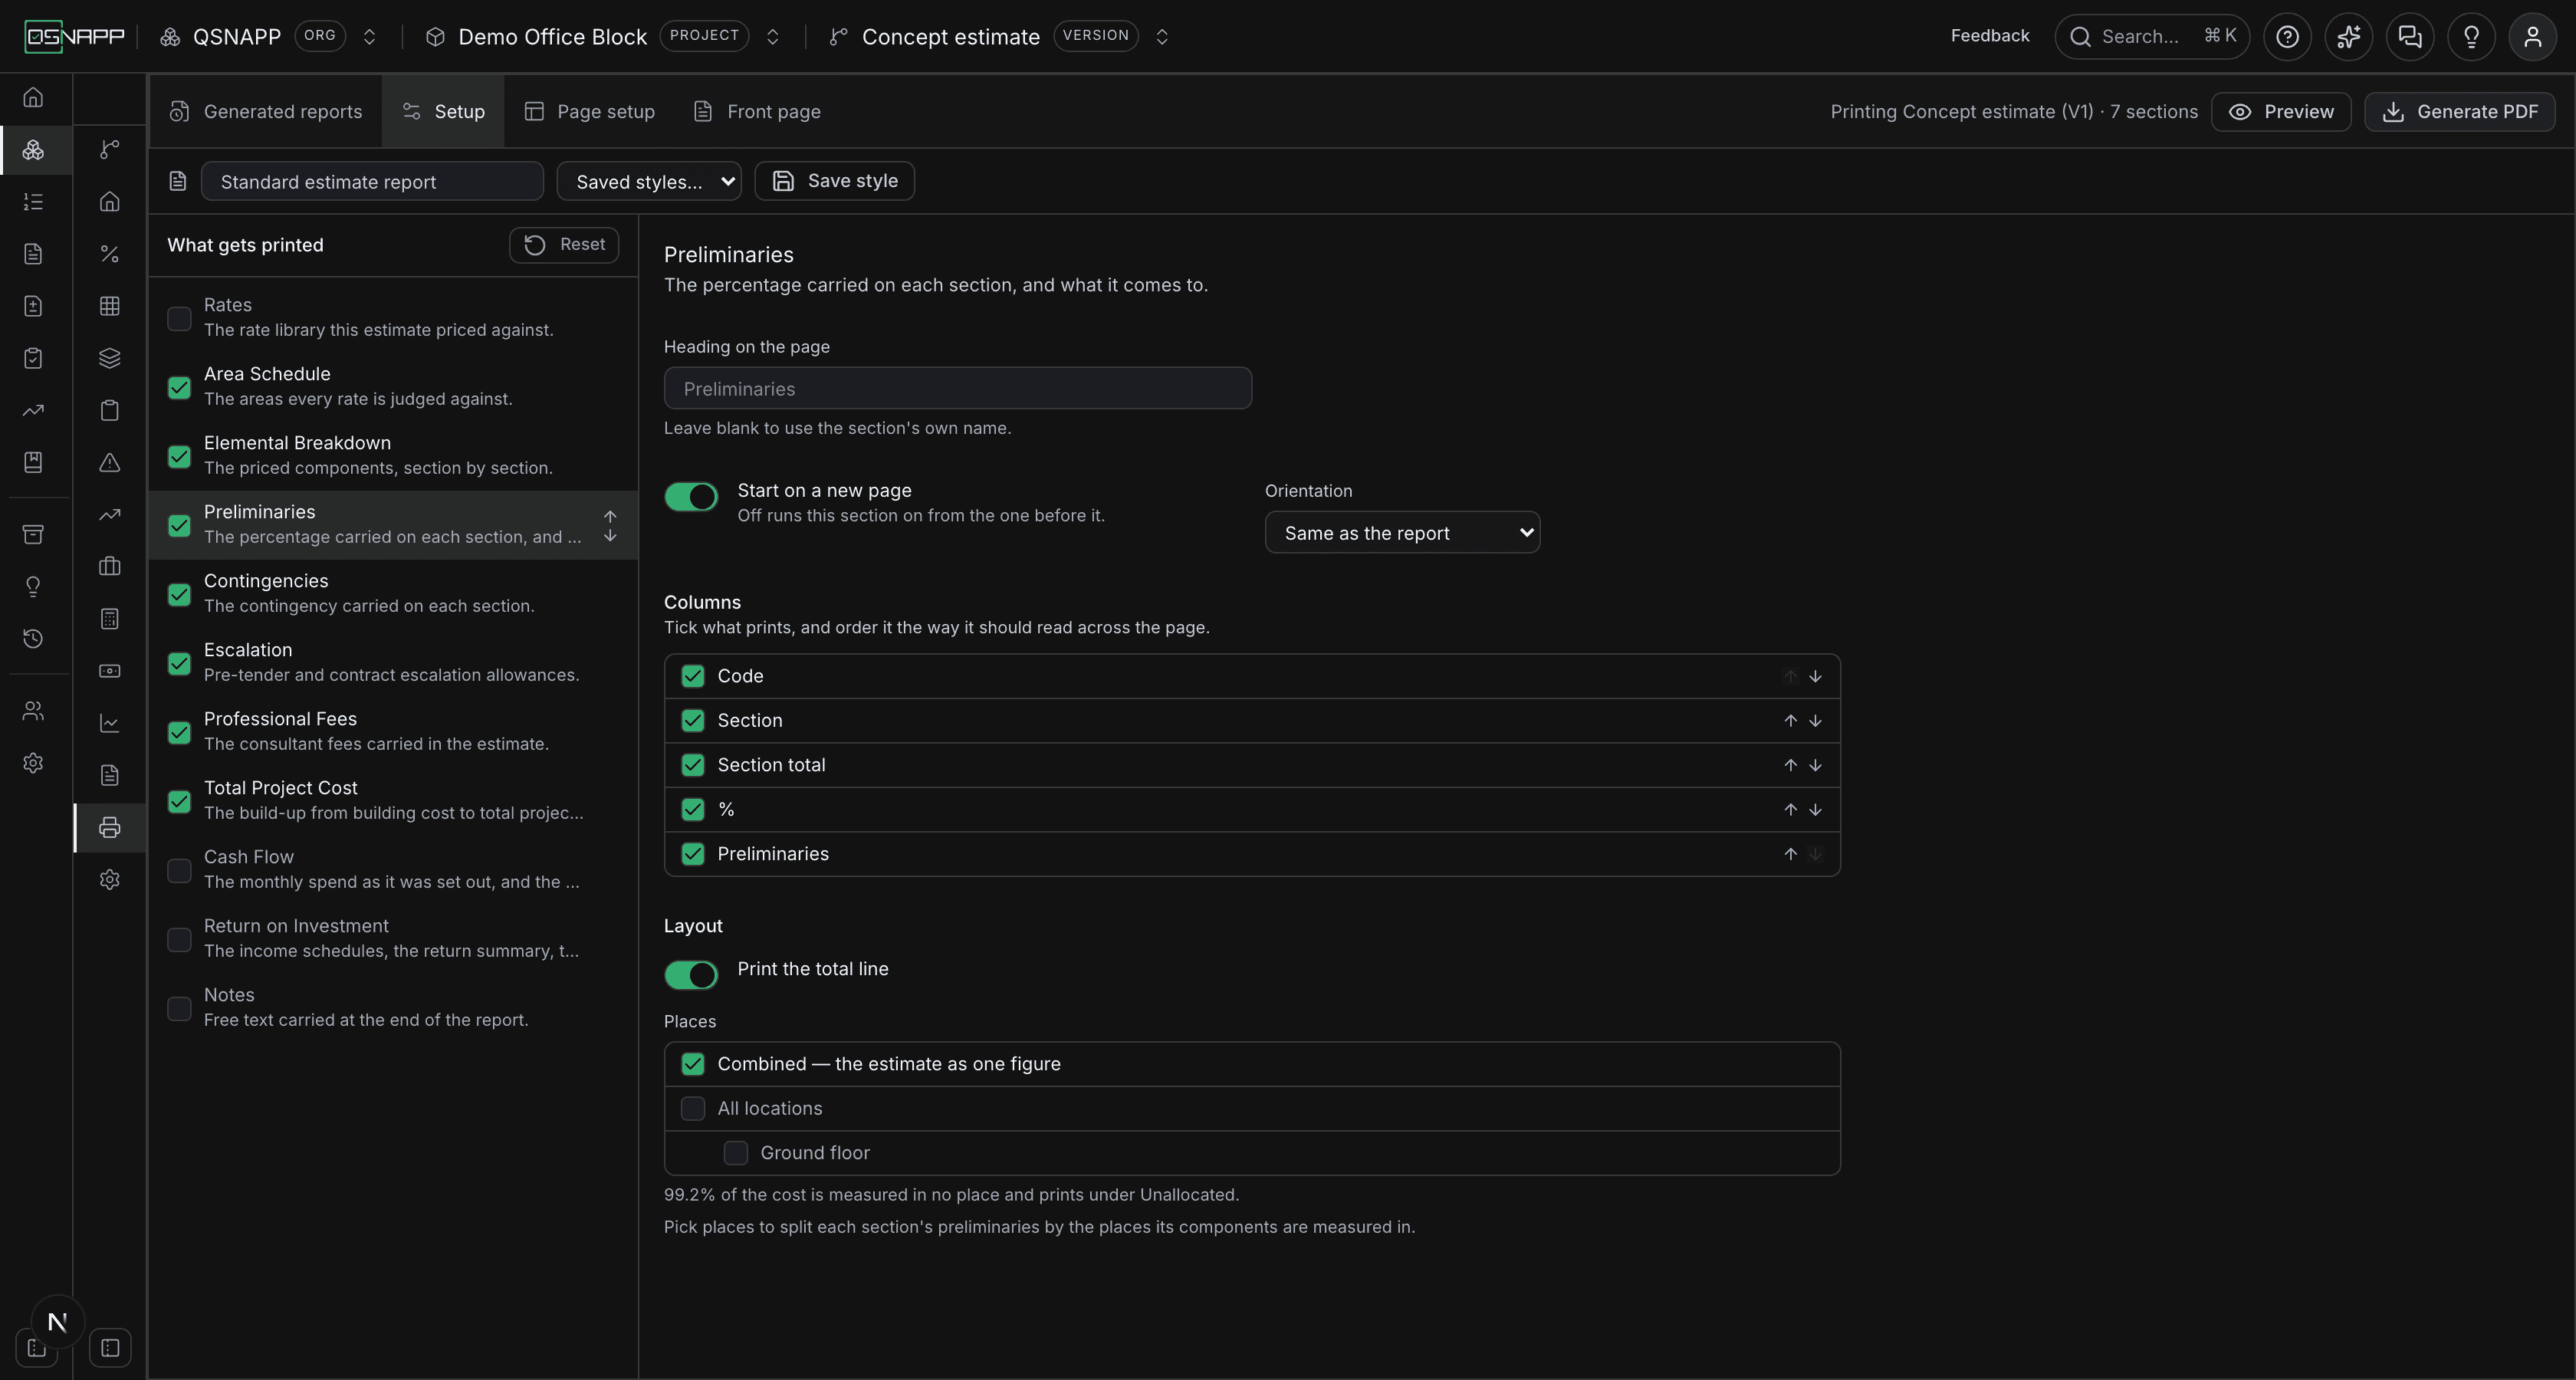
| Setting | To start with | What it does |
|---|---|---|
| Print the total line | On | Adds Total preliminaries at the foot. Off prints the rows alone. |
| Places | Combined | Splits each section's preliminaries by the places its components are measured in. See Printing by place. |
The percentage printed is the one saved on the Preliminariestab for each section, and the section total is the section's components added up. Each section's amount is rounded to the cent before the total is added, which is why the printed total can differ from the screen's by a cent or two.
Contingencies
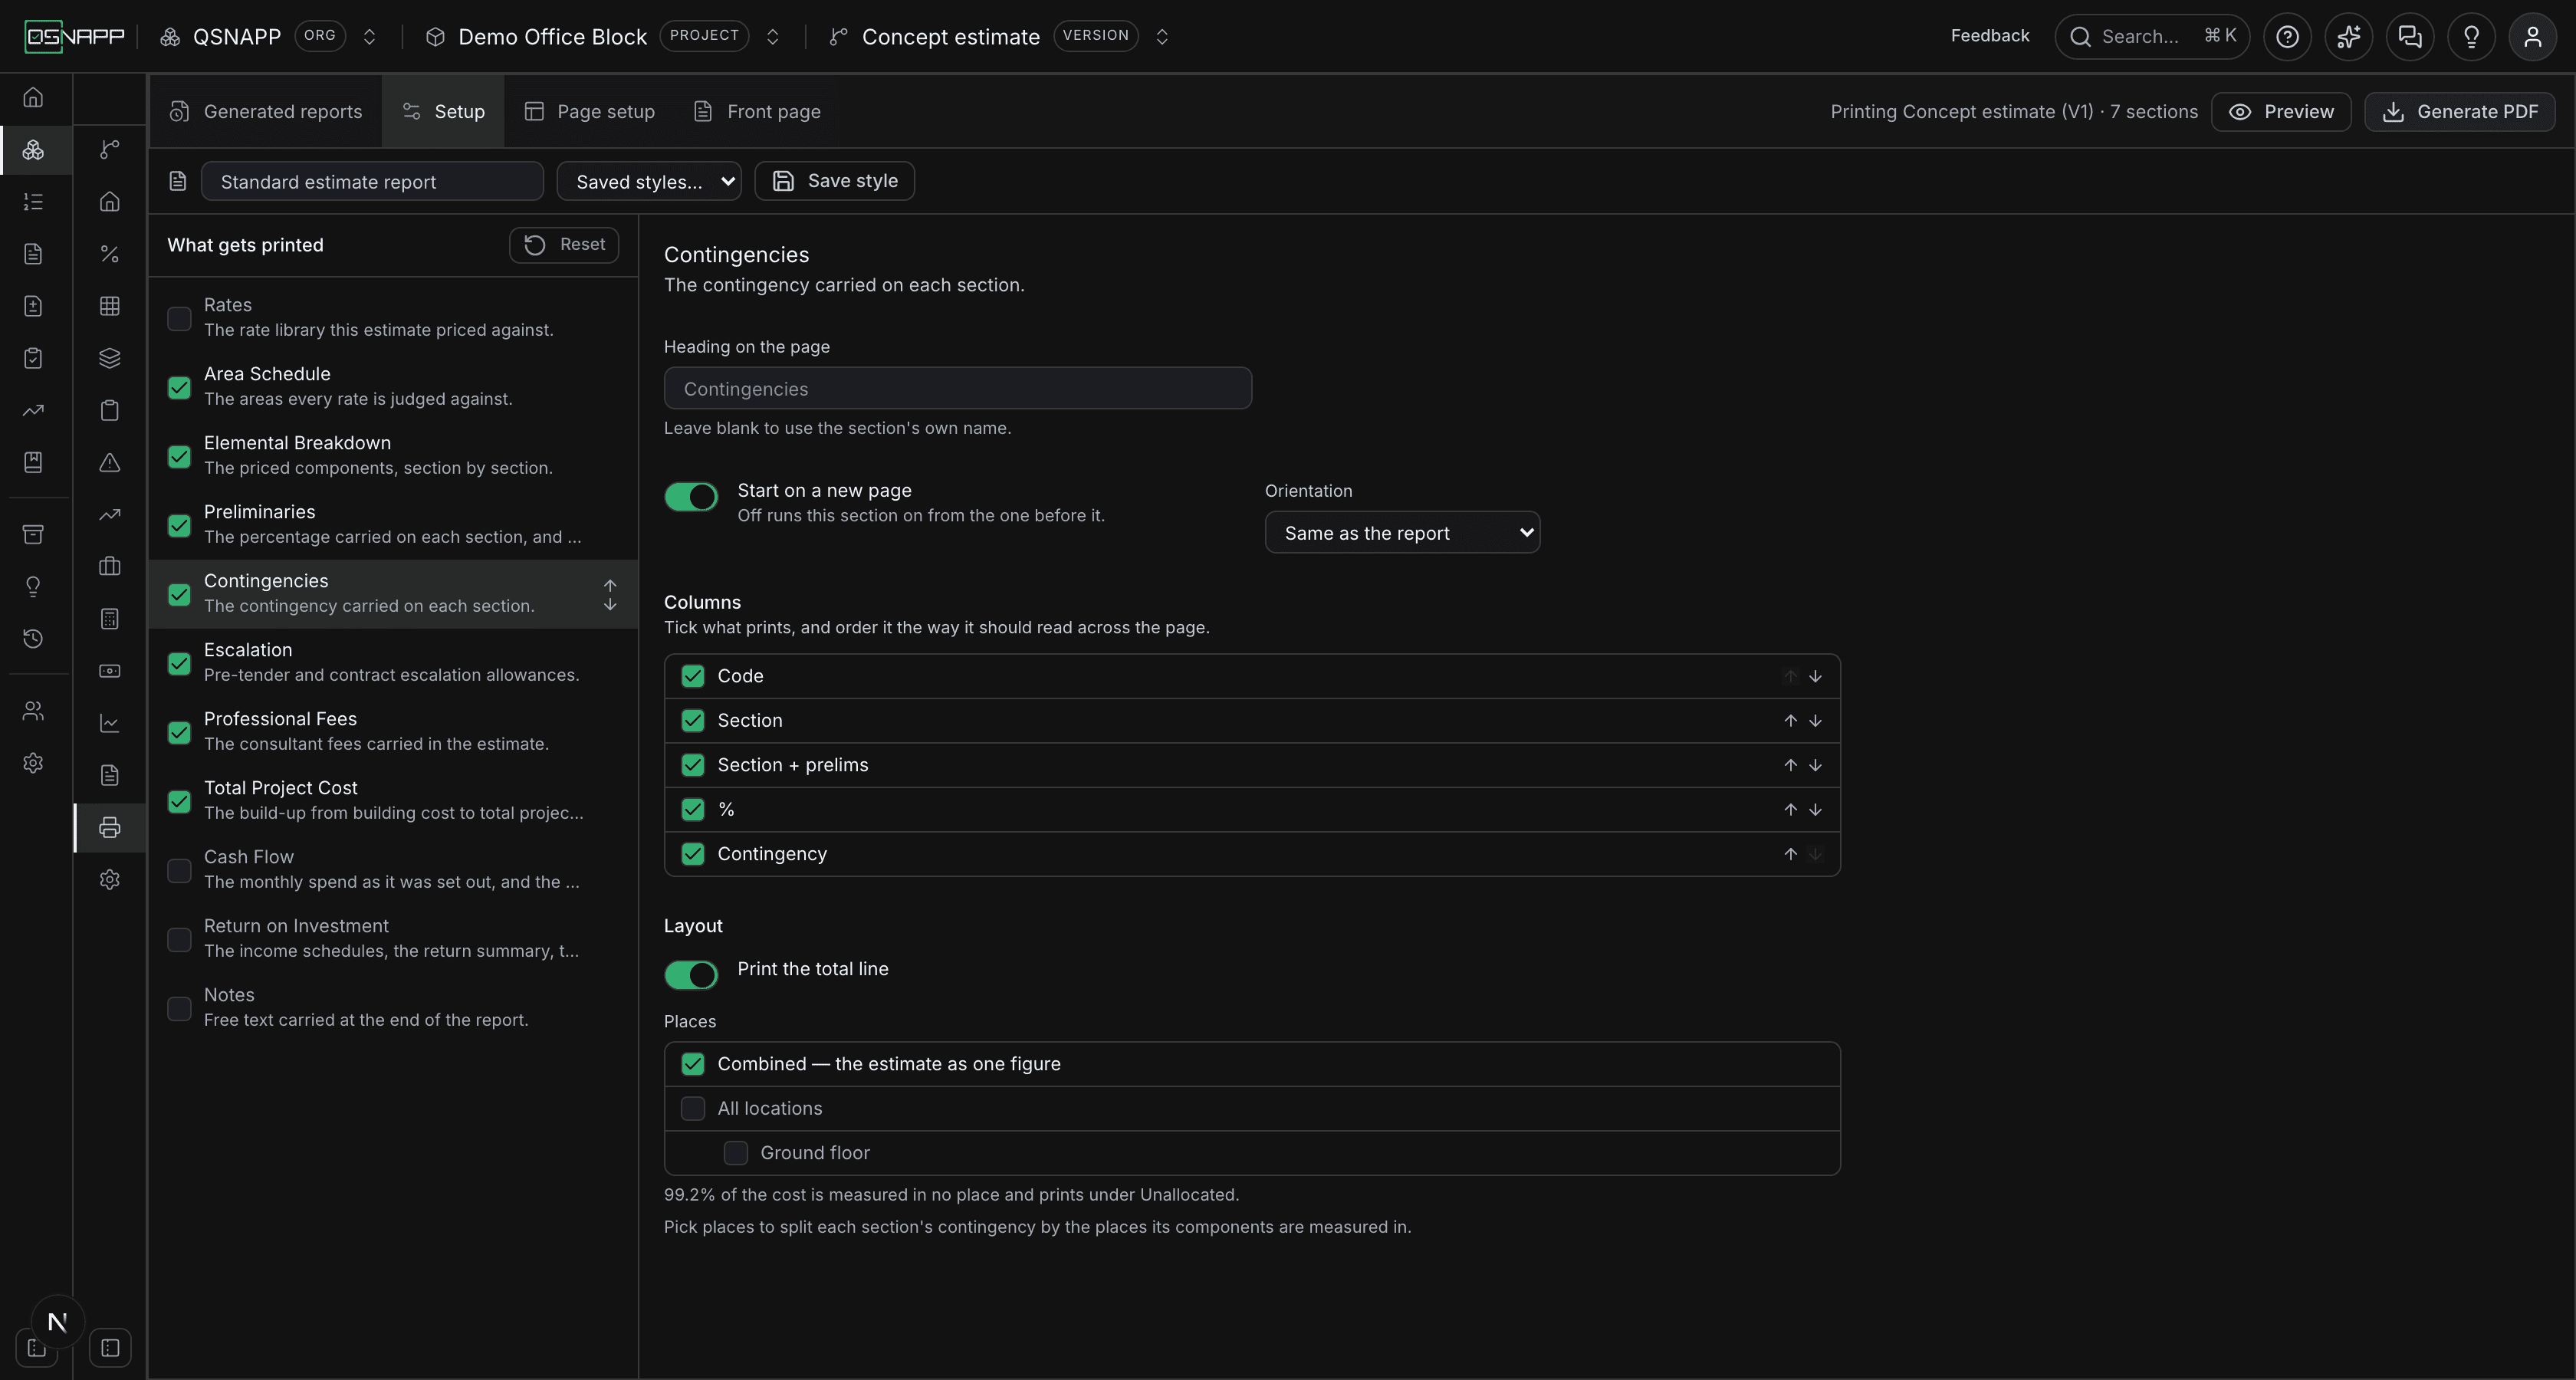
| Setting | To start with | What it does |
|---|---|---|
| Print the total line | On | Adds Total contingencies at the foot. |
| Places | Combined | Splits each section's contingency by the places its components are measured in. |
The base is Section + prelims: the section total with its preliminaries added, as the Contingencies tab takes it.
Escalation
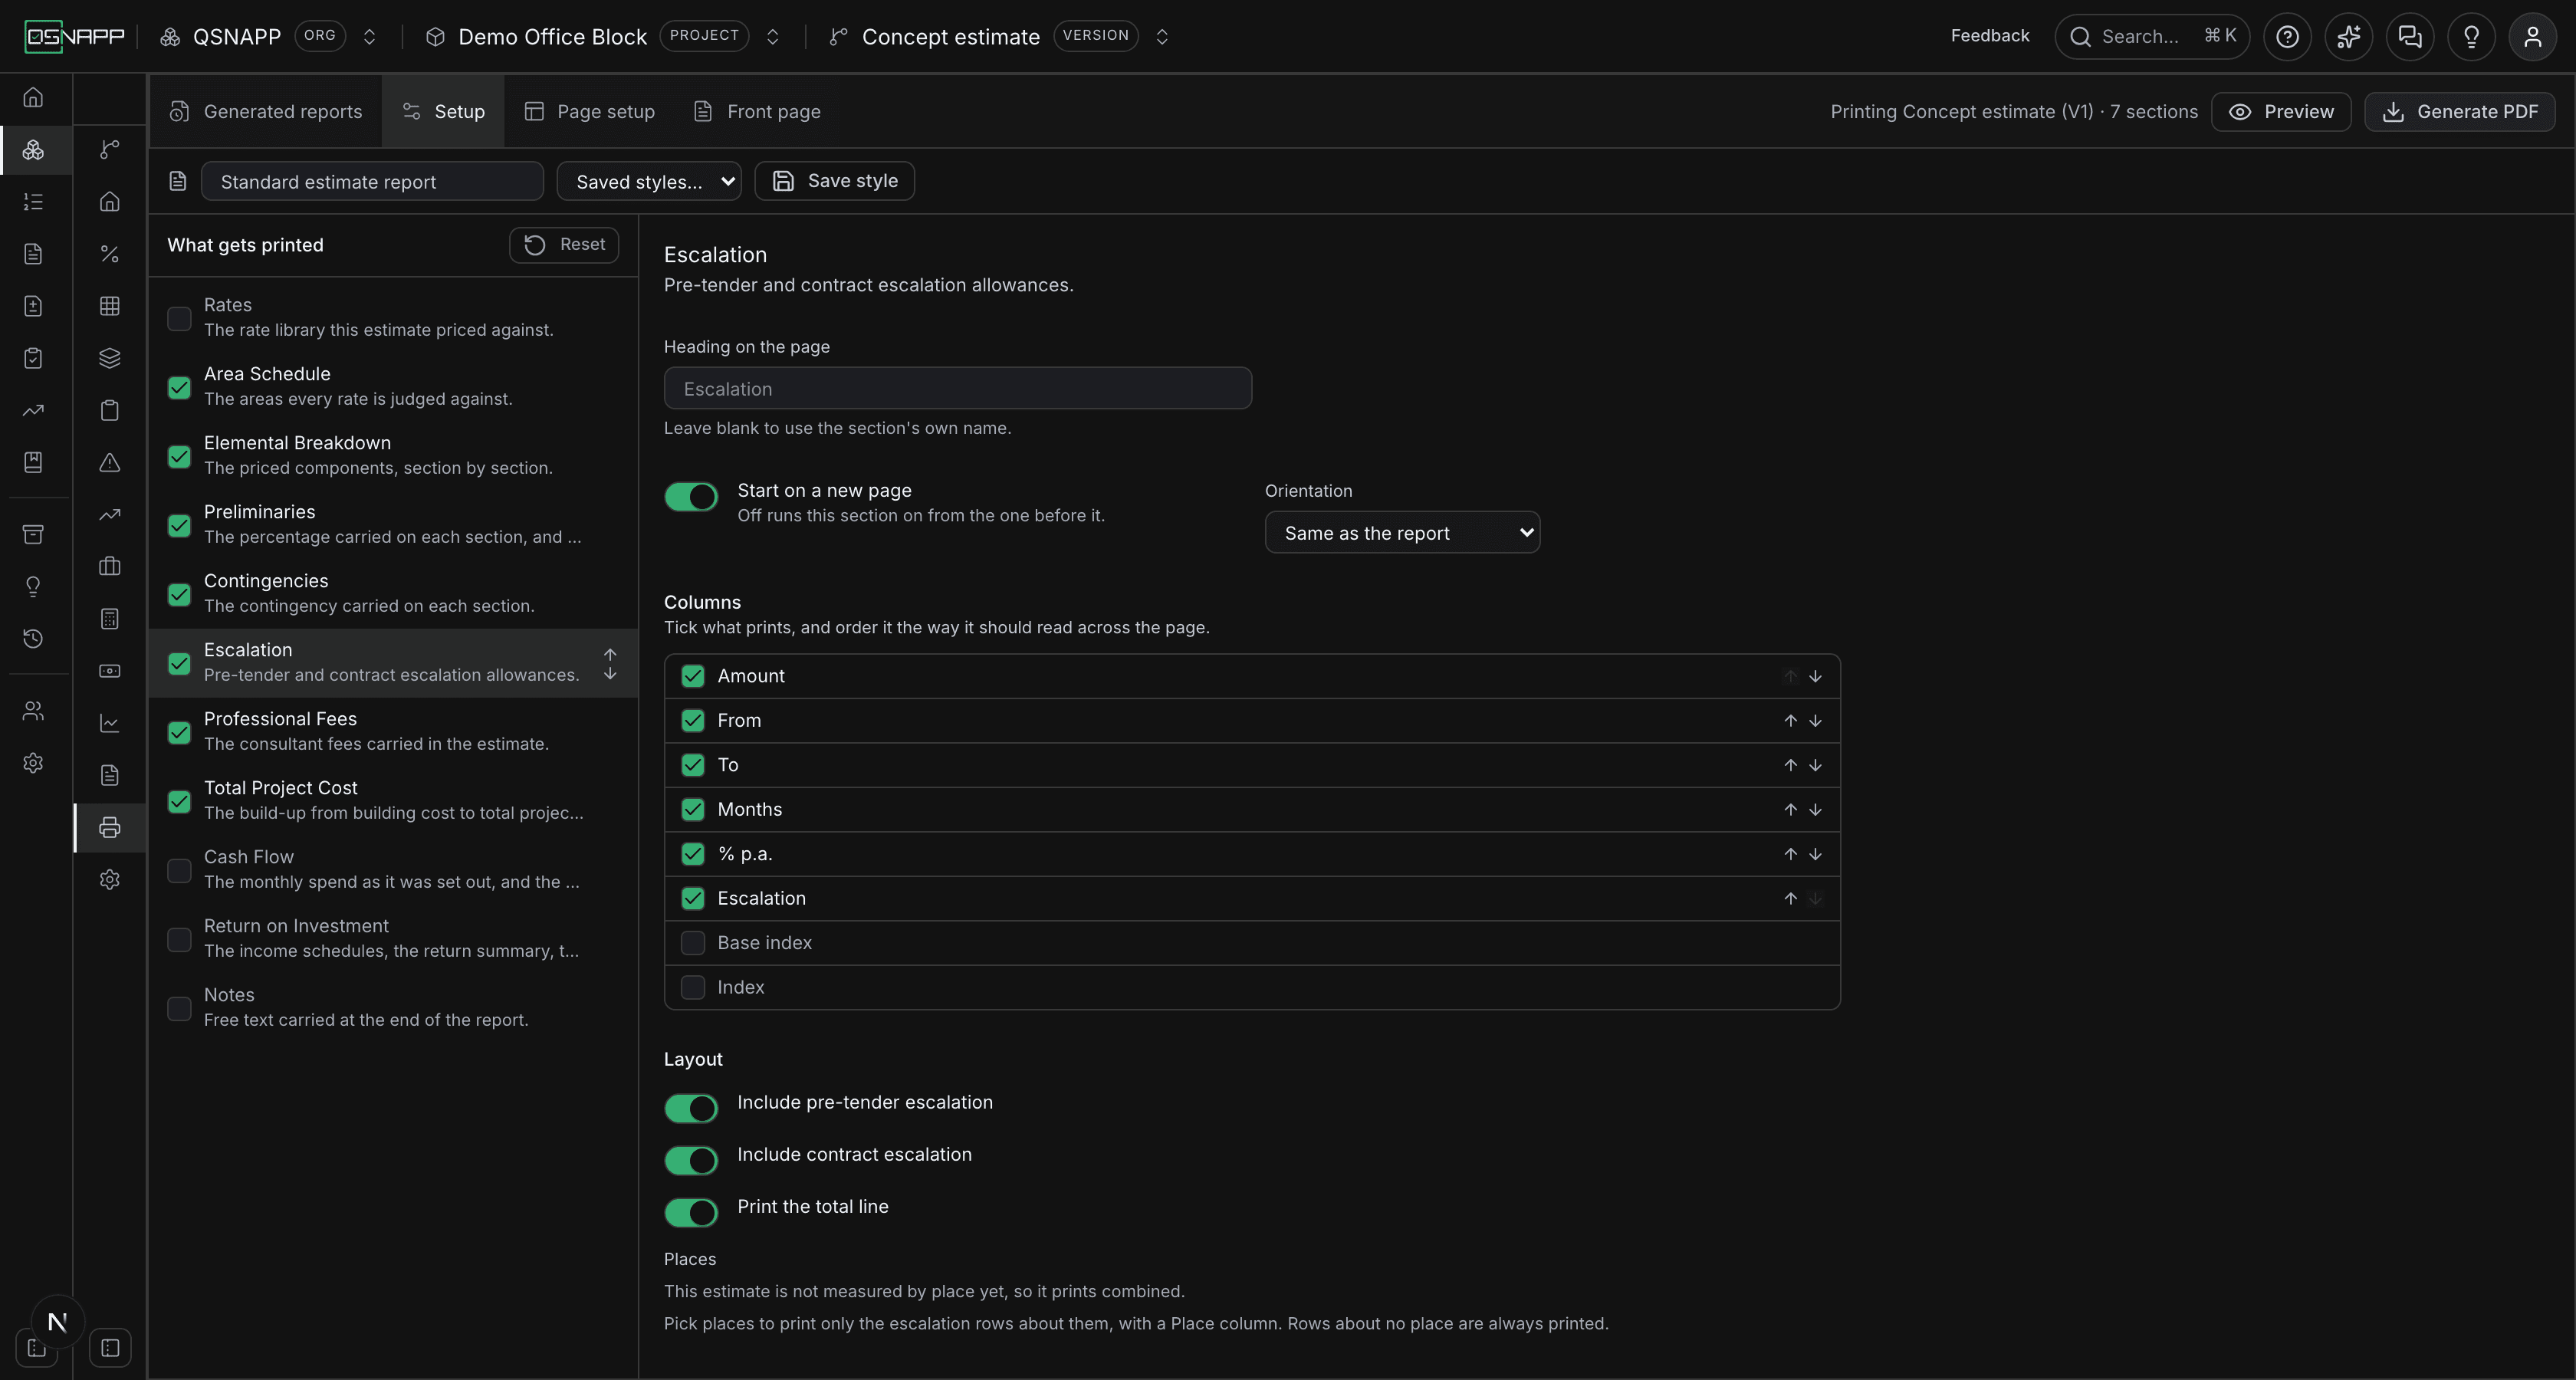
| Setting | To start with | What it does |
|---|---|---|
| Include pre-tender escalation | On | Prints the rows of the Pre-tender escalation table under their own heading. |
| Include contract escalation | On | Prints the rows of the Contract escalation table — the post-tender table on the tab — under their own heading. With both on, the two tables follow each other. |
| Print the total line | On | Adds Total escalation at the foot, the sum of whichever tables are on. |
| Places | Combined | Prints only the rows about the places you pick, with a Place column. Rows about no place are always printed. |
Every row is worked out with the functions the Escalation tab uses; the base index and index columns are there for a reader who wants to check the rate, and are off because most readers do not.
Professional Fees
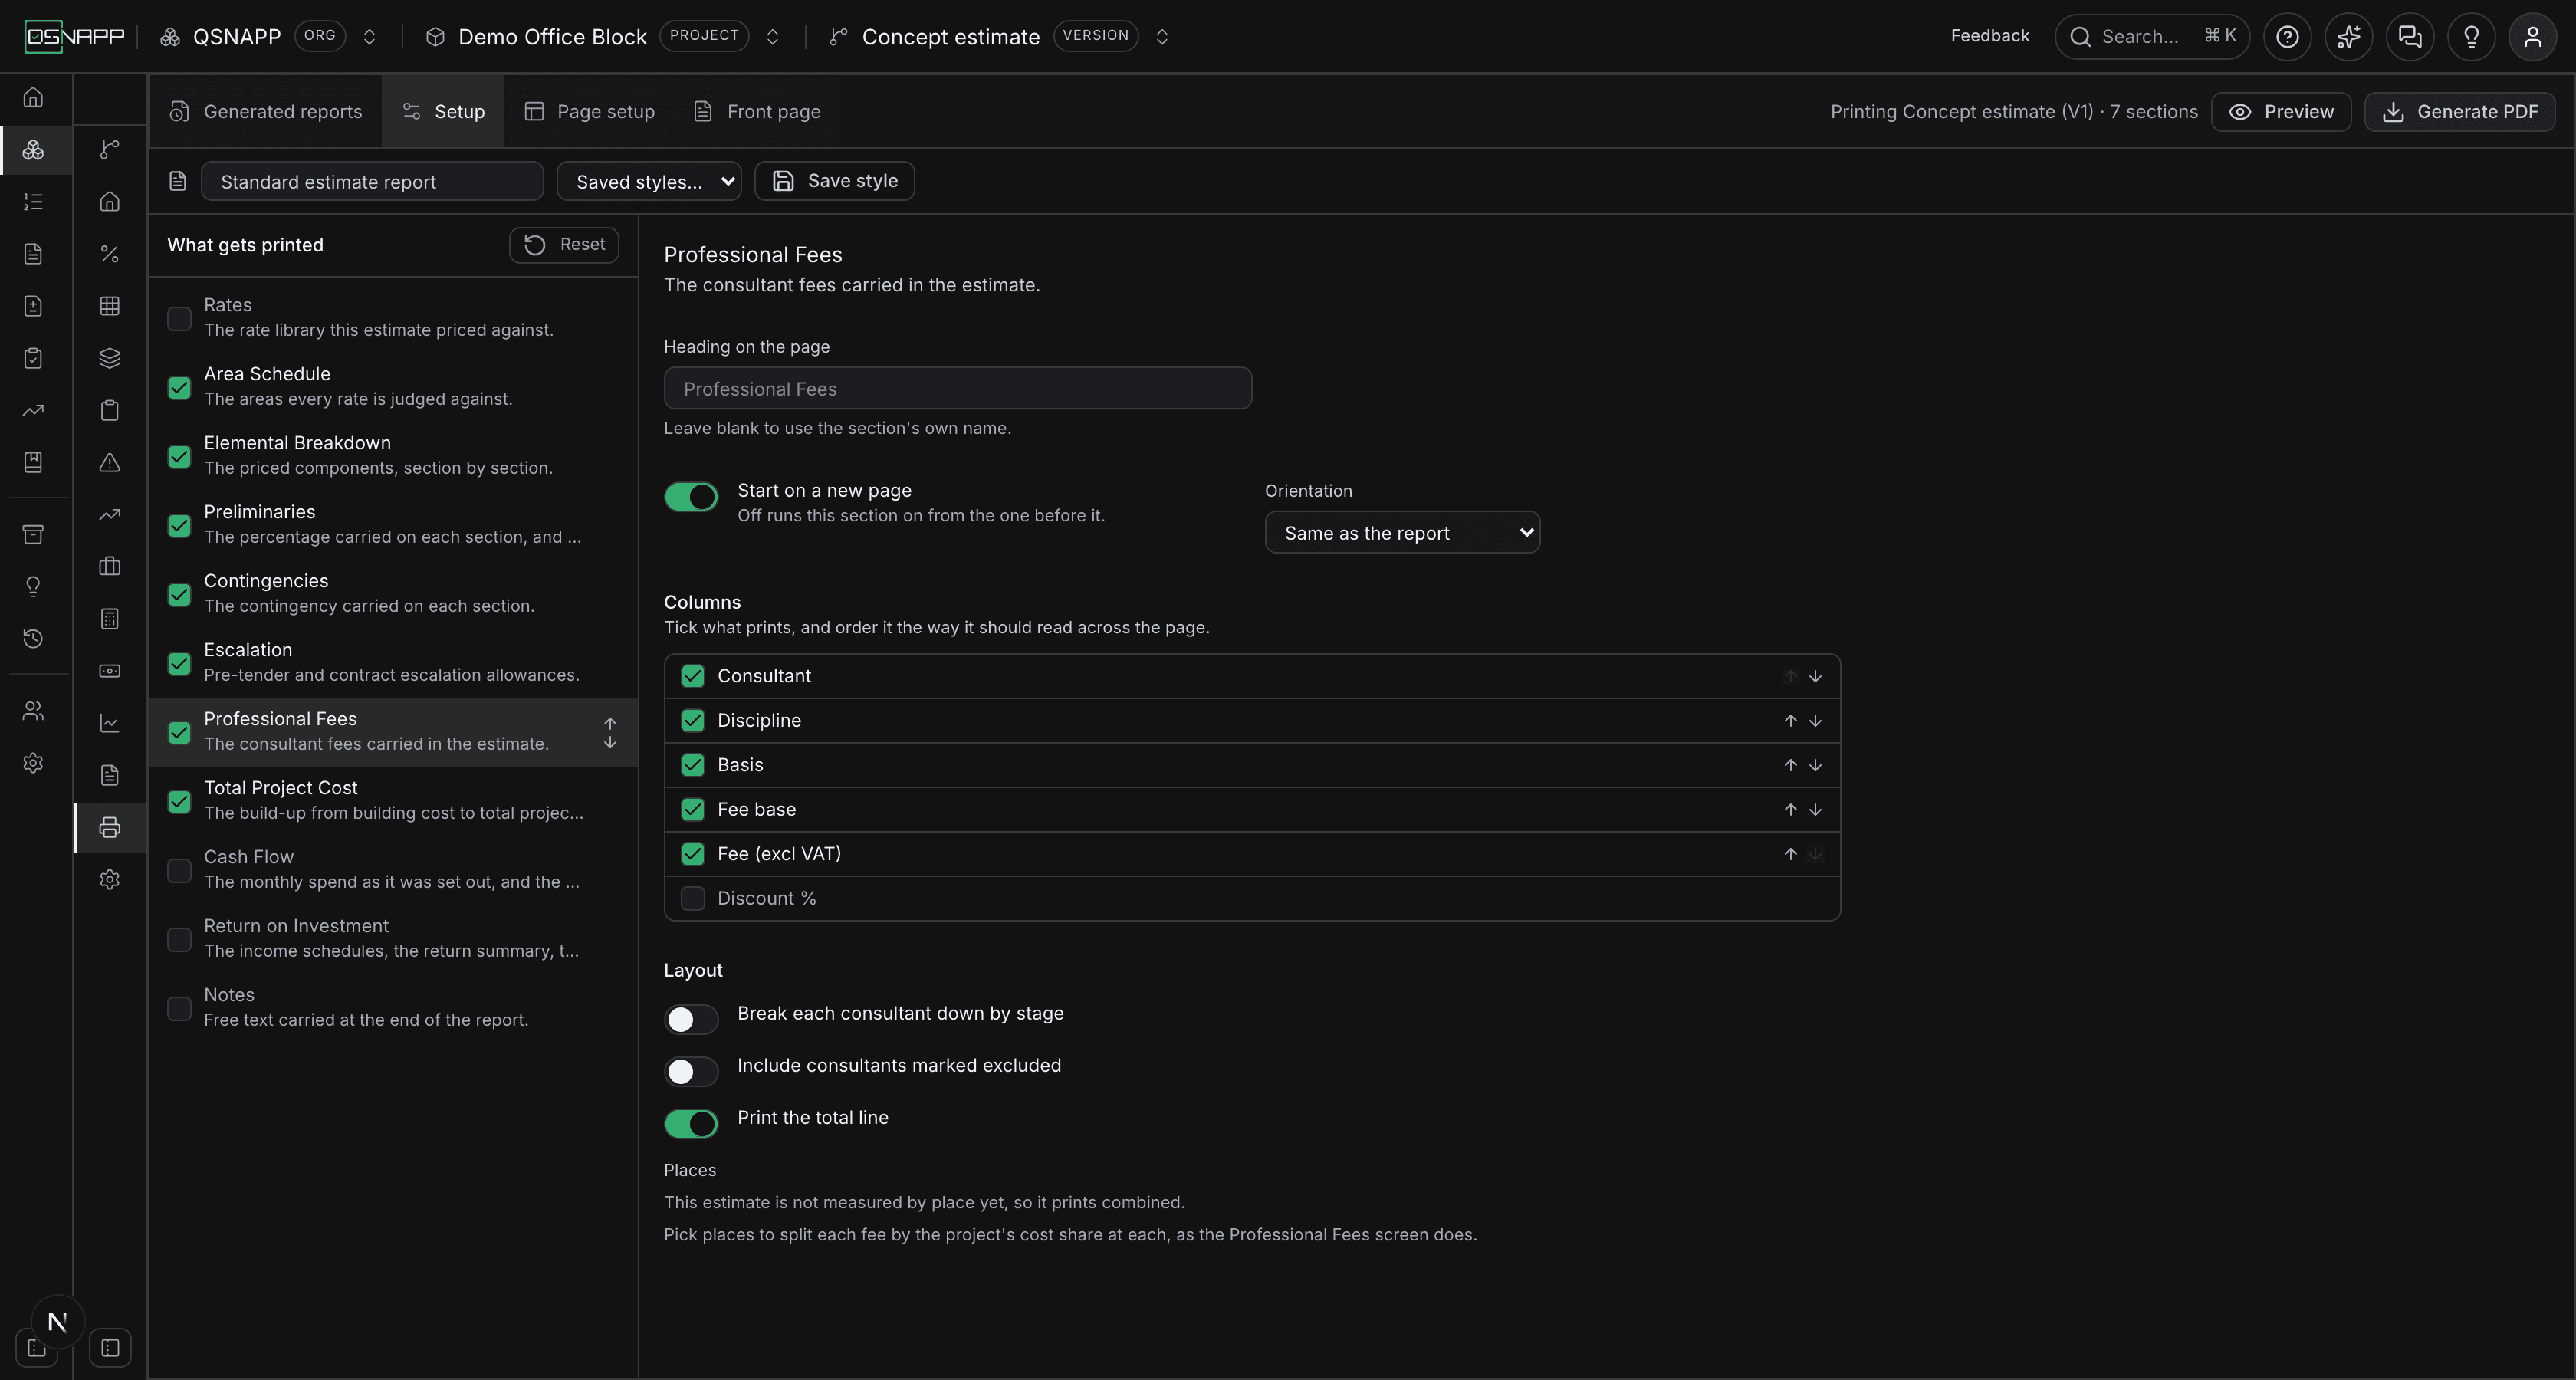
| Setting | To start with | What it does |
|---|---|---|
| Break each consultant down by stage | Off | Prints the work stages under each consultant, each with its percentage of the fee and the amount it comes to. Only consultants given stages on the tab gain the extra rows; the rest print their one line as before. Off prints one line per consultant. |
| Include consultants marked excluded | Off | Brings back the consultants whose status on the tab is N/A. The section otherwise leaves them out, and the total is the same either way — an excluded consultant has no fee. |
| Print the total line | On | Adds Total professional fees at the foot. |
| Places | Combined | Splits each fee by the project's cost share at each place, as the tab does. |
A consultant's fee is the one the Professional fees tab last saved; the Basis column reads Standard or ASAQS scale.
Total Project Cost
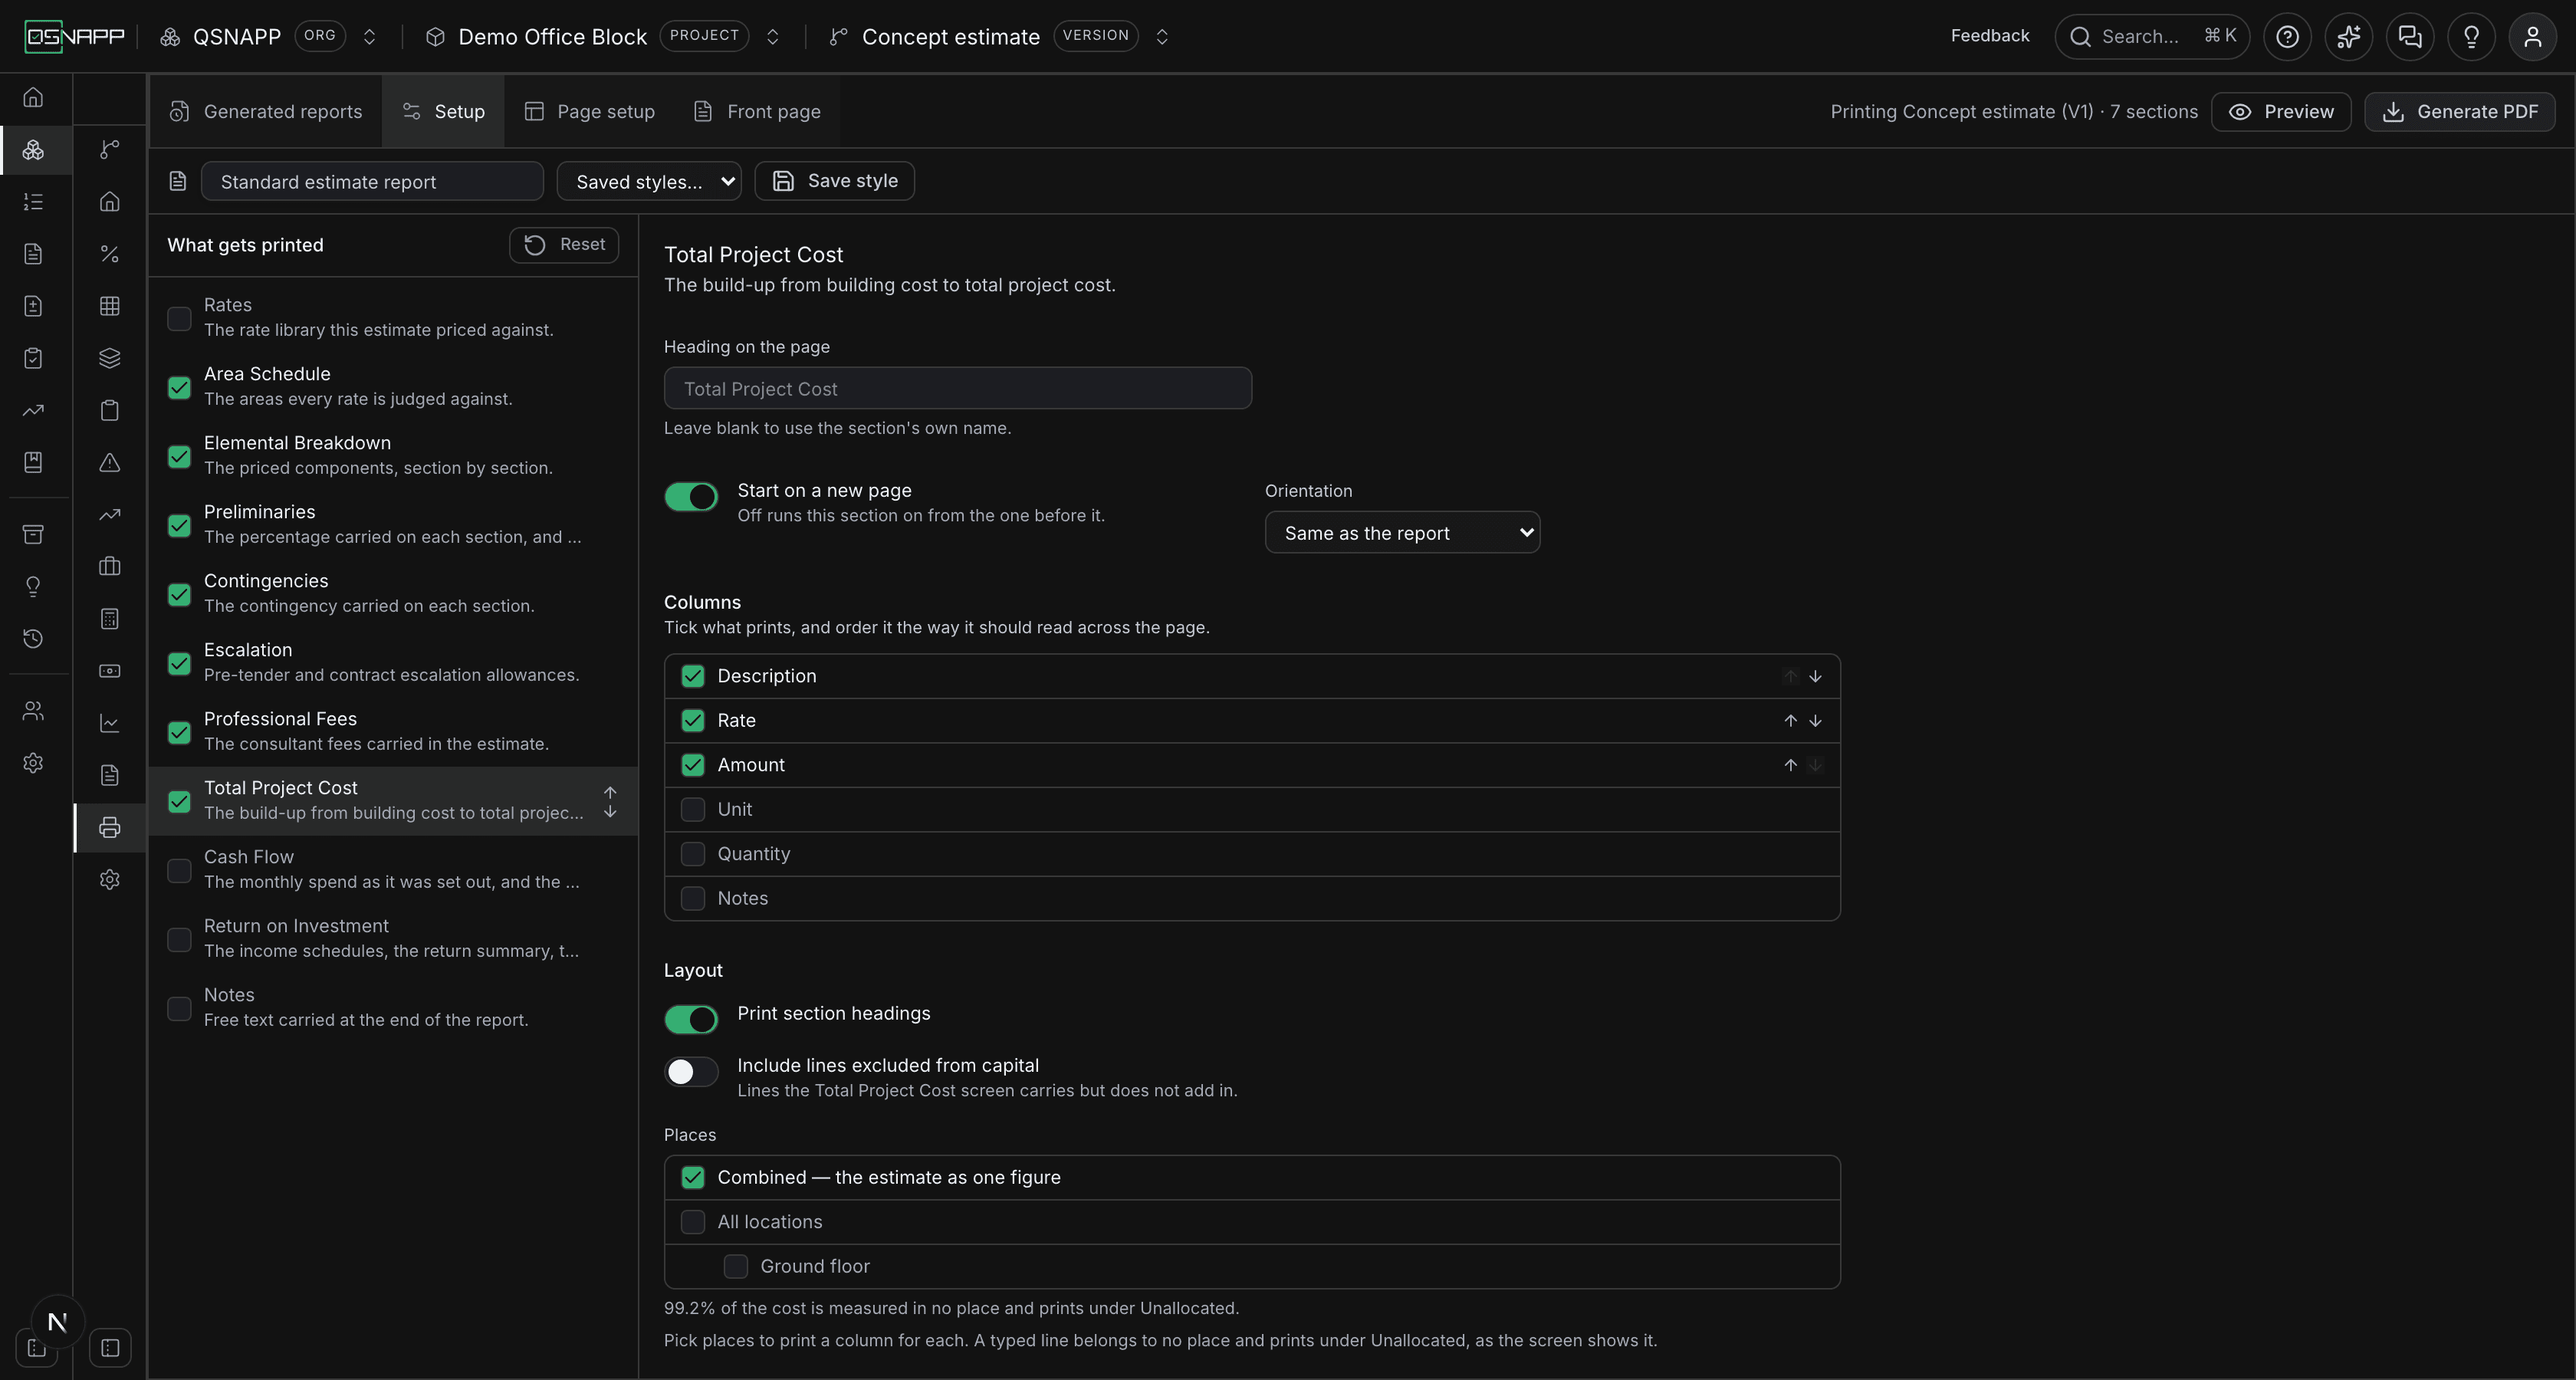
| Setting | To start with | What it does |
|---|---|---|
| Print section headings | On | Prints Development costs, Land costs and Post-capital costs as headings over their lines. Off runs the lines together. |
| Include lines excluded from capital | Off | Prints the lines the tab carries but does not add into the capital cost. Post-capital lines print either way, under their own heading. |
| Places | Combined | A column per place you pick. A typed line belongs to no place and prints under Unallocated, as the screen shows it. |
Lines print at their stored amounts from the Total project cost tab; the unit, quantity and notes columns are there for the lines that carry them.
Cash Flow
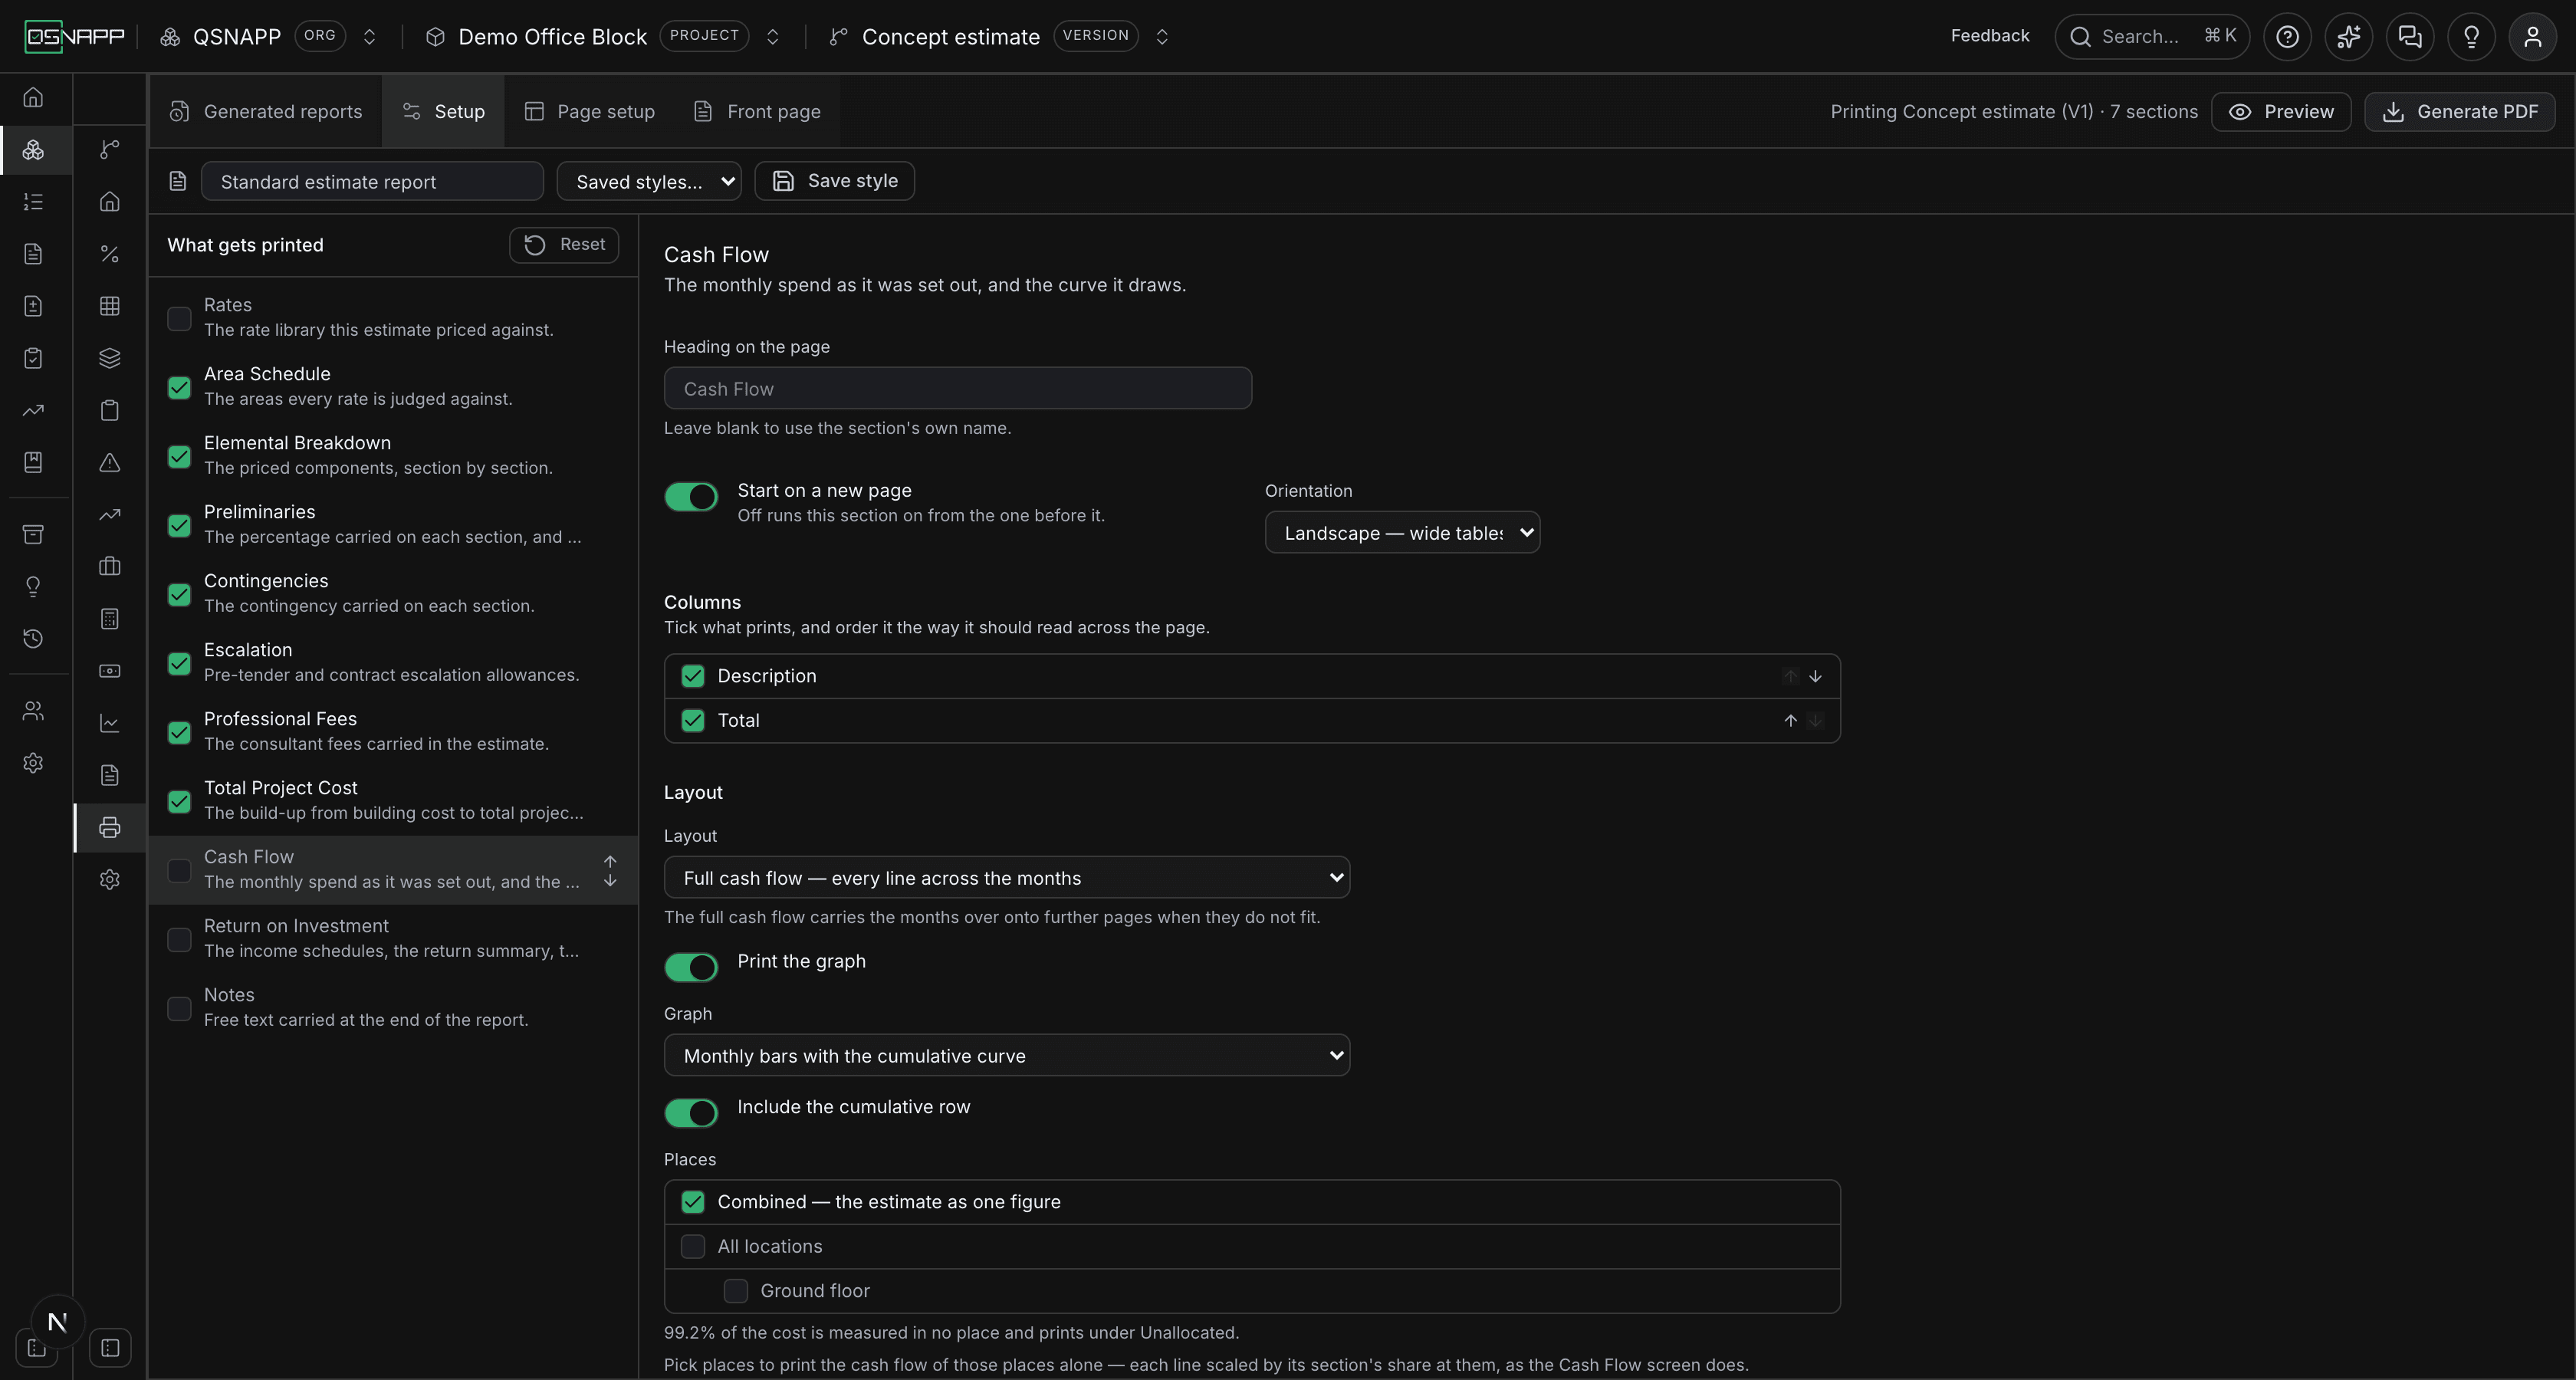
| Setting | To start with | What it does |
|---|---|---|
| Layout | Full cash flow | Full cash flow — every line across the months prints each line with a column per month. When the months do not fit one sheet, they carry over onto further pages with the description and total repeated, under a continued heading. Monthly summary — one row per month prints period, planned, cumulative and percent of total, one row per month. |
| Print the graph | On | Draws the cash flow graph under the table, at the page's width. |
| Graph | Monthly bars with the cumulative curve | Which graph: the bars with the S-curve over them, Monthly bars only, or Cumulative S-curve only. Only read when the graph is printed. |
| Include the cumulative row | On | Adds a running total across the months at the foot of the full cash flow. Not read for the monthly summary, which has cumulative as a column. |
| Places | Combined | Prints the cash flow of the places you pick alone, each line scaled by its section's share at them, as the tab does. |
A line the Cash Flow screen keeps out of its totals prints marked (excluded). One thing to know: the Cash Flow screen keeps its period, distribution and allocations in the browser, not in the database, so the report is handed what this browser is showing. A cash flow set out on another machine cannot be printed from this one, and one never set out prints No cash flow has been set out for this version yet.
Return on Investment
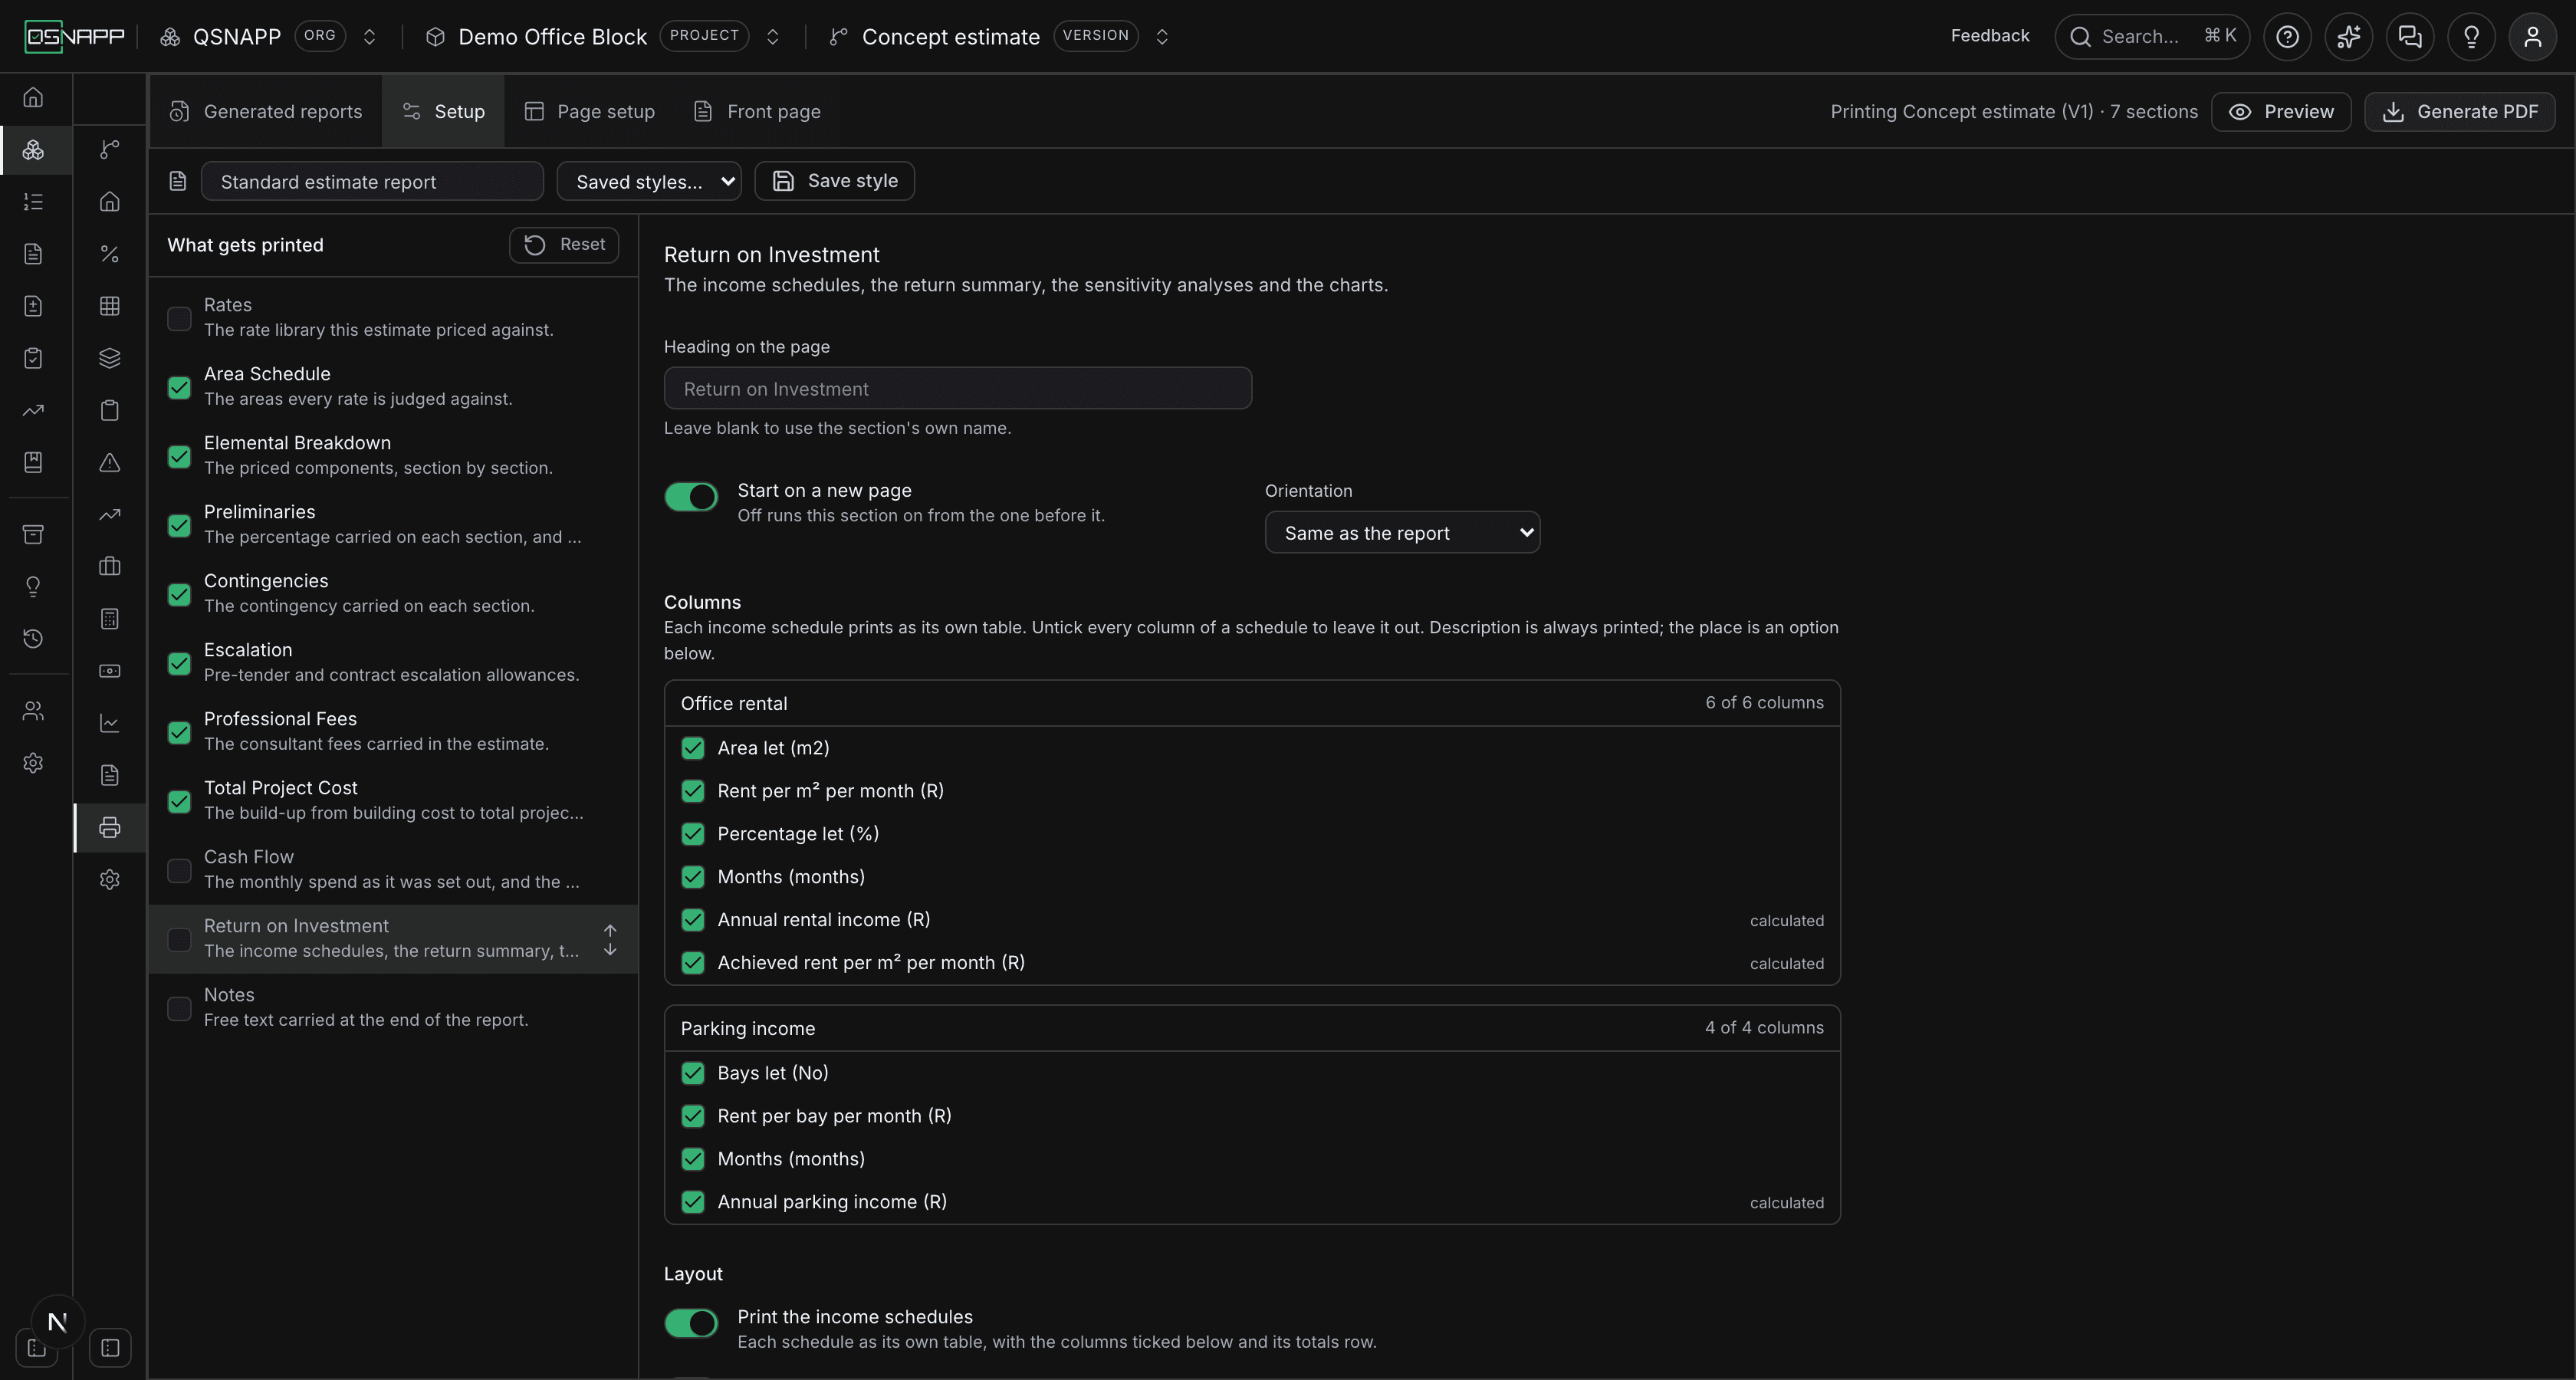
| Setting | To start with | What it does |
|---|---|---|
| Print the income schedules | On | Each schedule as its own table, with the columns ticked above and its totals row. |
| Print the place each line is about | On | Adds a Place column to the income tables. |
| Print the ROI summary | On | Every row of the summary with its figure; an input row is marked as entered. |
| Print the sensitivity analyses | On | Each analysis as a table of its scenarios, with the break-even beneath where it has one. |
| Print the charts | On | Drawn as they are on screen, in their order, at the page's width. |
The ROI guide says what each of those looks like on the page.
Notes
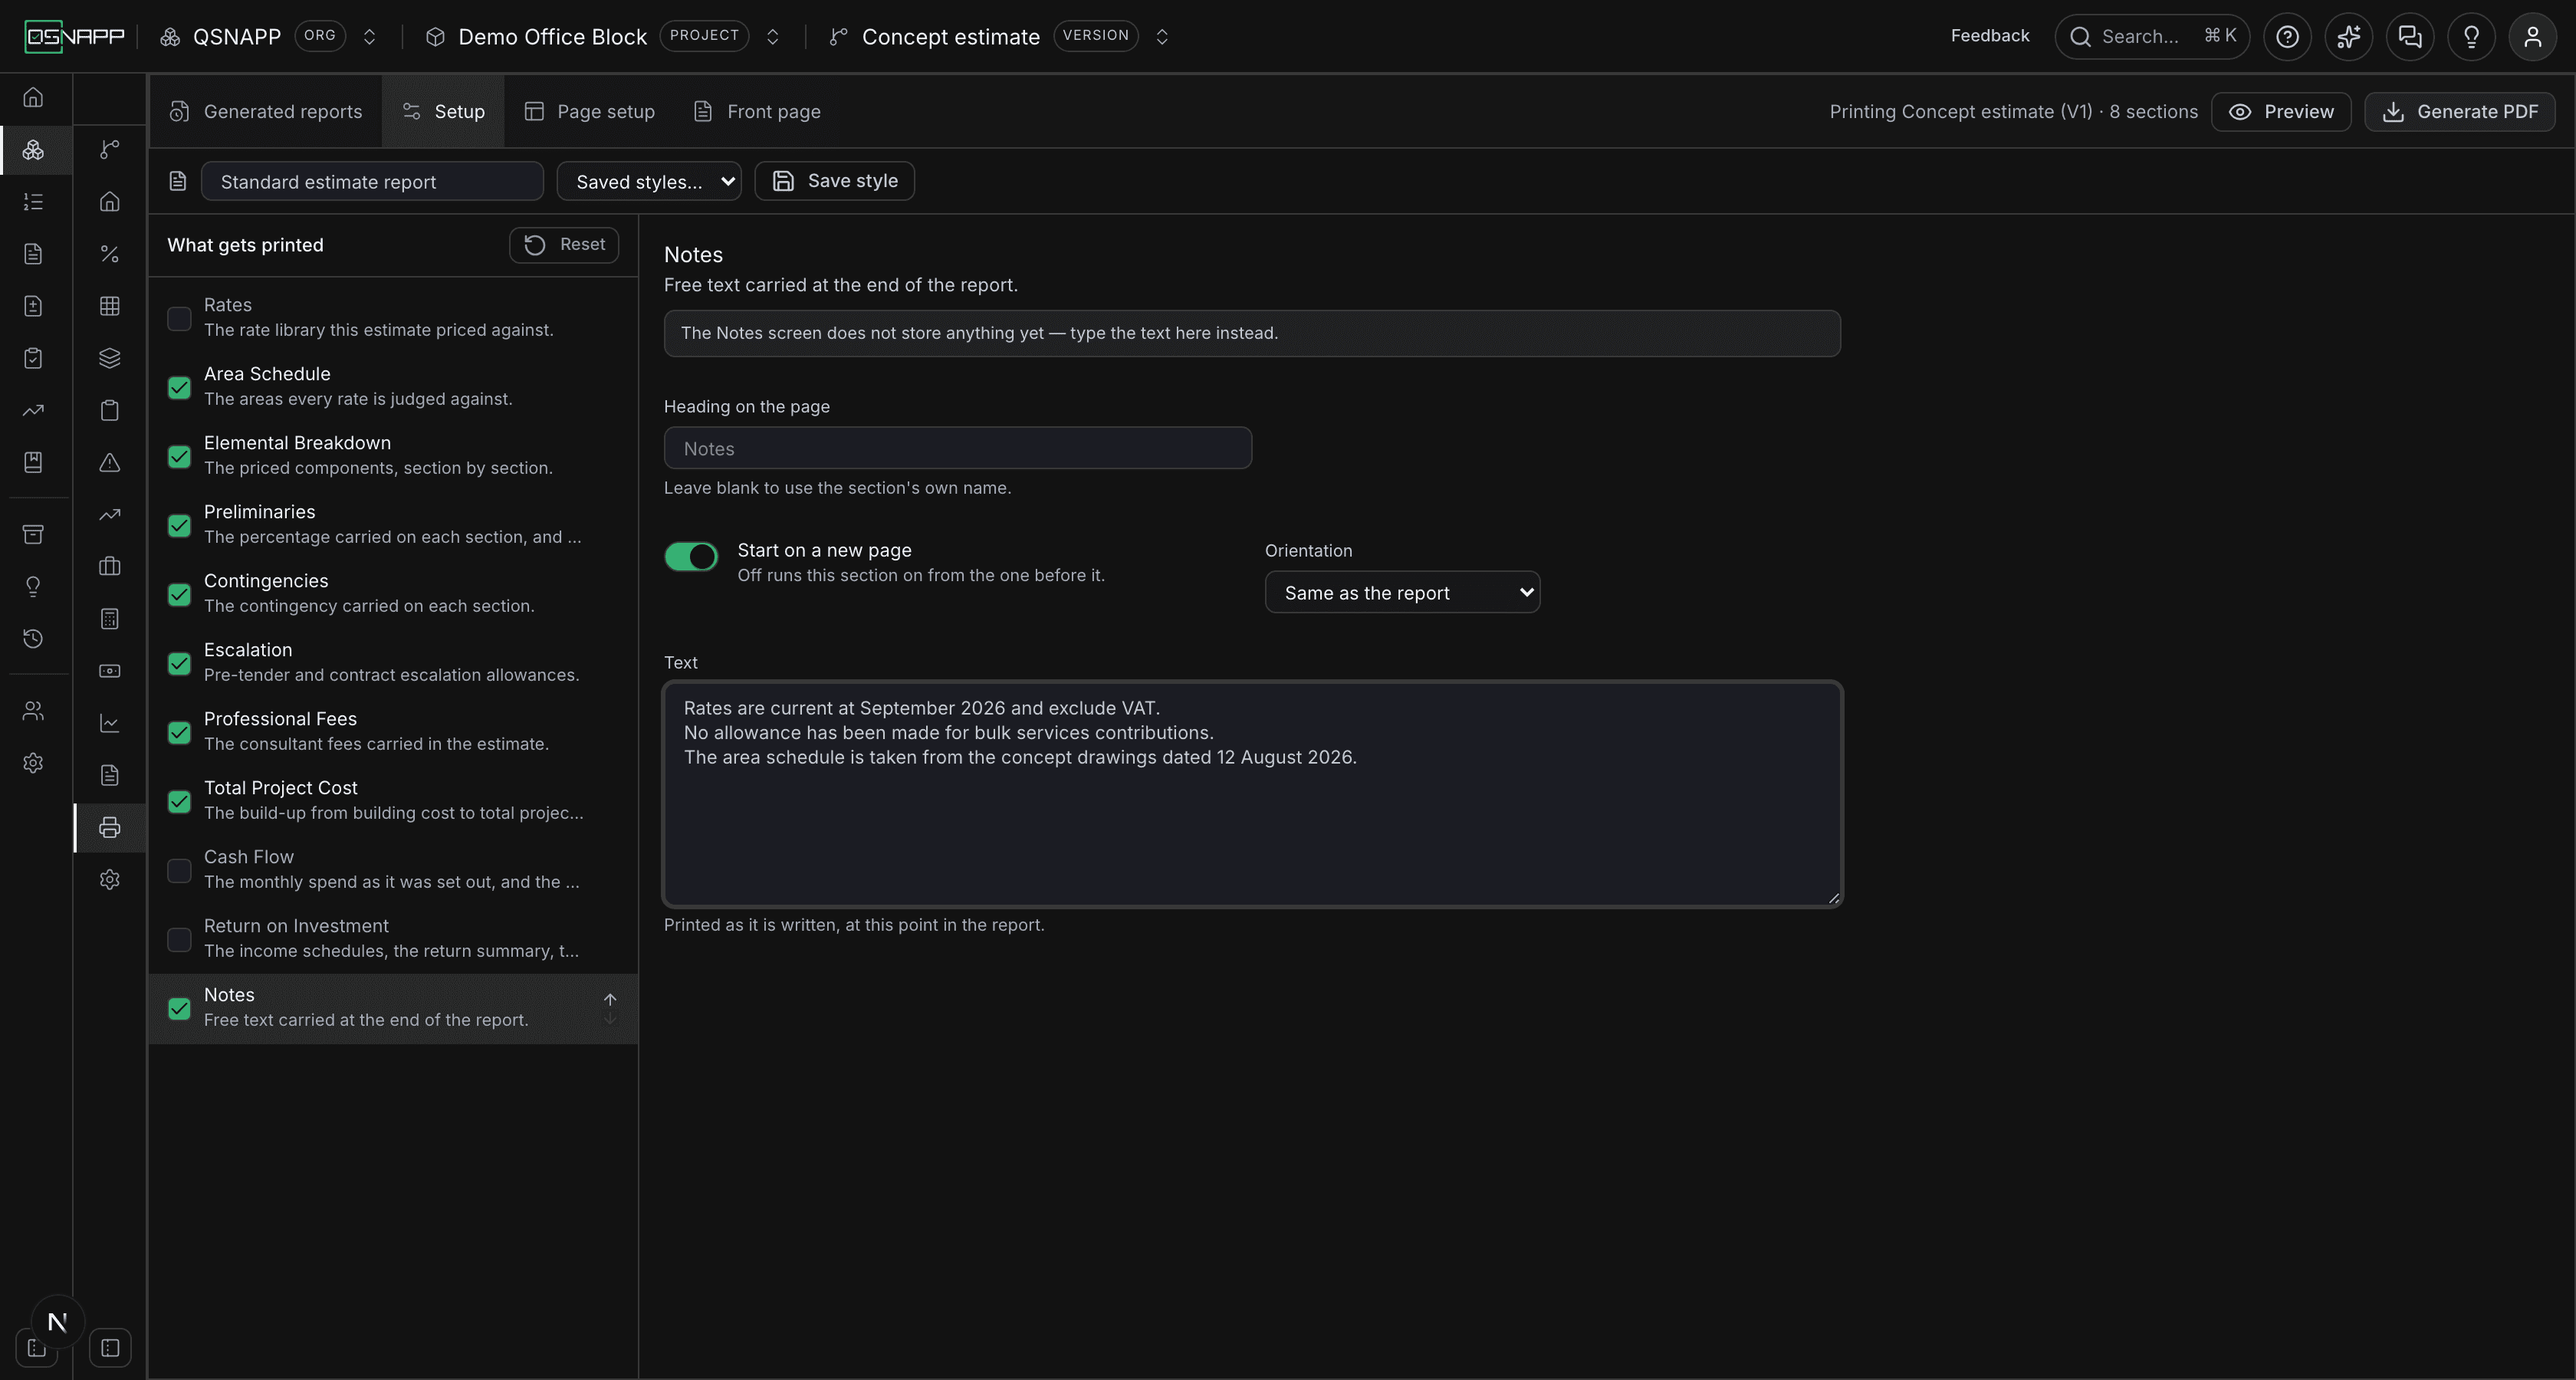
The Notes row in the rail says The Notes screen does not store anything yet — type the text here instead, and that is exactly the situation: the section's only setting is its Text, a box under the three settings every section has. What is typed is printed as it is written — line breaks kept — at that point in the report, under the section's heading. Left blank, it prints No notes were entered. It is off to start with, and is the natural last section: assumptions, exclusions, qualifications.
Printing by place
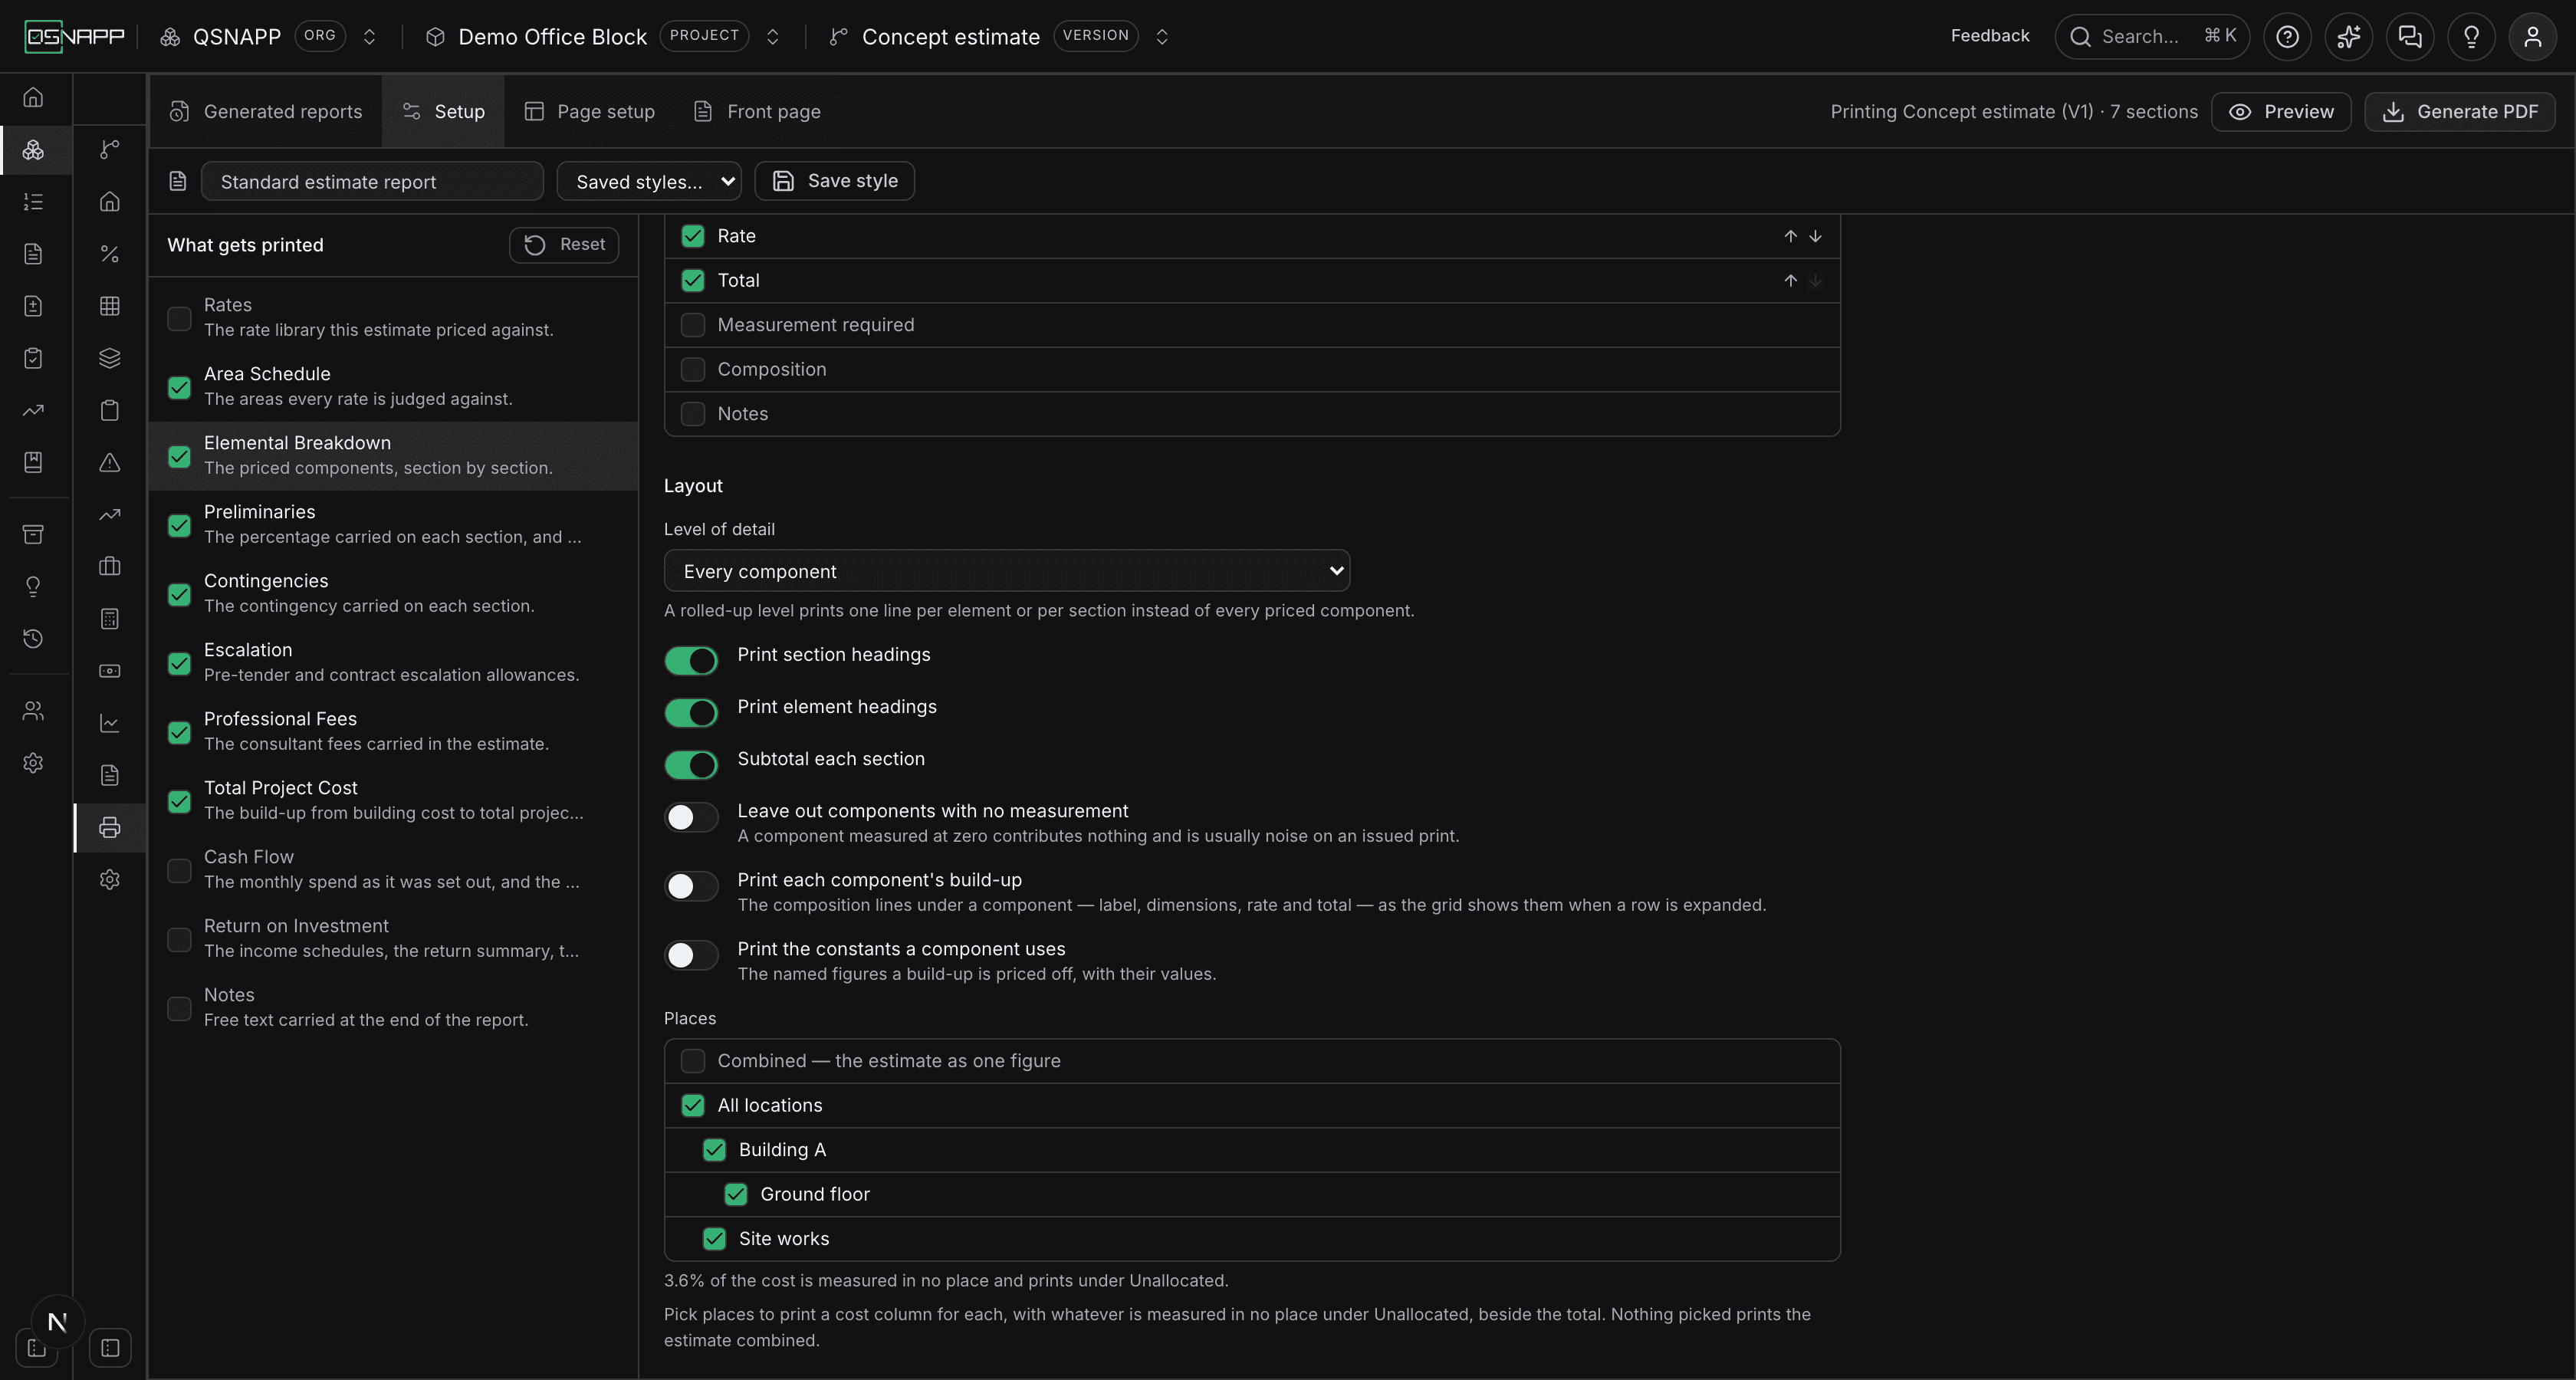
Every section that the screens can read by place — the elemental breakdown, preliminaries, contingencies, escalation, professional fees, the total project cost and the cash flow — ends its Layout options with a Places picker. It has the same three states the screens offer:
| Tick | What prints |
|---|---|
| Combined — the estimate as one figure | Nothing else is ticked. The section prints as one figure, the way it printed before places existed. This is the start. |
| All locations | Ticks every place at once; unticking it clears them all. The section prints a column for every place the estimate is measured in. |
| A place | One column for that place. Tick as many as you want to compare; nested places are indented under their parents. |
Only places something is actually measured in are offered; the rest would print an empty column. An estimate not measured by place says This estimate is not measured by place yet, so it prints combined in place of the list. A line under the list says what share of the cost is measured in no place and will print under Unallocated, so the place columns always add up to the total.
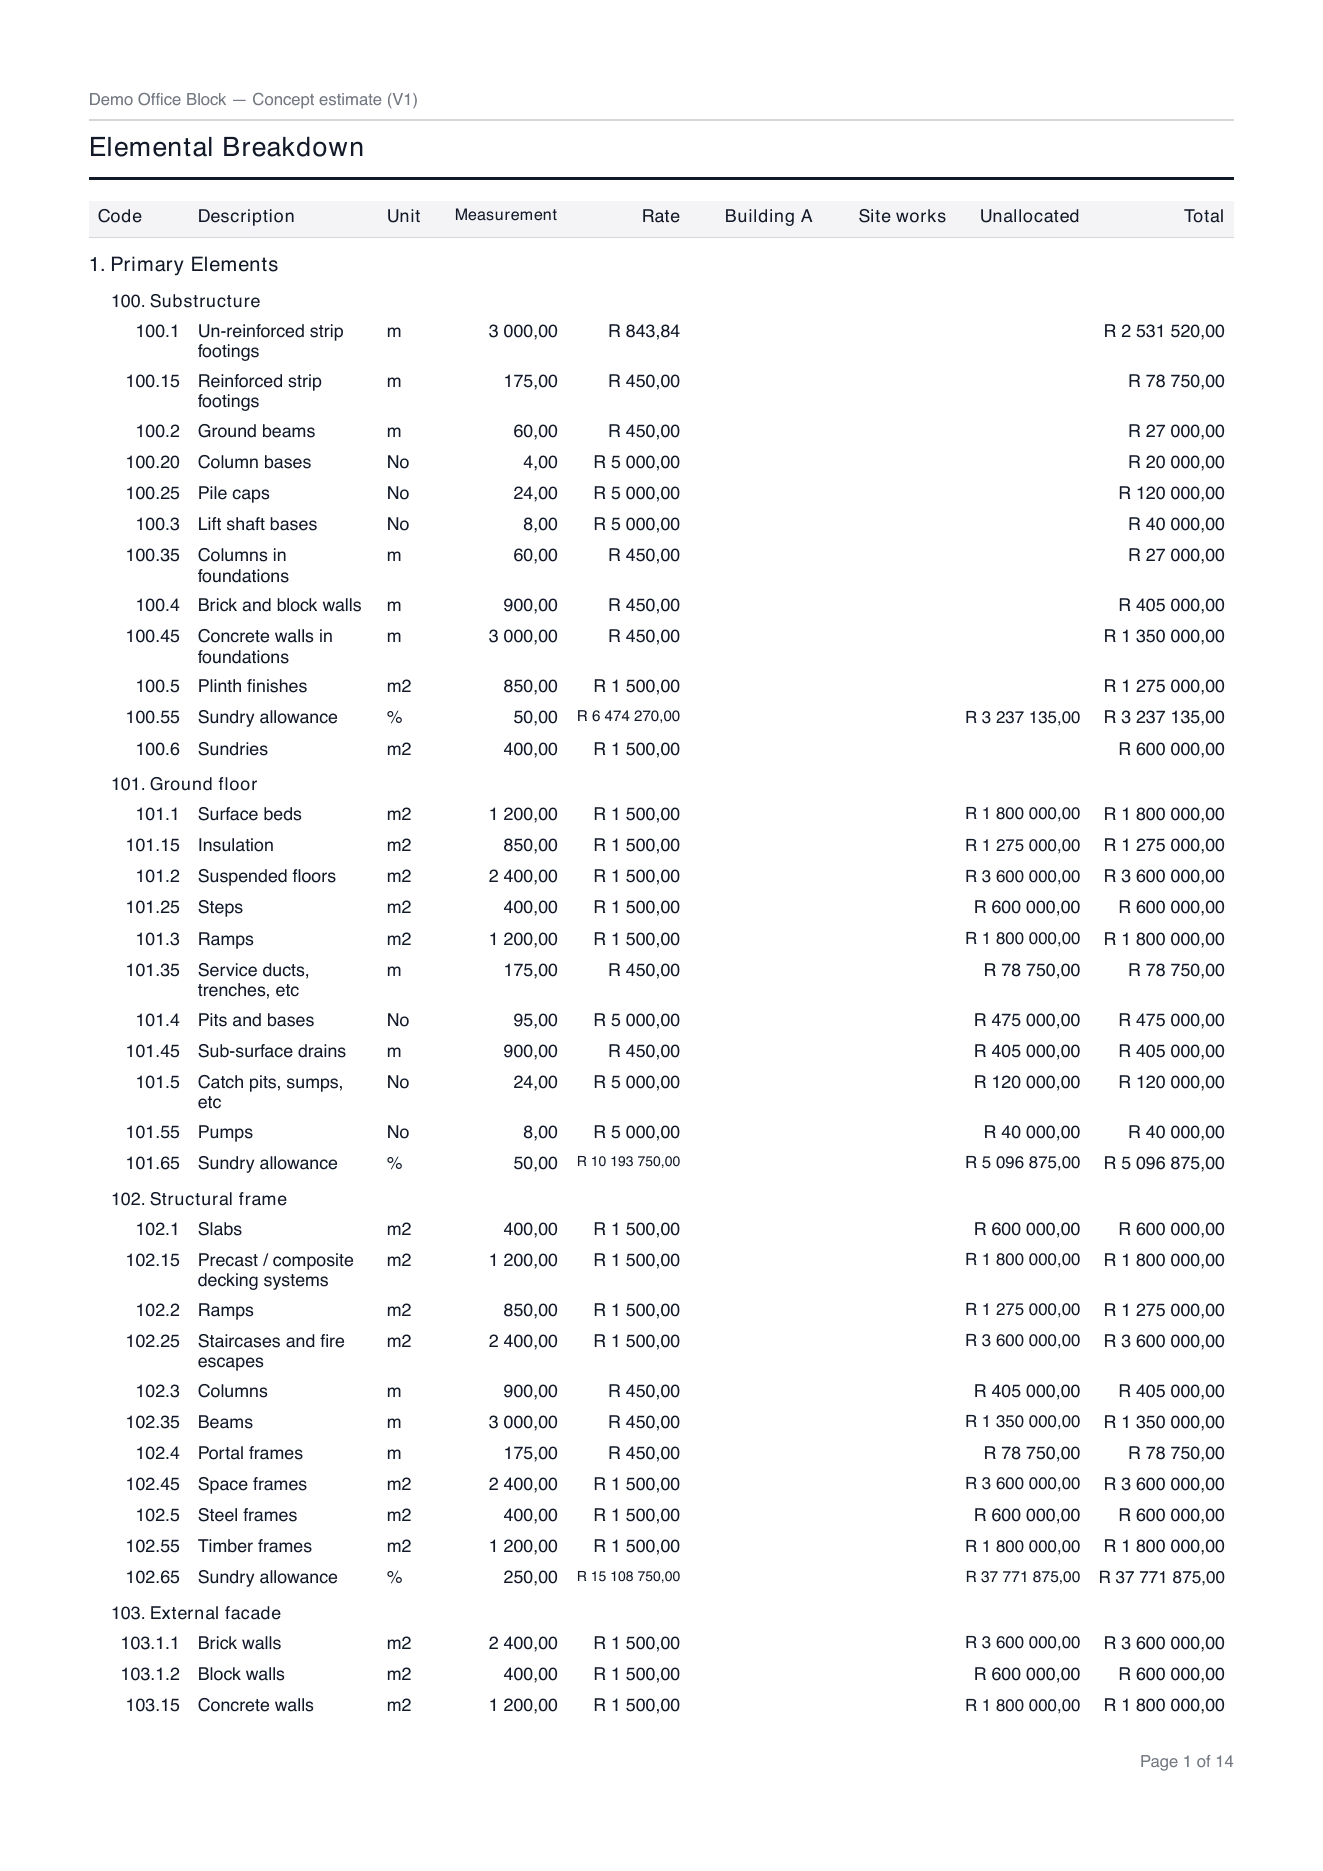
What a tick does depends on the section, and follows its screen:
- The elemental breakdown gains a cost column per place beside the total, each component split by its allocation.
- Preliminaries and contingenciessplit each section's figure by that section's share at each place.
- Professional fees and the total project costsplit by the project's share at each place. A typed total-project-cost line belongs to no place and prints under Unallocated.
- The cash flowprints the chosen places alone, each line scaled by its section's share.
- Escalation prints only the rows about the chosen places, with a Place column that reads Whole project where none is named; rows about no place are always printed.
Page setup
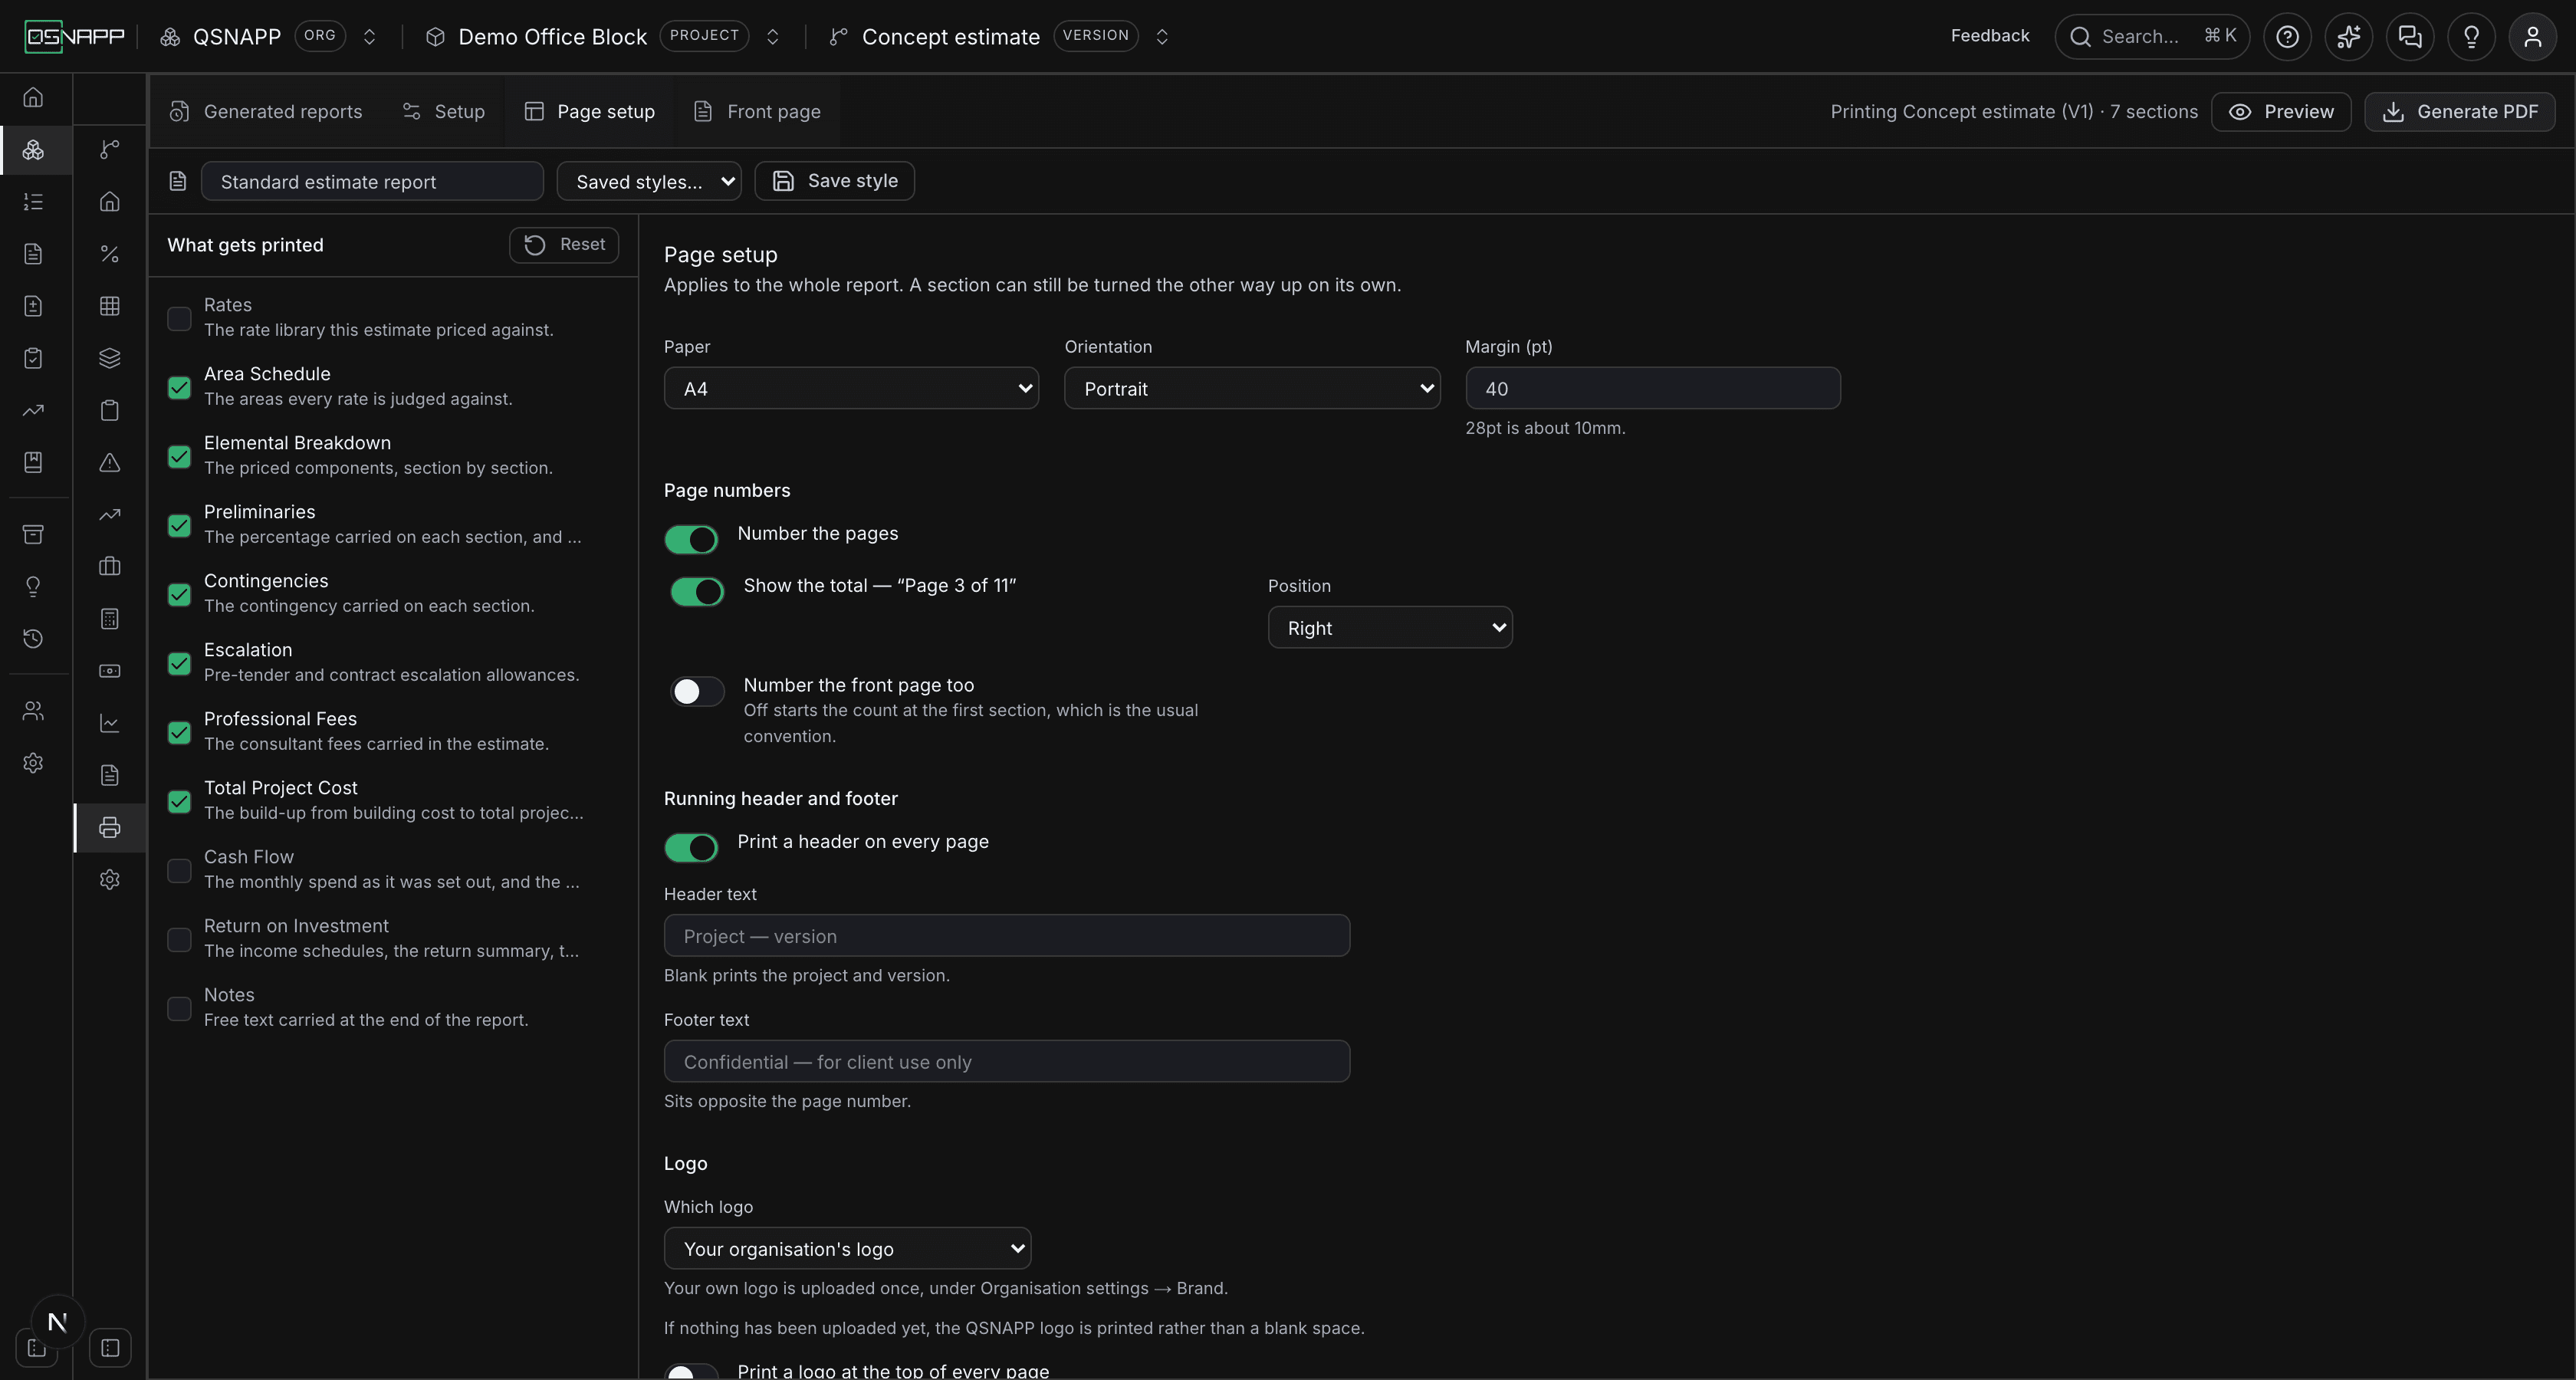
The second tab in the strip. Everything here applies to every page of the document; the only per-section exception is orientation, above.
Paper, orientation and margin
| Setting | To start with | What it does |
|---|---|---|
| Paper | A4 | A4, A3 or Letter. The tables spread across whatever width the paper leaves, so A3 gets wider columns rather than more of them. |
| Orientation | Portrait | Portrait or landscape for the report as a whole. A section set to Same as the report follows it; one set to its own orientation does not. |
| Margin (pt) | 40 | The white space around every page, in points: 72 pt is an inch, 28 pt about 10 mm, so 40 is a little over 14 mm. Held between 12 and 120 — 0 would print into the paper's edge, and half the page would leave no page. The header and footer sit inside the margin, above and below the tables. |
Page numbers
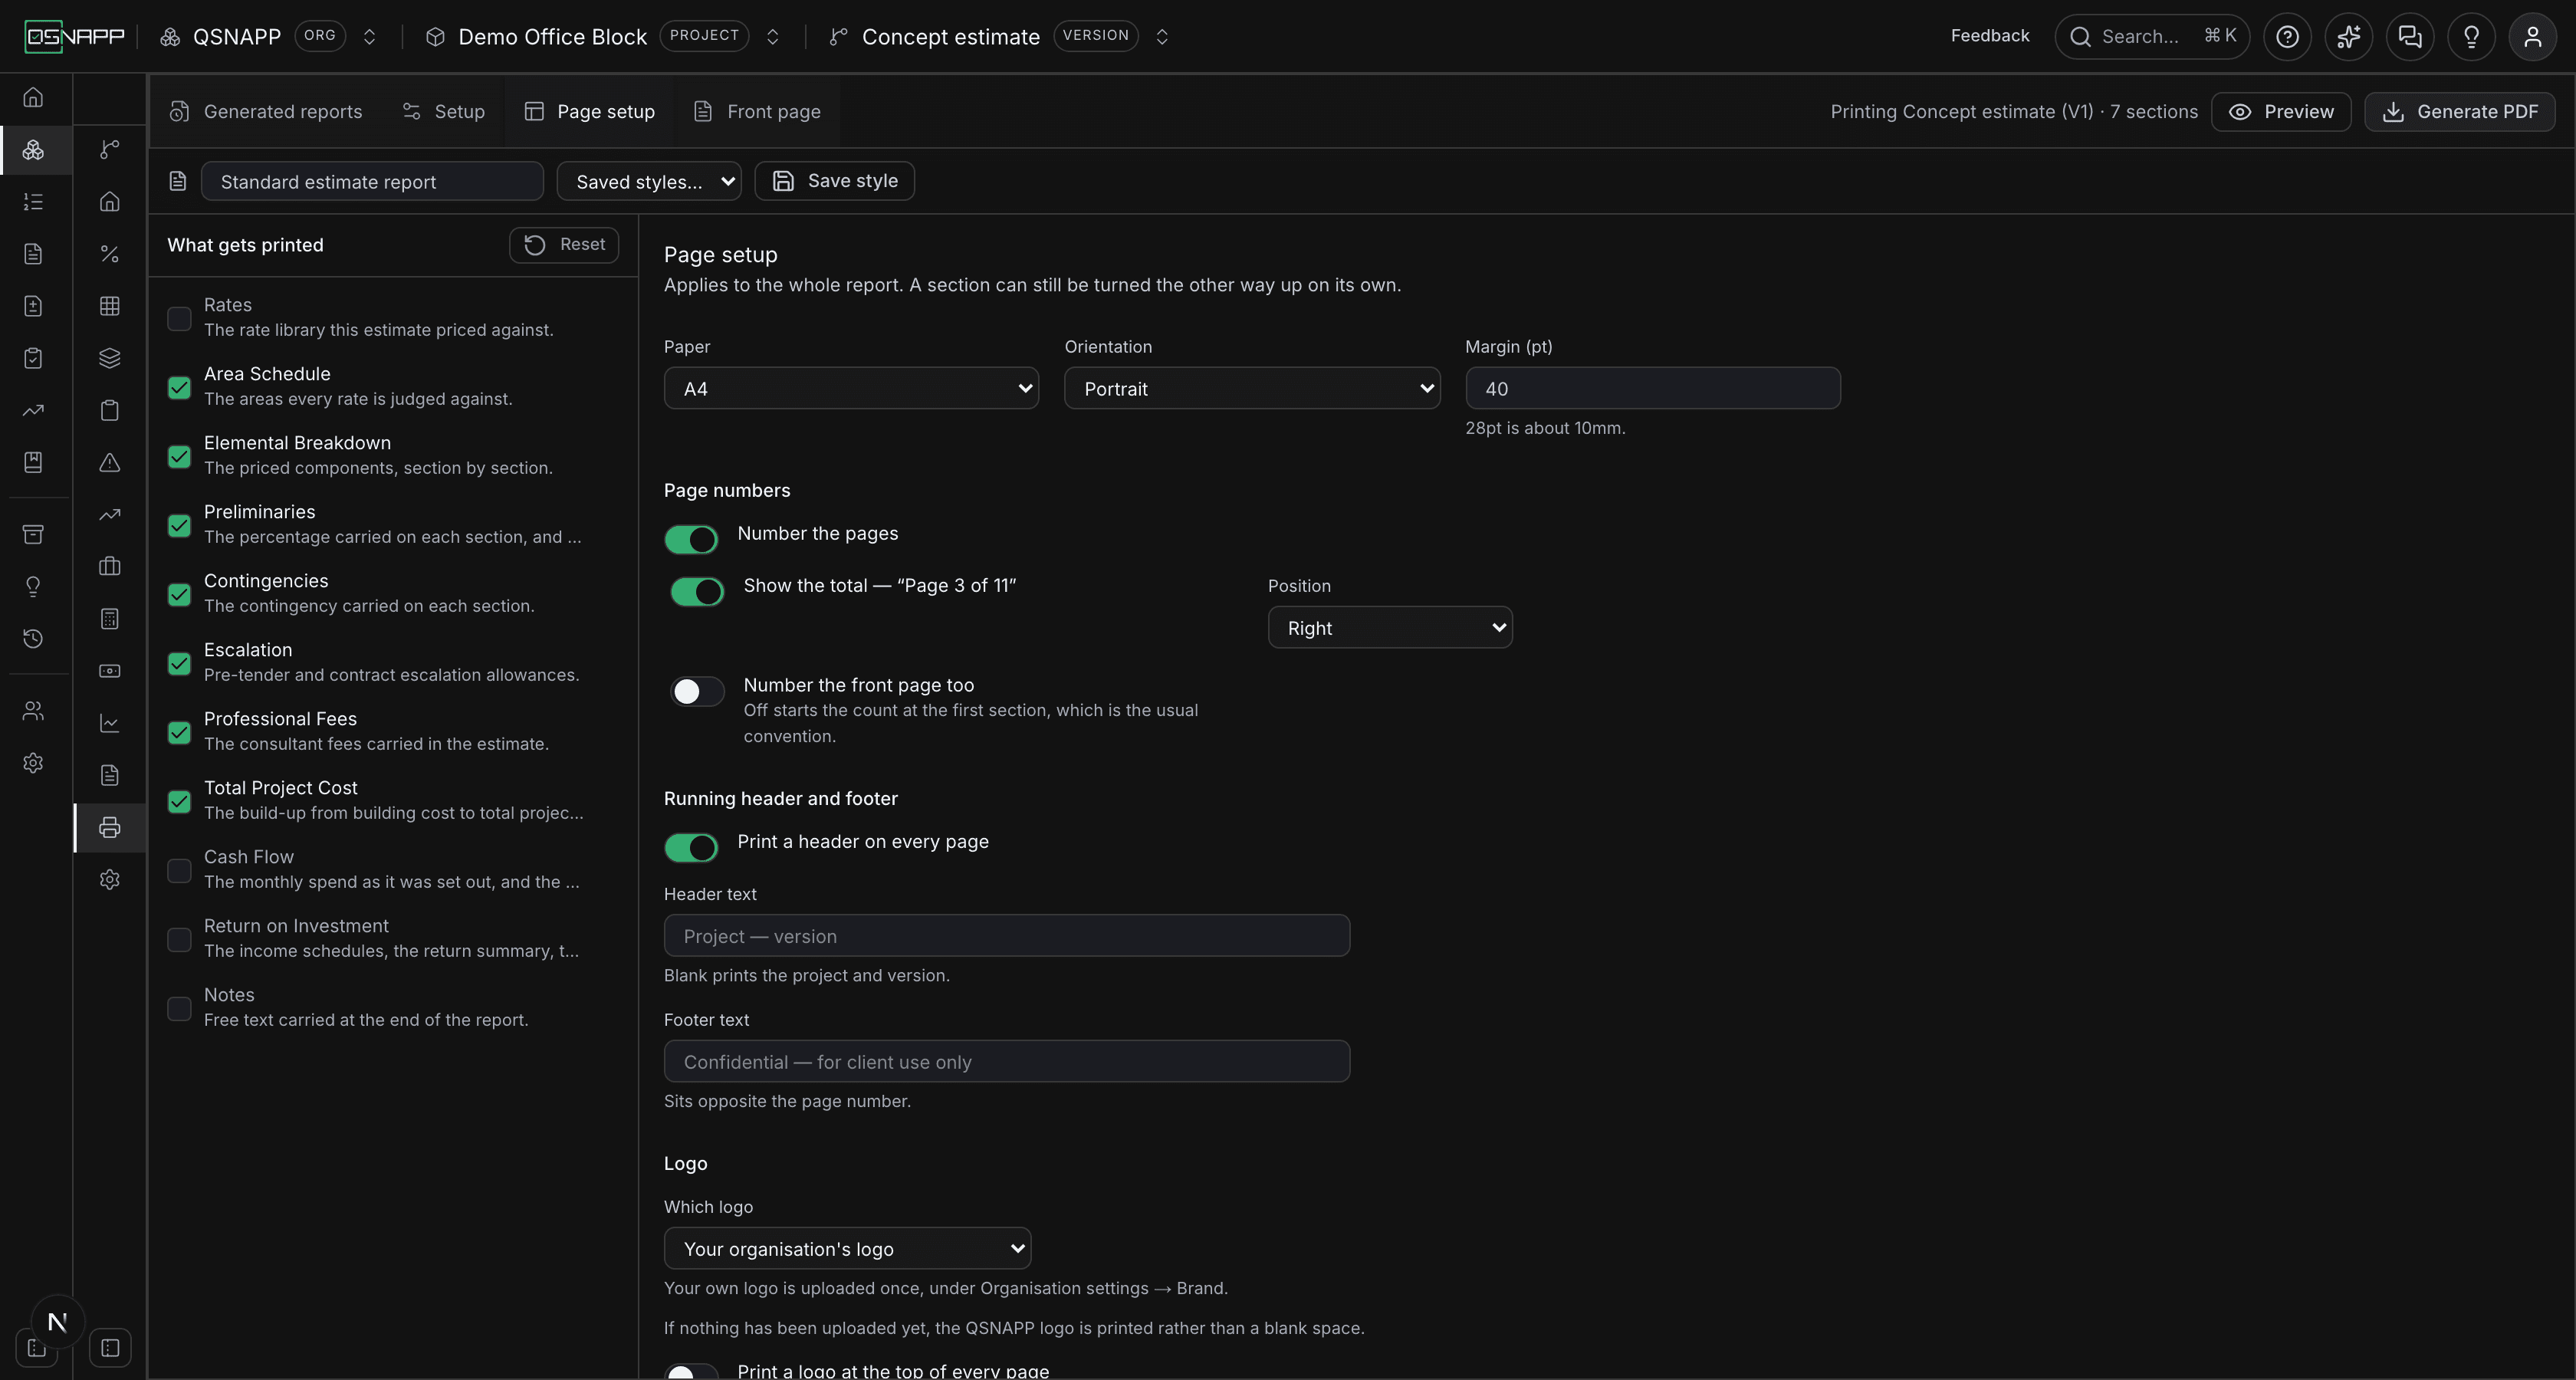
| Setting | To start with | What it does |
|---|---|---|
| Number the pages | On | Prints a page number in the footer of every page. Off hides the three settings below and prints none. |
| Show the total — “Page 3 of 11” | On | Page 3 of 11 rather than Page 3. The total is the number of pages that are numbered, so a front page left out of the count is not in the total either. |
| Position | Right | Left, centre or right of the footer. A centred number moves to the right when a footer logo is on, because the logo takes the centre. |
| Number the front page too | Off | Off, the count starts at the first section: Page 1 of 11 is the first page of the report rather than the second sheet of paper, which is the usual convention. On, the front page is page 1 and carries a number. |
Running header and footer
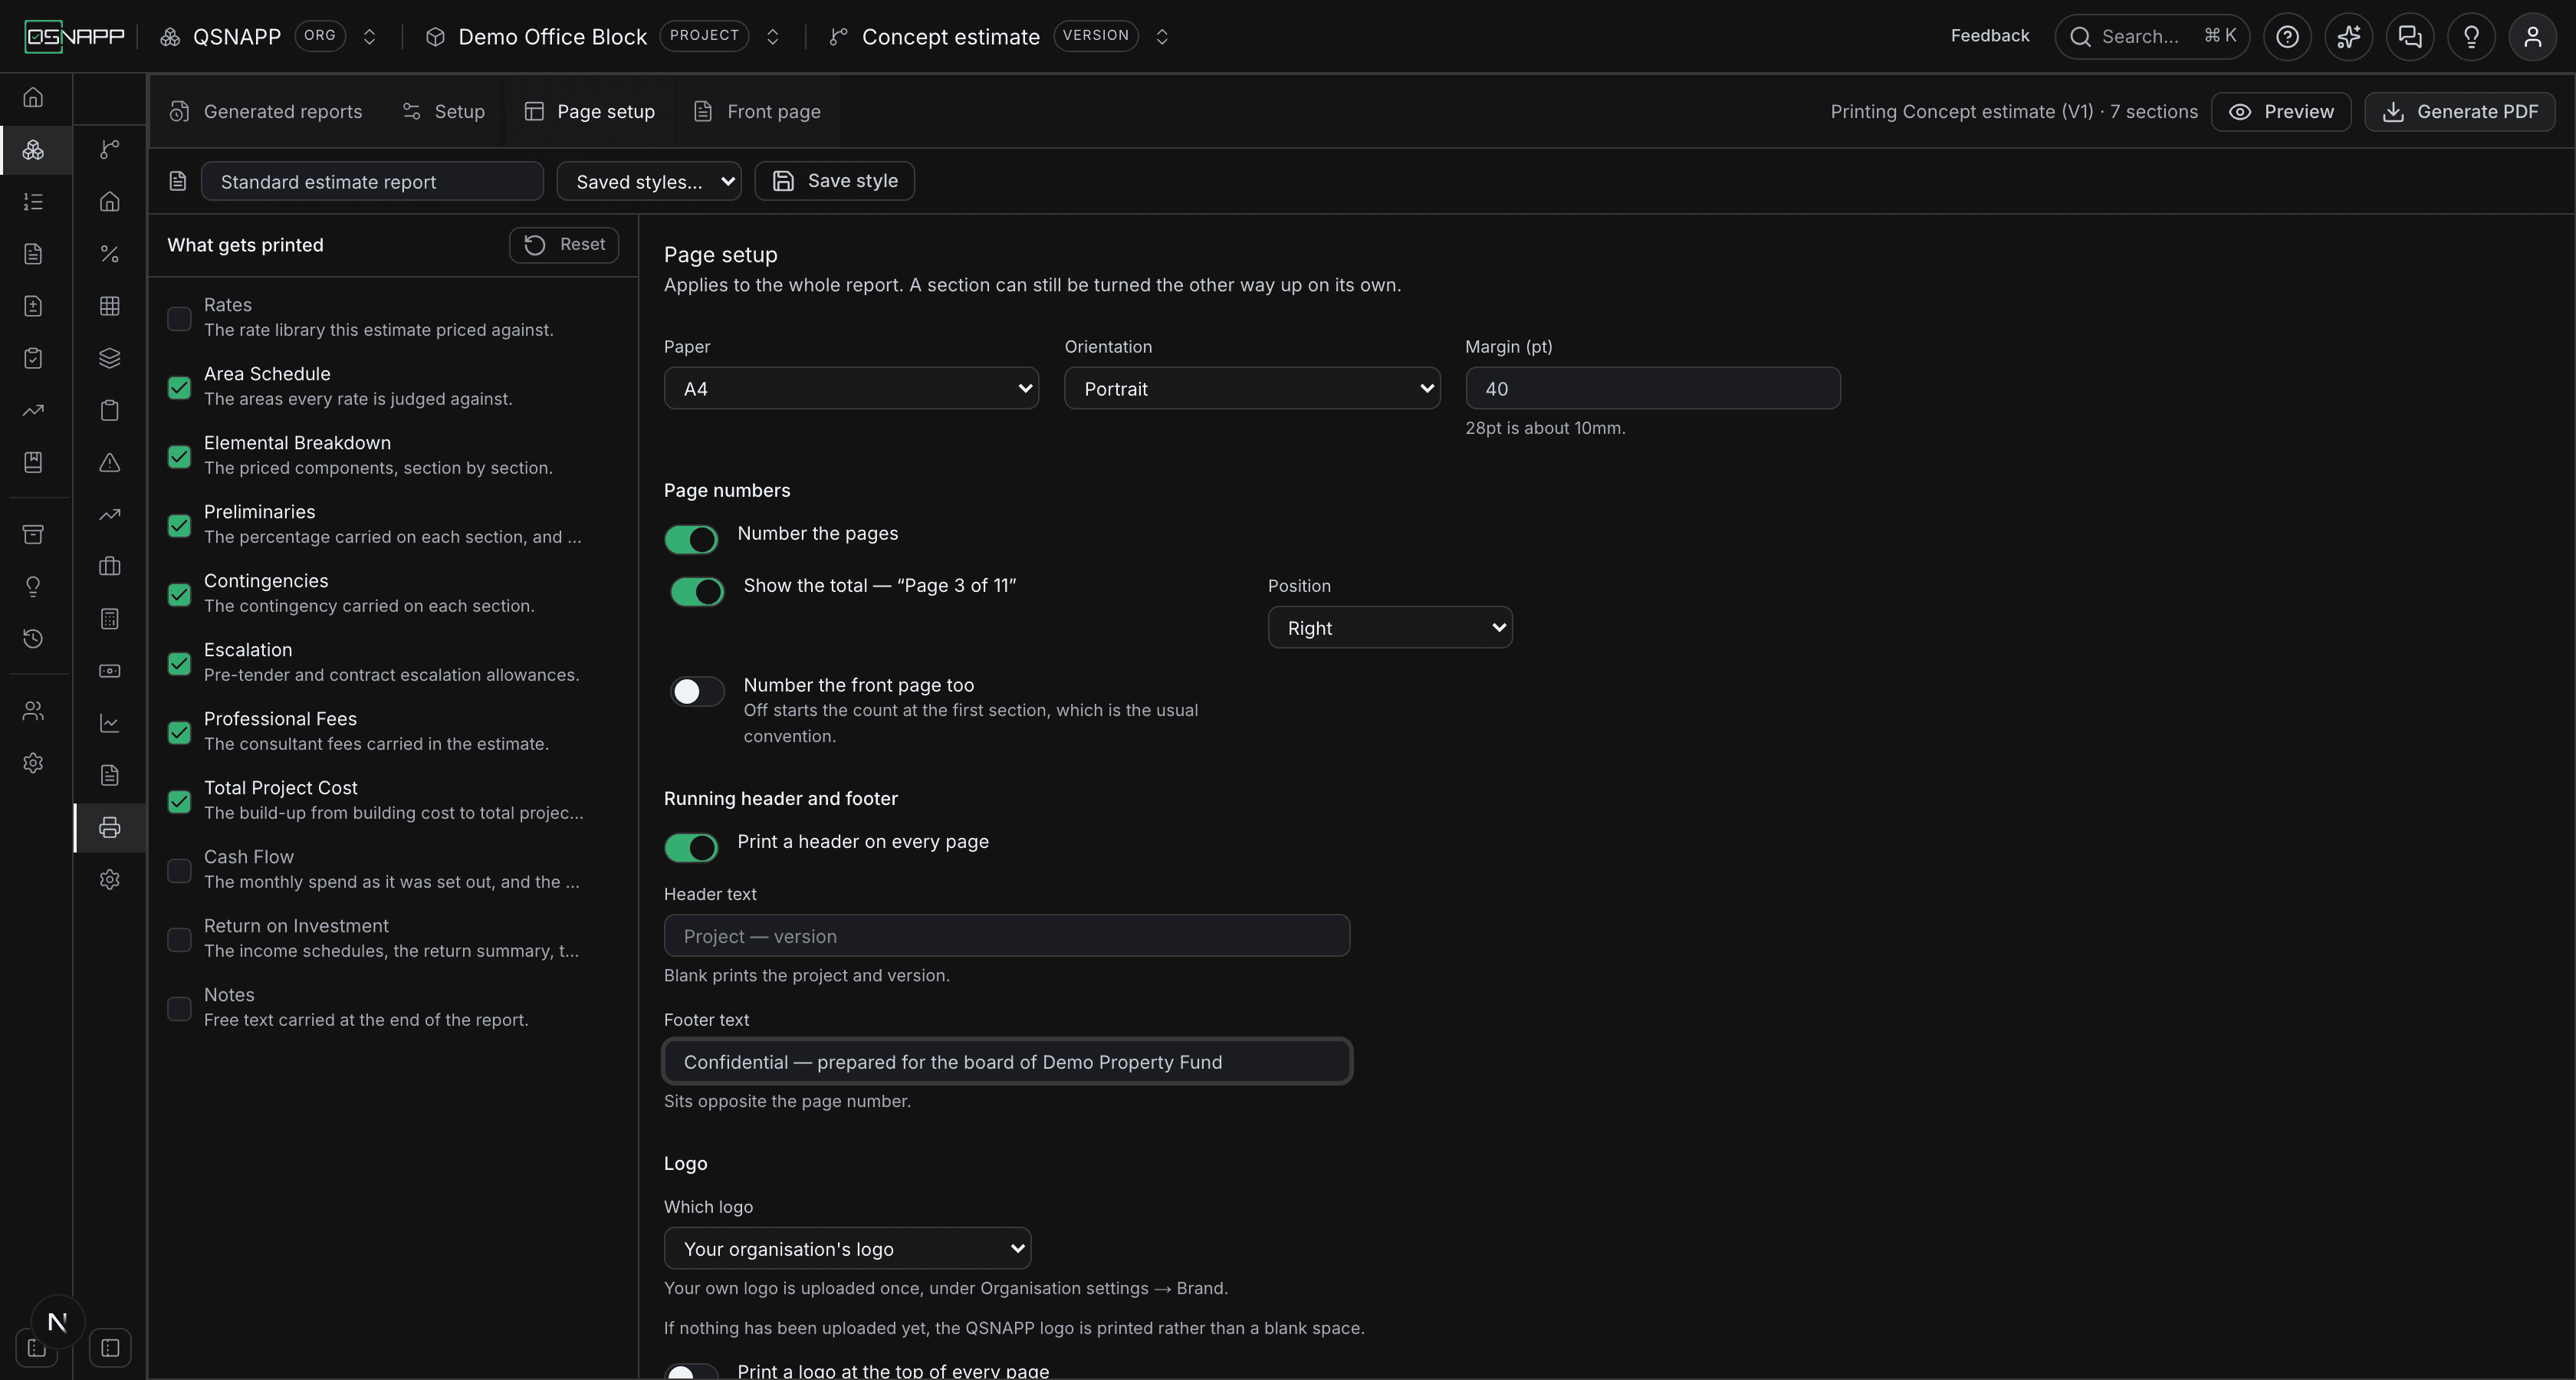
| Setting | To start with | What it does |
|---|---|---|
| Print a header on every page | On | A line of small grey text at the top of every page after the front page, with a rule under it. Off prints no header text; a header logo, if on, still prints. |
| Header text | blank | What the header says. Blank prints the project and version — Demo Office Block — Concept estimate (V1.0). Anything typed replaces it. One line; a line too long for the page is cut with an ellipsis. |
| Footer text | blank | A line at the foot of every page, at the left, opposite the page number — the place a confidentiality line usually goes. It may take up to six tenths of the width; longer is cut with an ellipsis. Blank prints nothing there. |

Logo
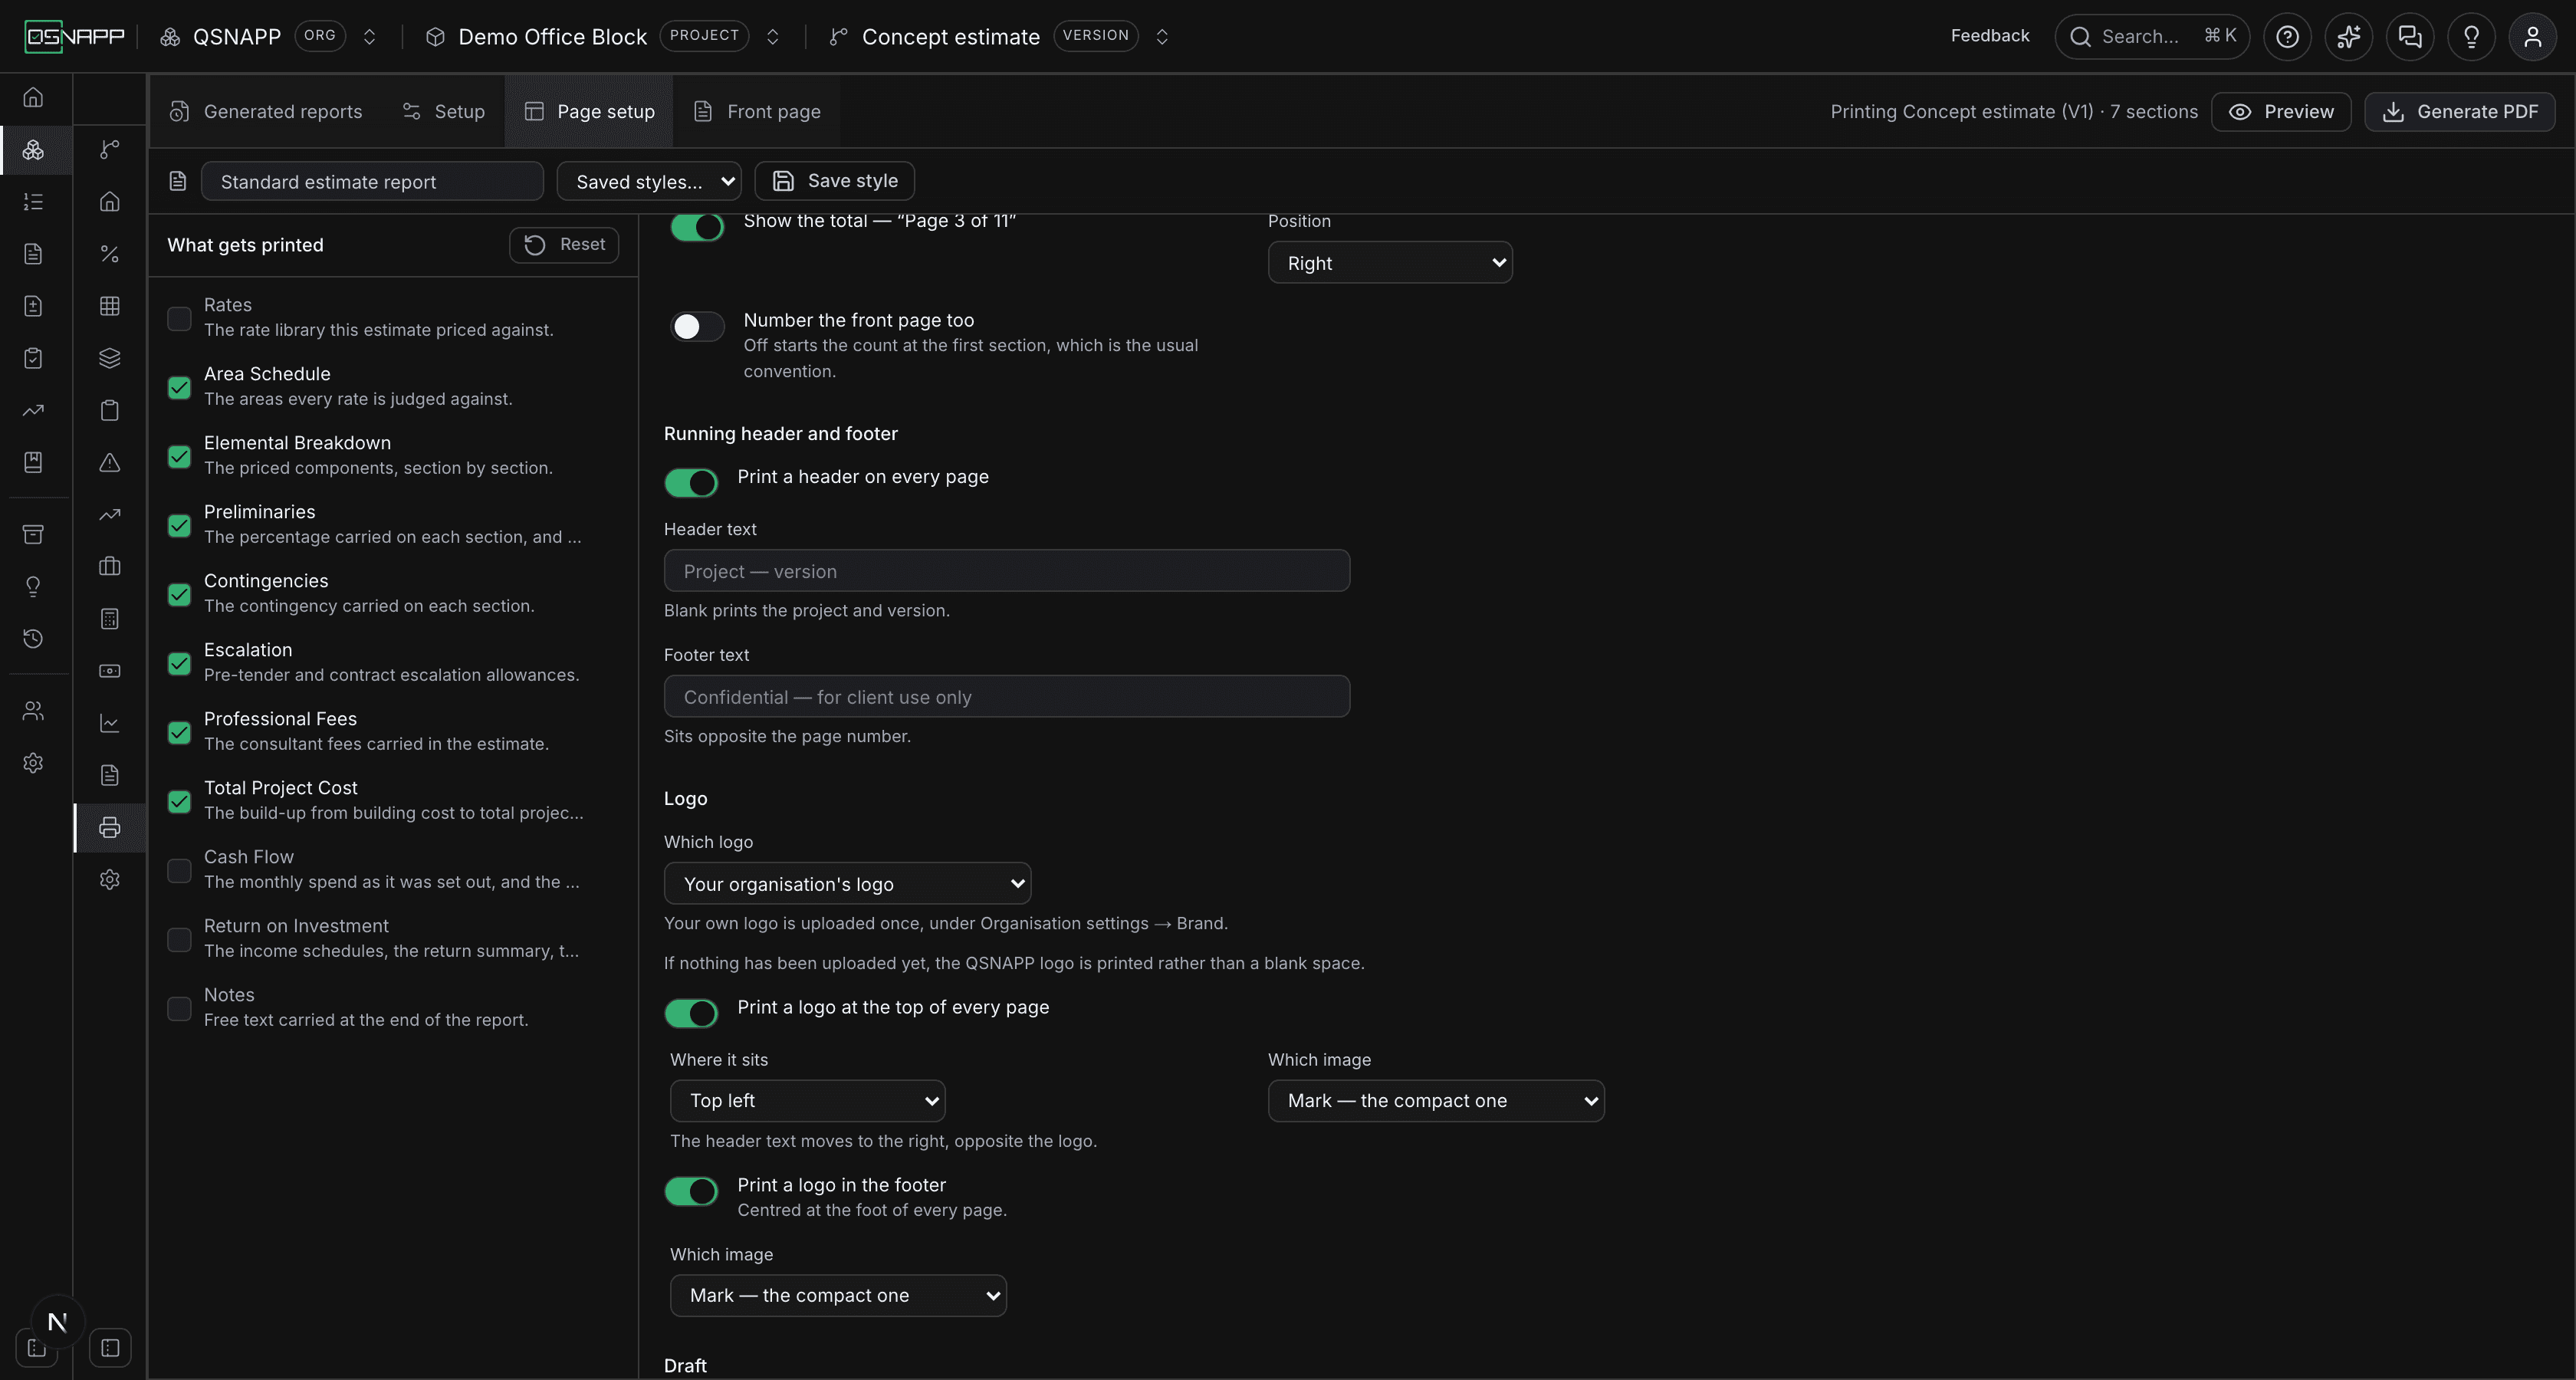
An organisation has two logos, uploaded once under Organisation settings → Brand: the Full logo, the lock-up that goes on a front page, and the Mark, the compact version that still reads at nine points in a footer. Either can be PNG, JPG, SVG or WebP up to 5 MB. Which of them a report uses, and where, is decided here, per report.
| Setting | To start with | What it does |
|---|---|---|
| Which logo | Your organisation's logo | Whose mark the whole report carries: your organisation's, The QSNAPP logo, or No logo. If your organisation has not uploaded one, the QSNAPP logo is printed rather than a blank space where a logo was asked for. No logohides the two placements below and also takes the logo off the front page, whatever that tab's own switch says. |
| Print a logo at the top of every page | Off | A small logo, 13 pt high, in the header of every page after the front page. |
| Where it sits | Top left | Top left, top centre or top right. The header text takes the other end of the row so the two never print over each other: a left logo sends the text to the right; a right logo keeps the text on the left, stopping short of it; a centred logo keeps the text on the left, stopping short of the centre. |
| Which image (header) | Mark | Full logo or Mark — the compact one. If only one of the two has been uploaded, the other placement uses the one there is. |
| Print a logo in the footer | Off | A logo 9 pt high, always centred at the foot of every page. It has no position of its own; a centred page number moves to the right to clear it. |
| Which image (footer) | Mark | The same choice, for the footer. |

A logo is embedded in the document once and drawn on every page from that one copy, so a report with a logo on forty pages is not forty times the size.
Draft
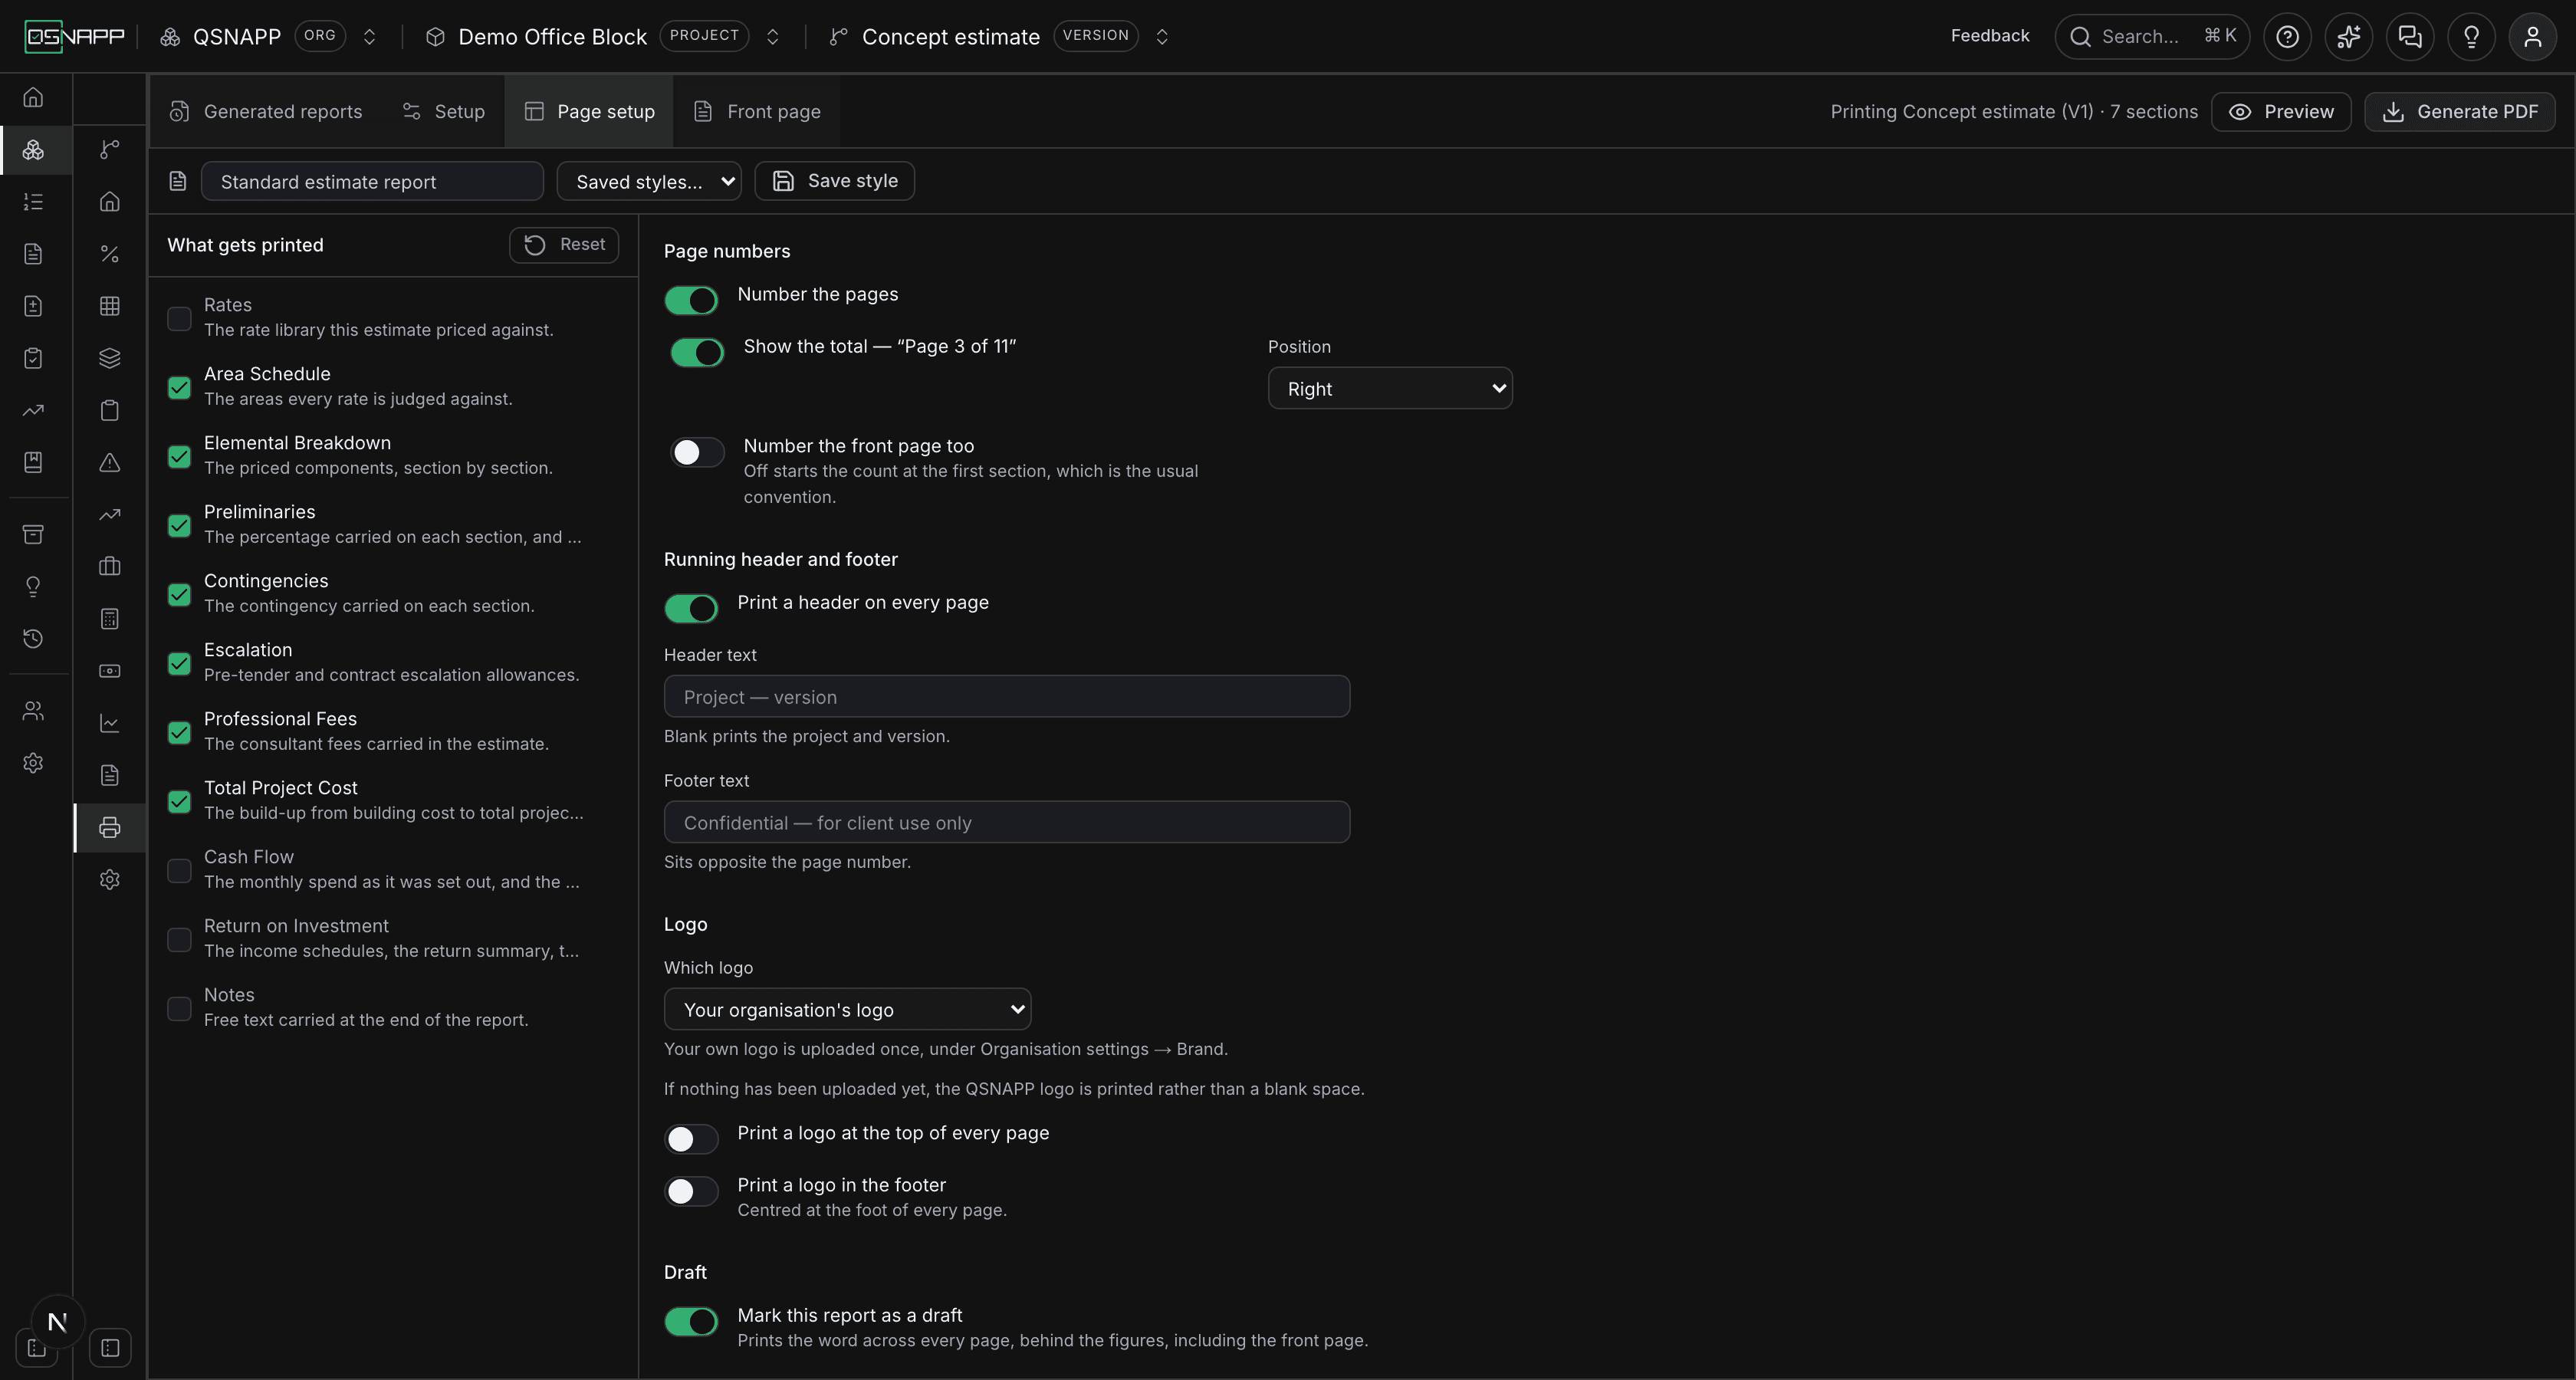
| Setting | To start with | What it does |
|---|---|---|
| Mark this report as a draft | Off | Prints a word diagonally across every page, including the front page, in faint grey behind the figures rather than over them. Every page, because a draft that only says so on page one gets photocopied from page two. Behind, because a mark laid over the tables would tint every figure a reader has to read. |
| Watermark text | DRAFT | The word. PRELIMINARY, NOT FOR CONSTRUCTION, whatever the document is. It is sized to span most of the page's diagonal, whatever the word and the paper; blank falls back to DRAFT. |
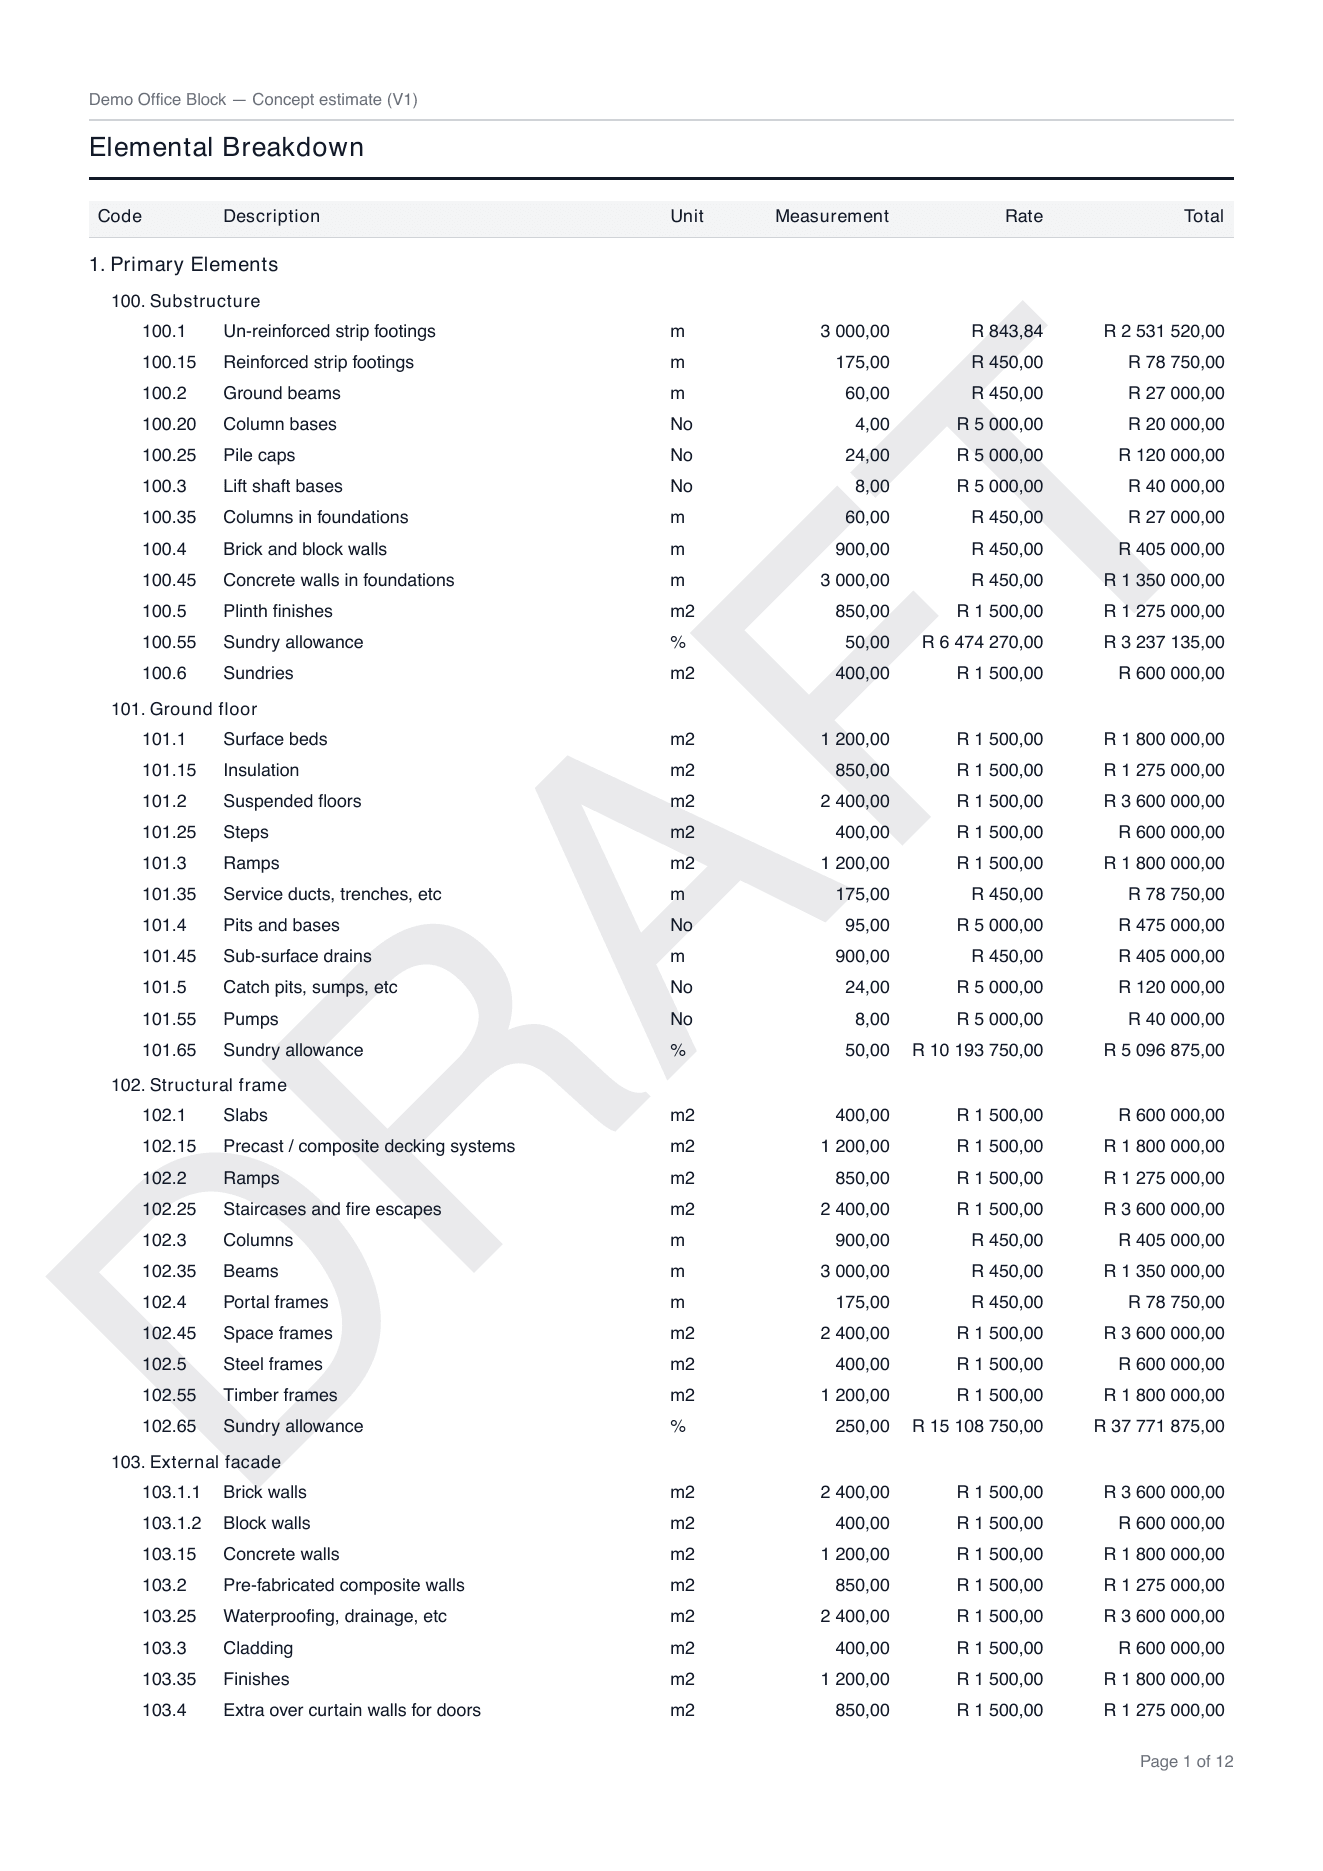
The Generated reports list records whether a report was a draft, and with what word, under its details.
The front page
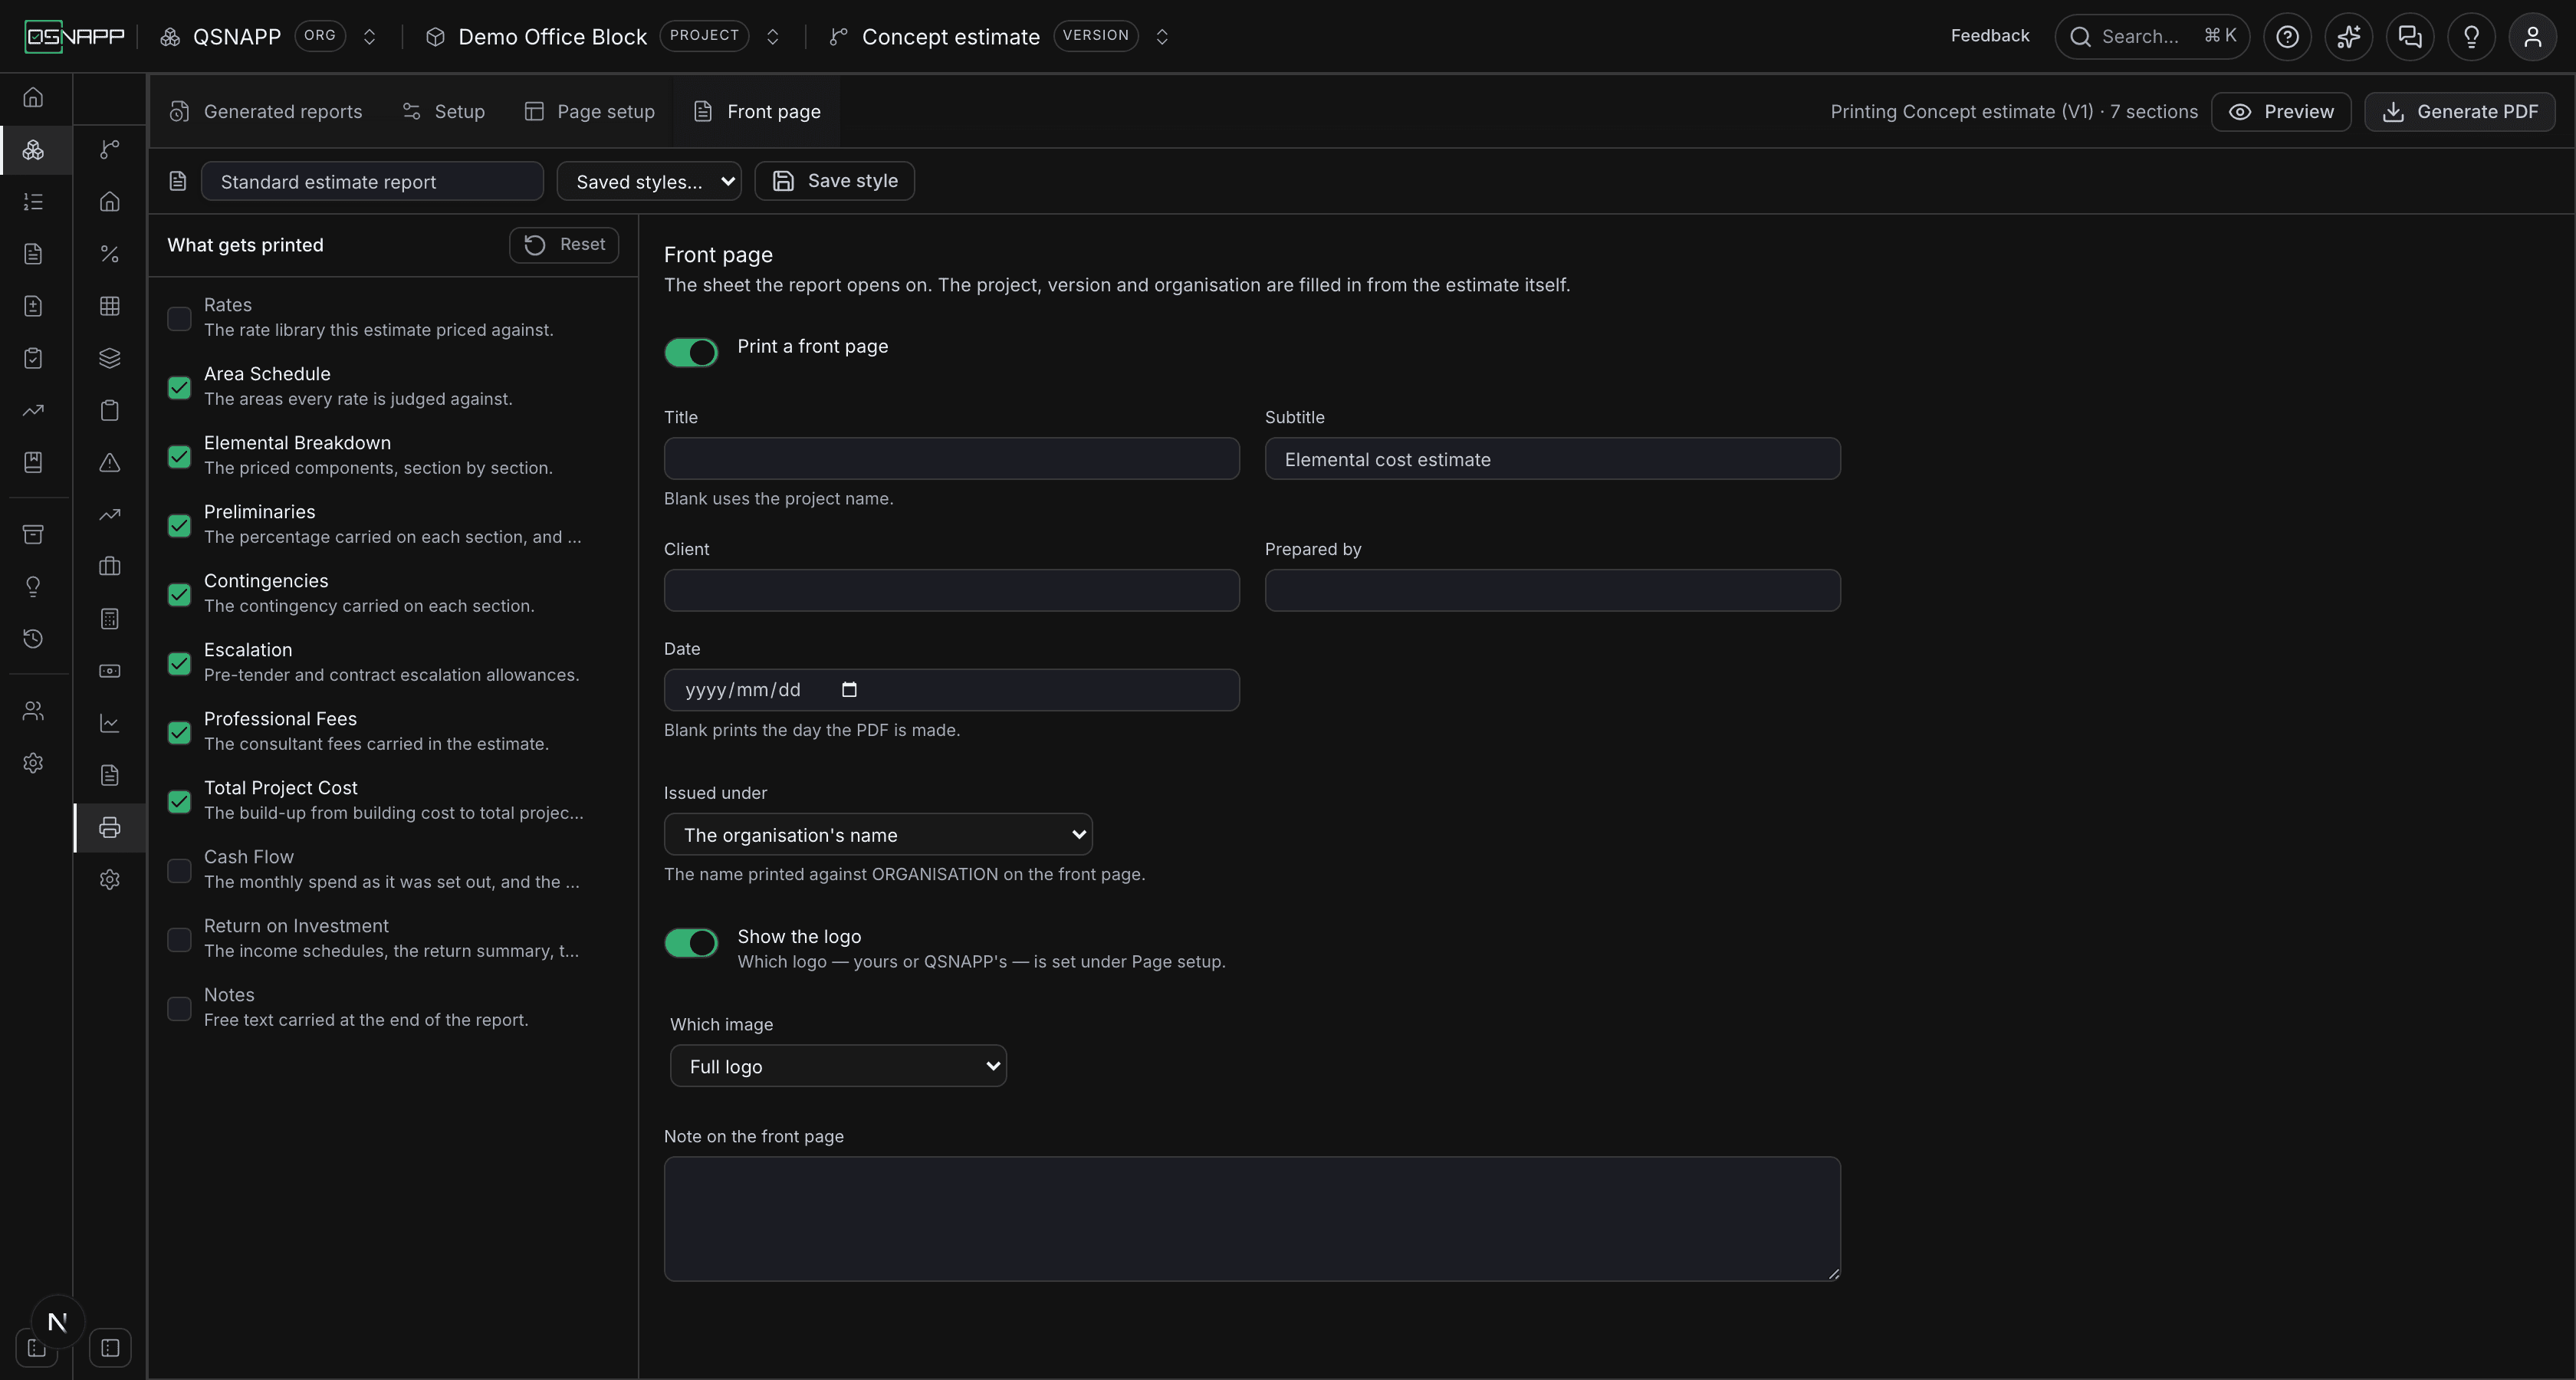
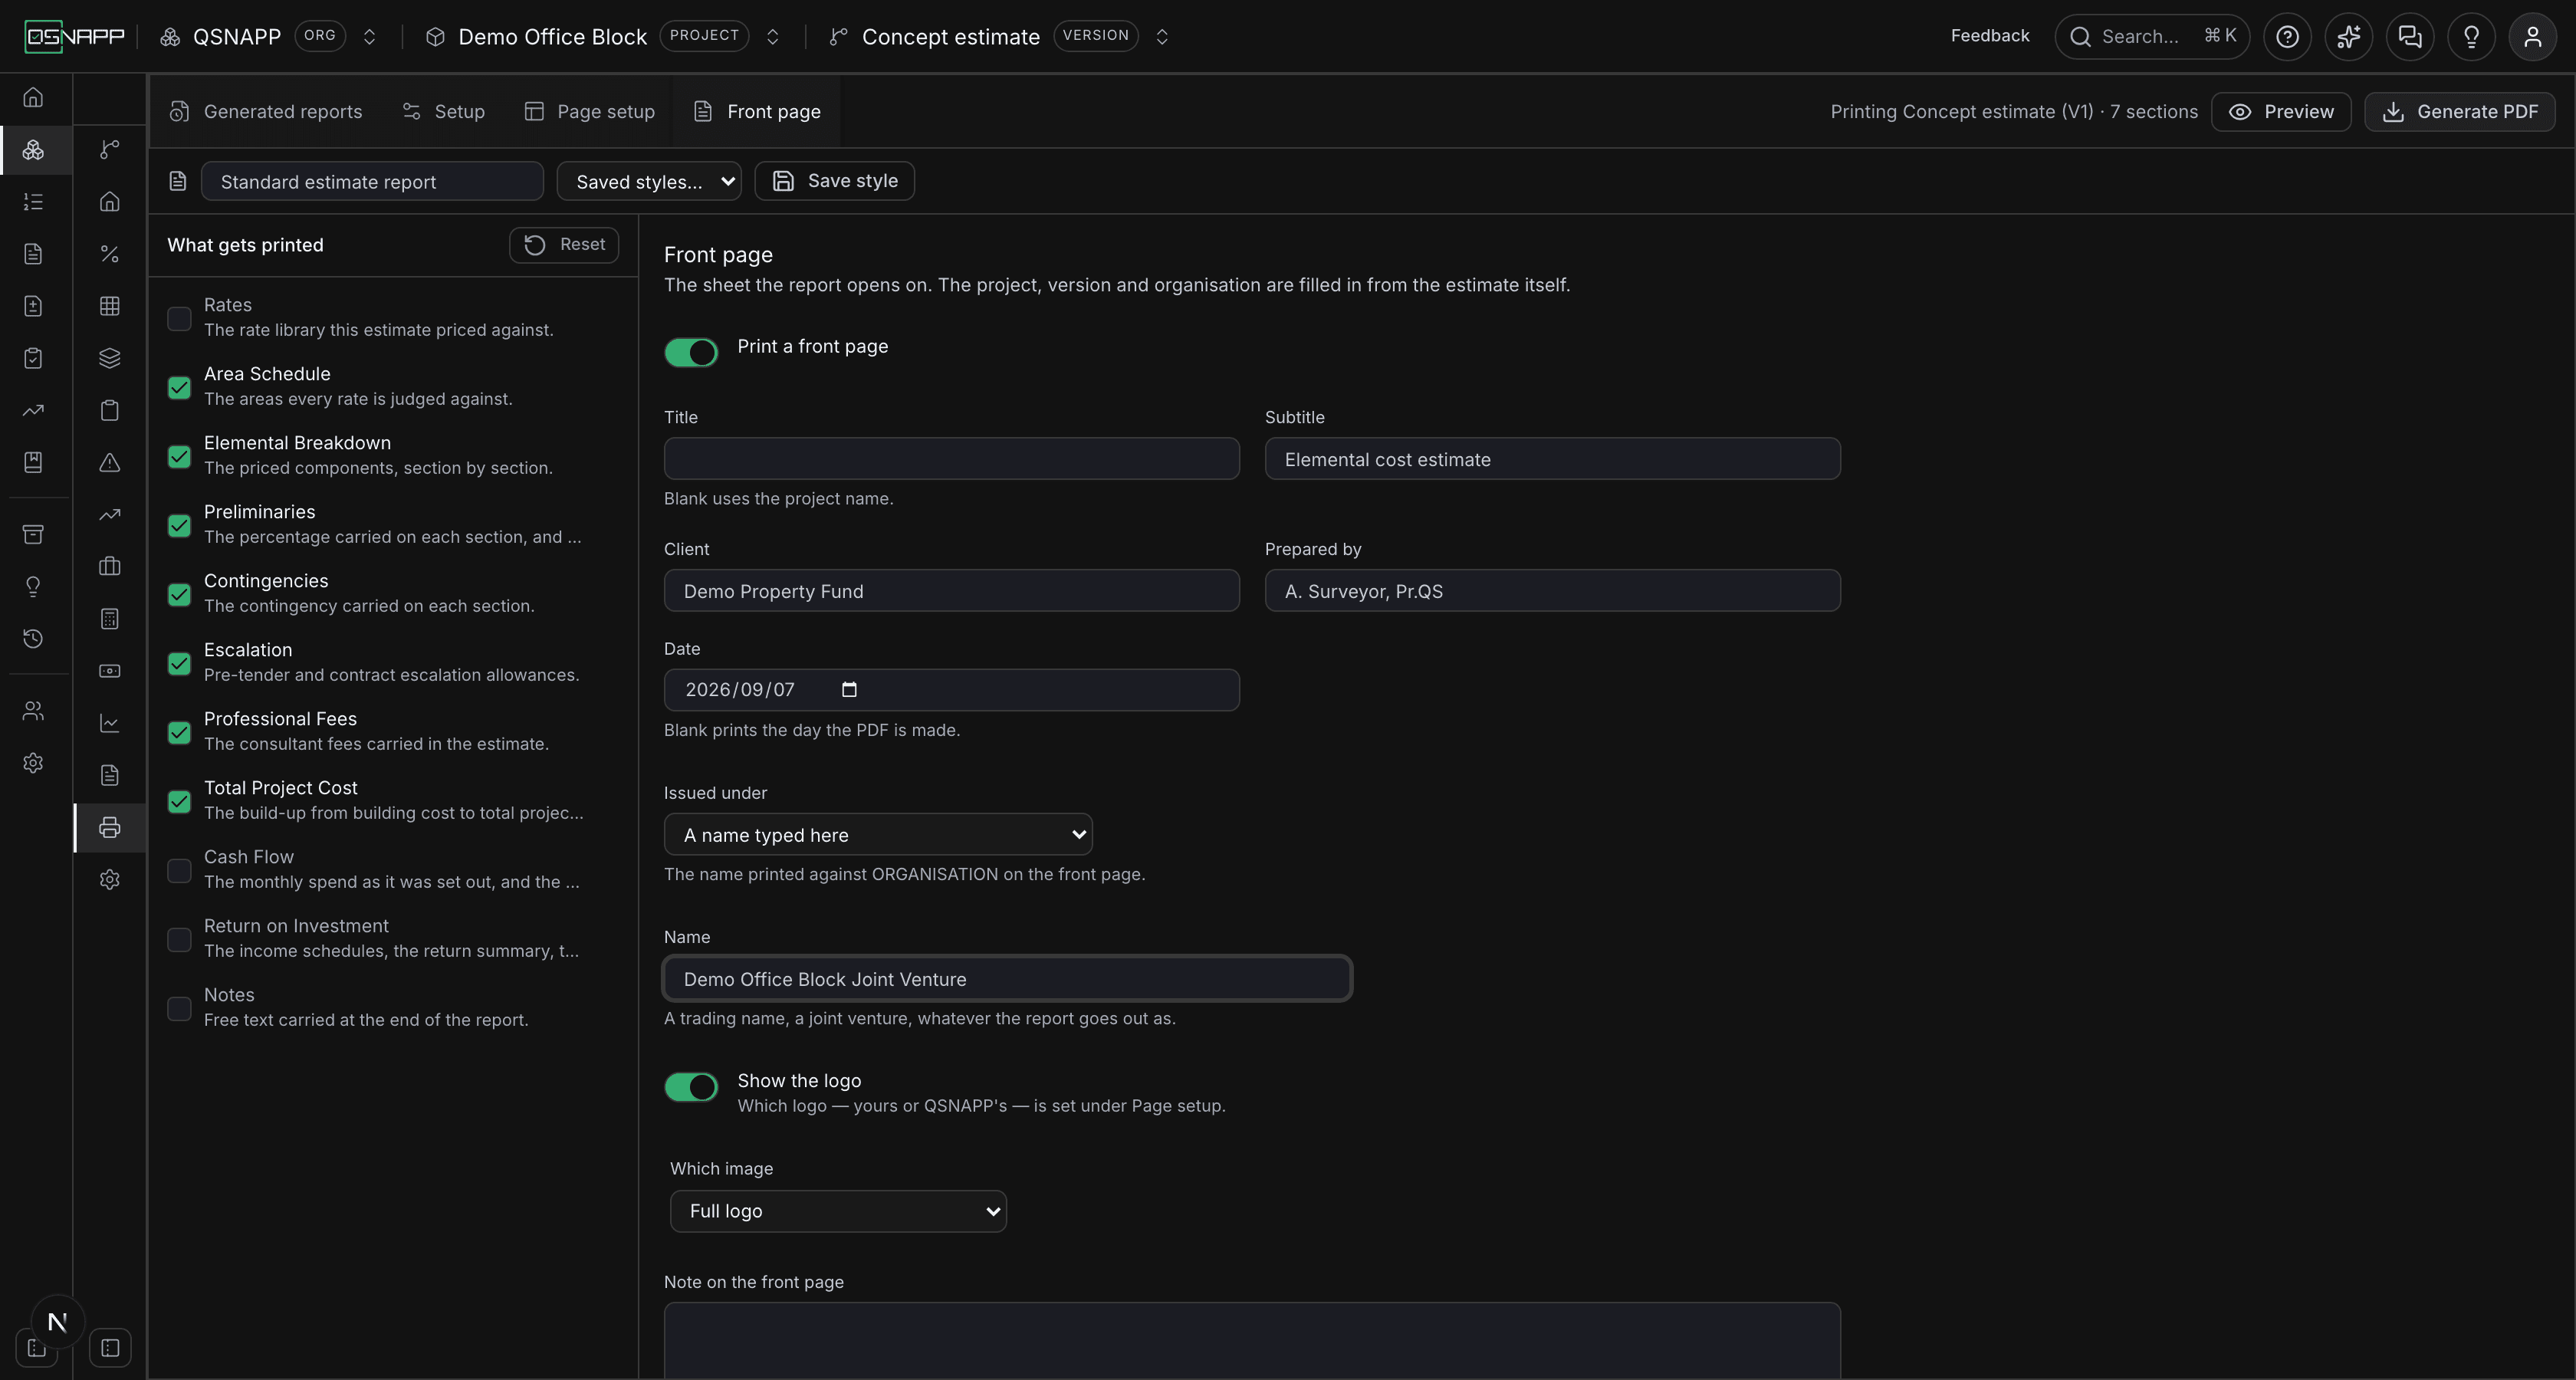
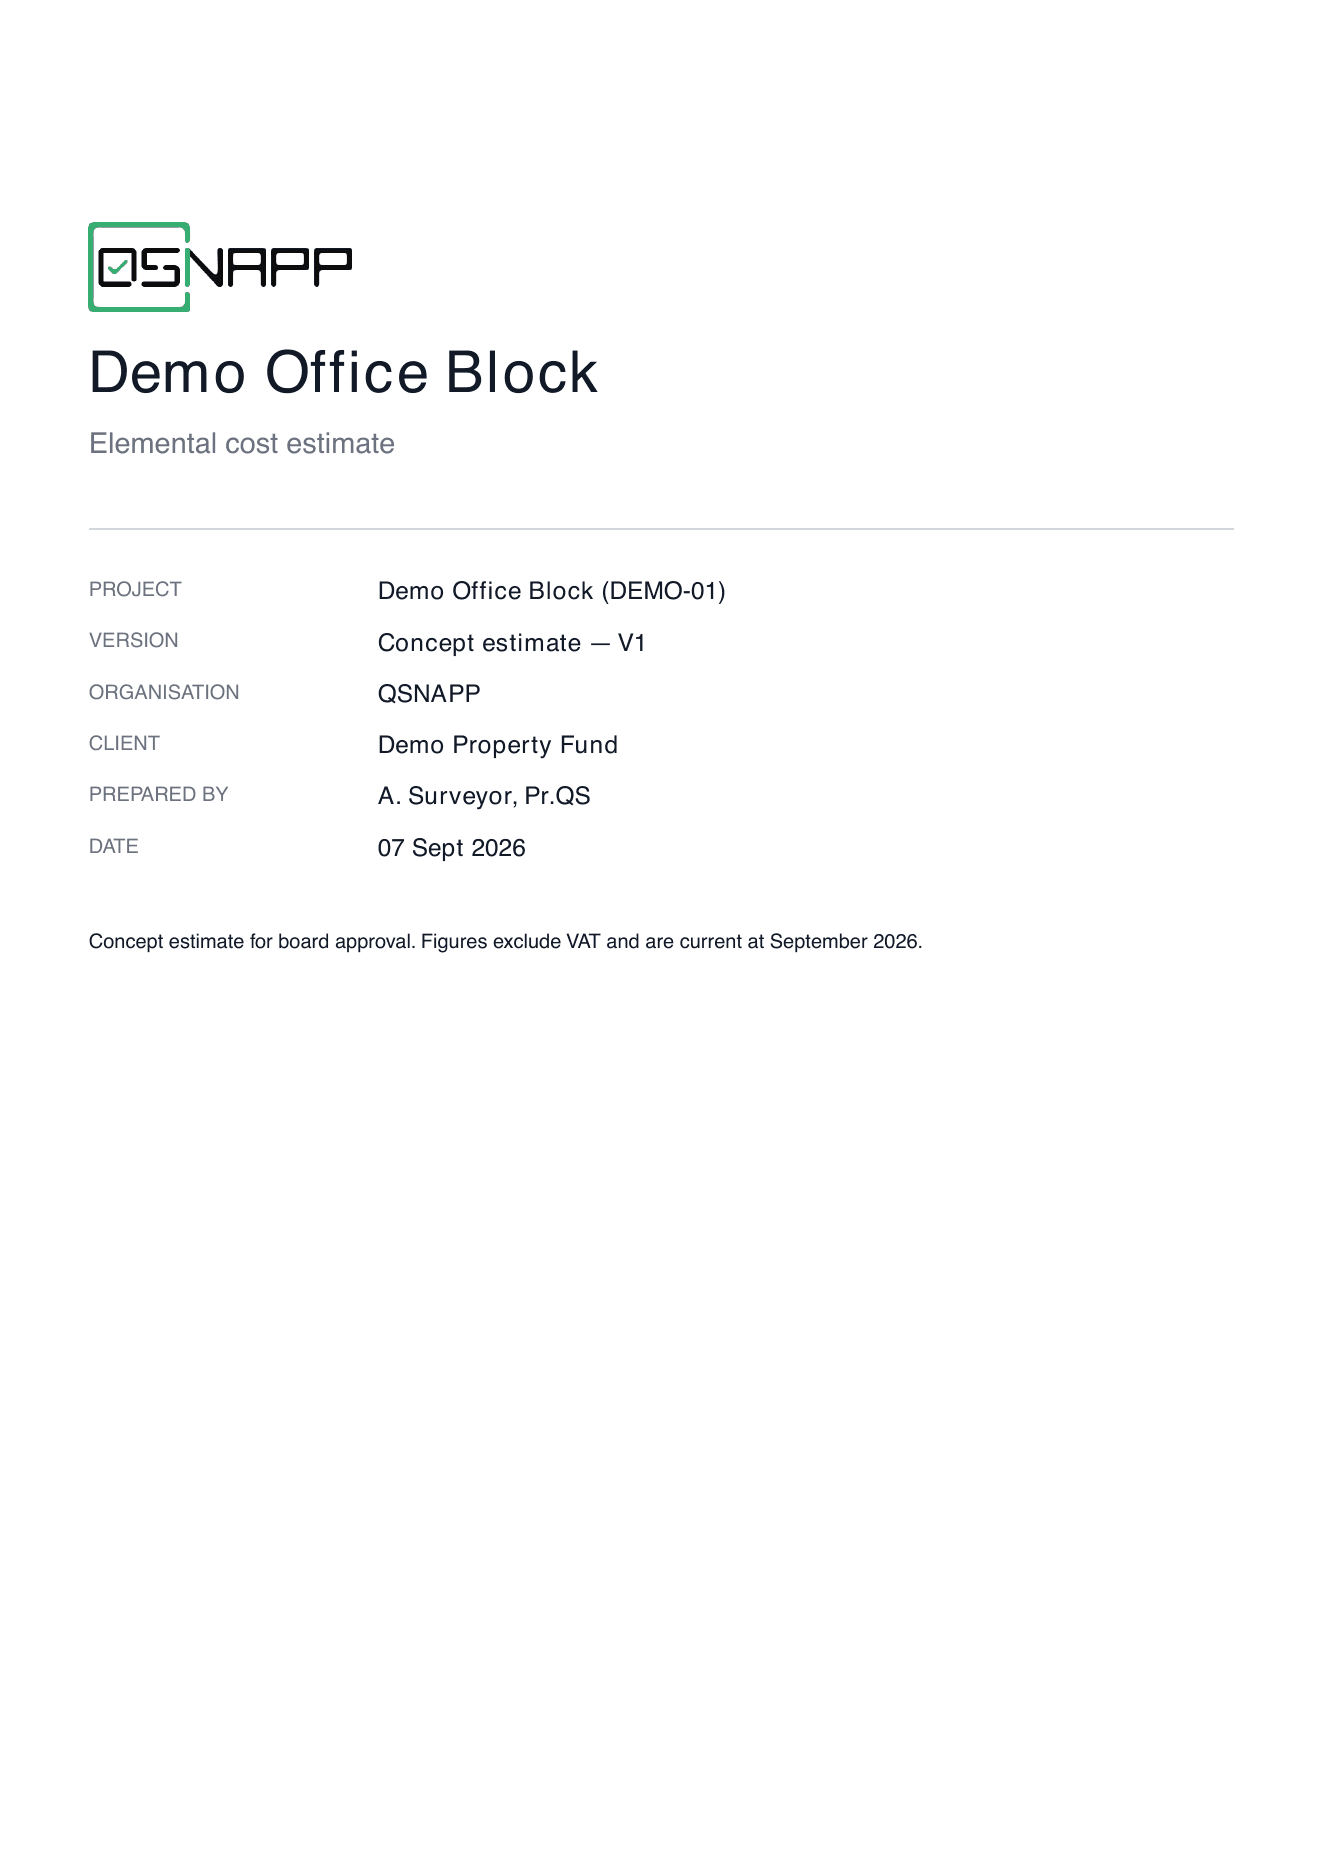
The third tab in the strip, and the sheet the report opens on. It prints, top to bottom: the logo if asked; the title in large type; the subtitle under it; a rule; then a block of labelled lines — Project, Version, Organisation, Client, Prepared by, Date — and the note at the foot. Project and version come from the estimate itself, with their codes; the rest is set here.
| Setting | To start with | What it does |
|---|---|---|
| Print a front page | On | Off, the report opens on its first section and the settings below are hidden. A front page alone, with no sections, is allowed. |
| Title | blank | The large heading. Blank uses the project name. |
| Subtitle | Elemental cost estimate | The line under the title, in grey. Blank prints none. |
| Client | blank | Printed against Client in the block. Blank leaves the line out. |
| Prepared by | blank | Printed against Prepared by — a person, a team, a practice. Blank leaves the line out. |
| Date | blank | The date printed against Date, as 07 Sept 2026. Blank prints the day the PDF is made, so a style saved with it blank is always dated the day it is used. |
| Issued under | The organisation's name | The name printed against Organisation: the organisation's own, from its settings, or A name typed here, which opens a Name field — a trading name, a joint venture, a former name, without renaming the organisation to get it onto one document. A typed name left blank leaves the line out. |
| Show the logo | On | Prints the logo at the top of the front page, 40 pt high. Which logo — yours or QSNAPP's — is set under Page setup, and No logo there overrides this switch. |
| Which image | Full logo | The full logo or the mark. The front page is the one place the full lock-up is usually wanted. |
| Note on the front page | blank | Free text printed under the block, at eight tenths of the width — the basis of the estimate, a covering line, a disclaimer. |
Preview and Generate PDF
Both buttons post the setup as it stands — including changes you have not saved as a style — and both produce the same document. The difference is what happens to it.
Preview opens the PDF in a new browser tab and files nothing. It is a look at the setup, and the way to check a change before issuing it. If your browser blocks the tab, the screen says so and suggests Generate PDF.
Generate PDF downloads the document, named after the project and version — demo-office-block-v1-0-estimate.pdf — and files it under Generated reports at the same time, with the setup that produced it. The document comes back either way: if filing fails, the download still happens and the screen says the PDF downloaded but could not be filed, rather than leaving you to discover an empty history later.
A setup with no sections ticked and no front page is refused with Nothing is selected to print. A front page alone is allowed.
What the screen may say
| Message | What it means |
|---|---|
| Choose an estimate version first. | No version is selected in the header. Pick one; the buttons then enable. |
| Nothing is selected to print. | Every section is unticked and the front page is off. Tick something. |
| Your session has expired. Sign in again. | The sign-in has lapsed. Nothing was generated; sign in and press the button again. |
| Your browser blocked the preview tab. Use Generate PDF instead. | A pop-up blocker stopped the preview tab opening. Allow pop-ups for the site, or download the document. |
| The report could not be generated. | The server could not make the document. The message carries the server's own reason where it gave one; otherwise try again, and if it persists, report it. |
| The PDF downloaded, but it could not be filed under Generated reports. | You have the document, but it is not in the list. The usual cause is an organisation whose trial has ended — see Who can print. |
| This browser would not let the style be saved. | Private browsing, or storage that is full. The setup still prints; only the saving failed. |
Where the figures come from
The report is built on the server from the same tables the screens read, under your own permissions — it cannot show you a project you cannot open. It does not drive the screens and it does not recalculate the estimate; where a rule is more than a sum it calls the same function the screen calls, and otherwise it reads what the screen last saved:
- A component's measurement, rate and total are the stored figures; an element or a section is its components added up.
- Preliminaries and contingencies use the saved percentages, with the same 12% fallback for anything never saved, and contingencies are taken on the section plus its preliminaries. Each section's amount is rounded to the cent before the total is added up, which is why the printed total can differ from the screen's by a cent or two.
- Escalation is worked out row by row with the functions the Escalation tab uses. A consultant's fee is the one Professional fees last saved. Total project cost lines are their stored amounts.
- The area schedule and the return on investment are worked out from their entered cells and formulas, the way their screens do it.
Money prints in the South African convention, R1 234 567,89; other figures to two decimals; dates as 07 Sept 2026. A cell with nothing in it is blank rather than zero.
Generated reports
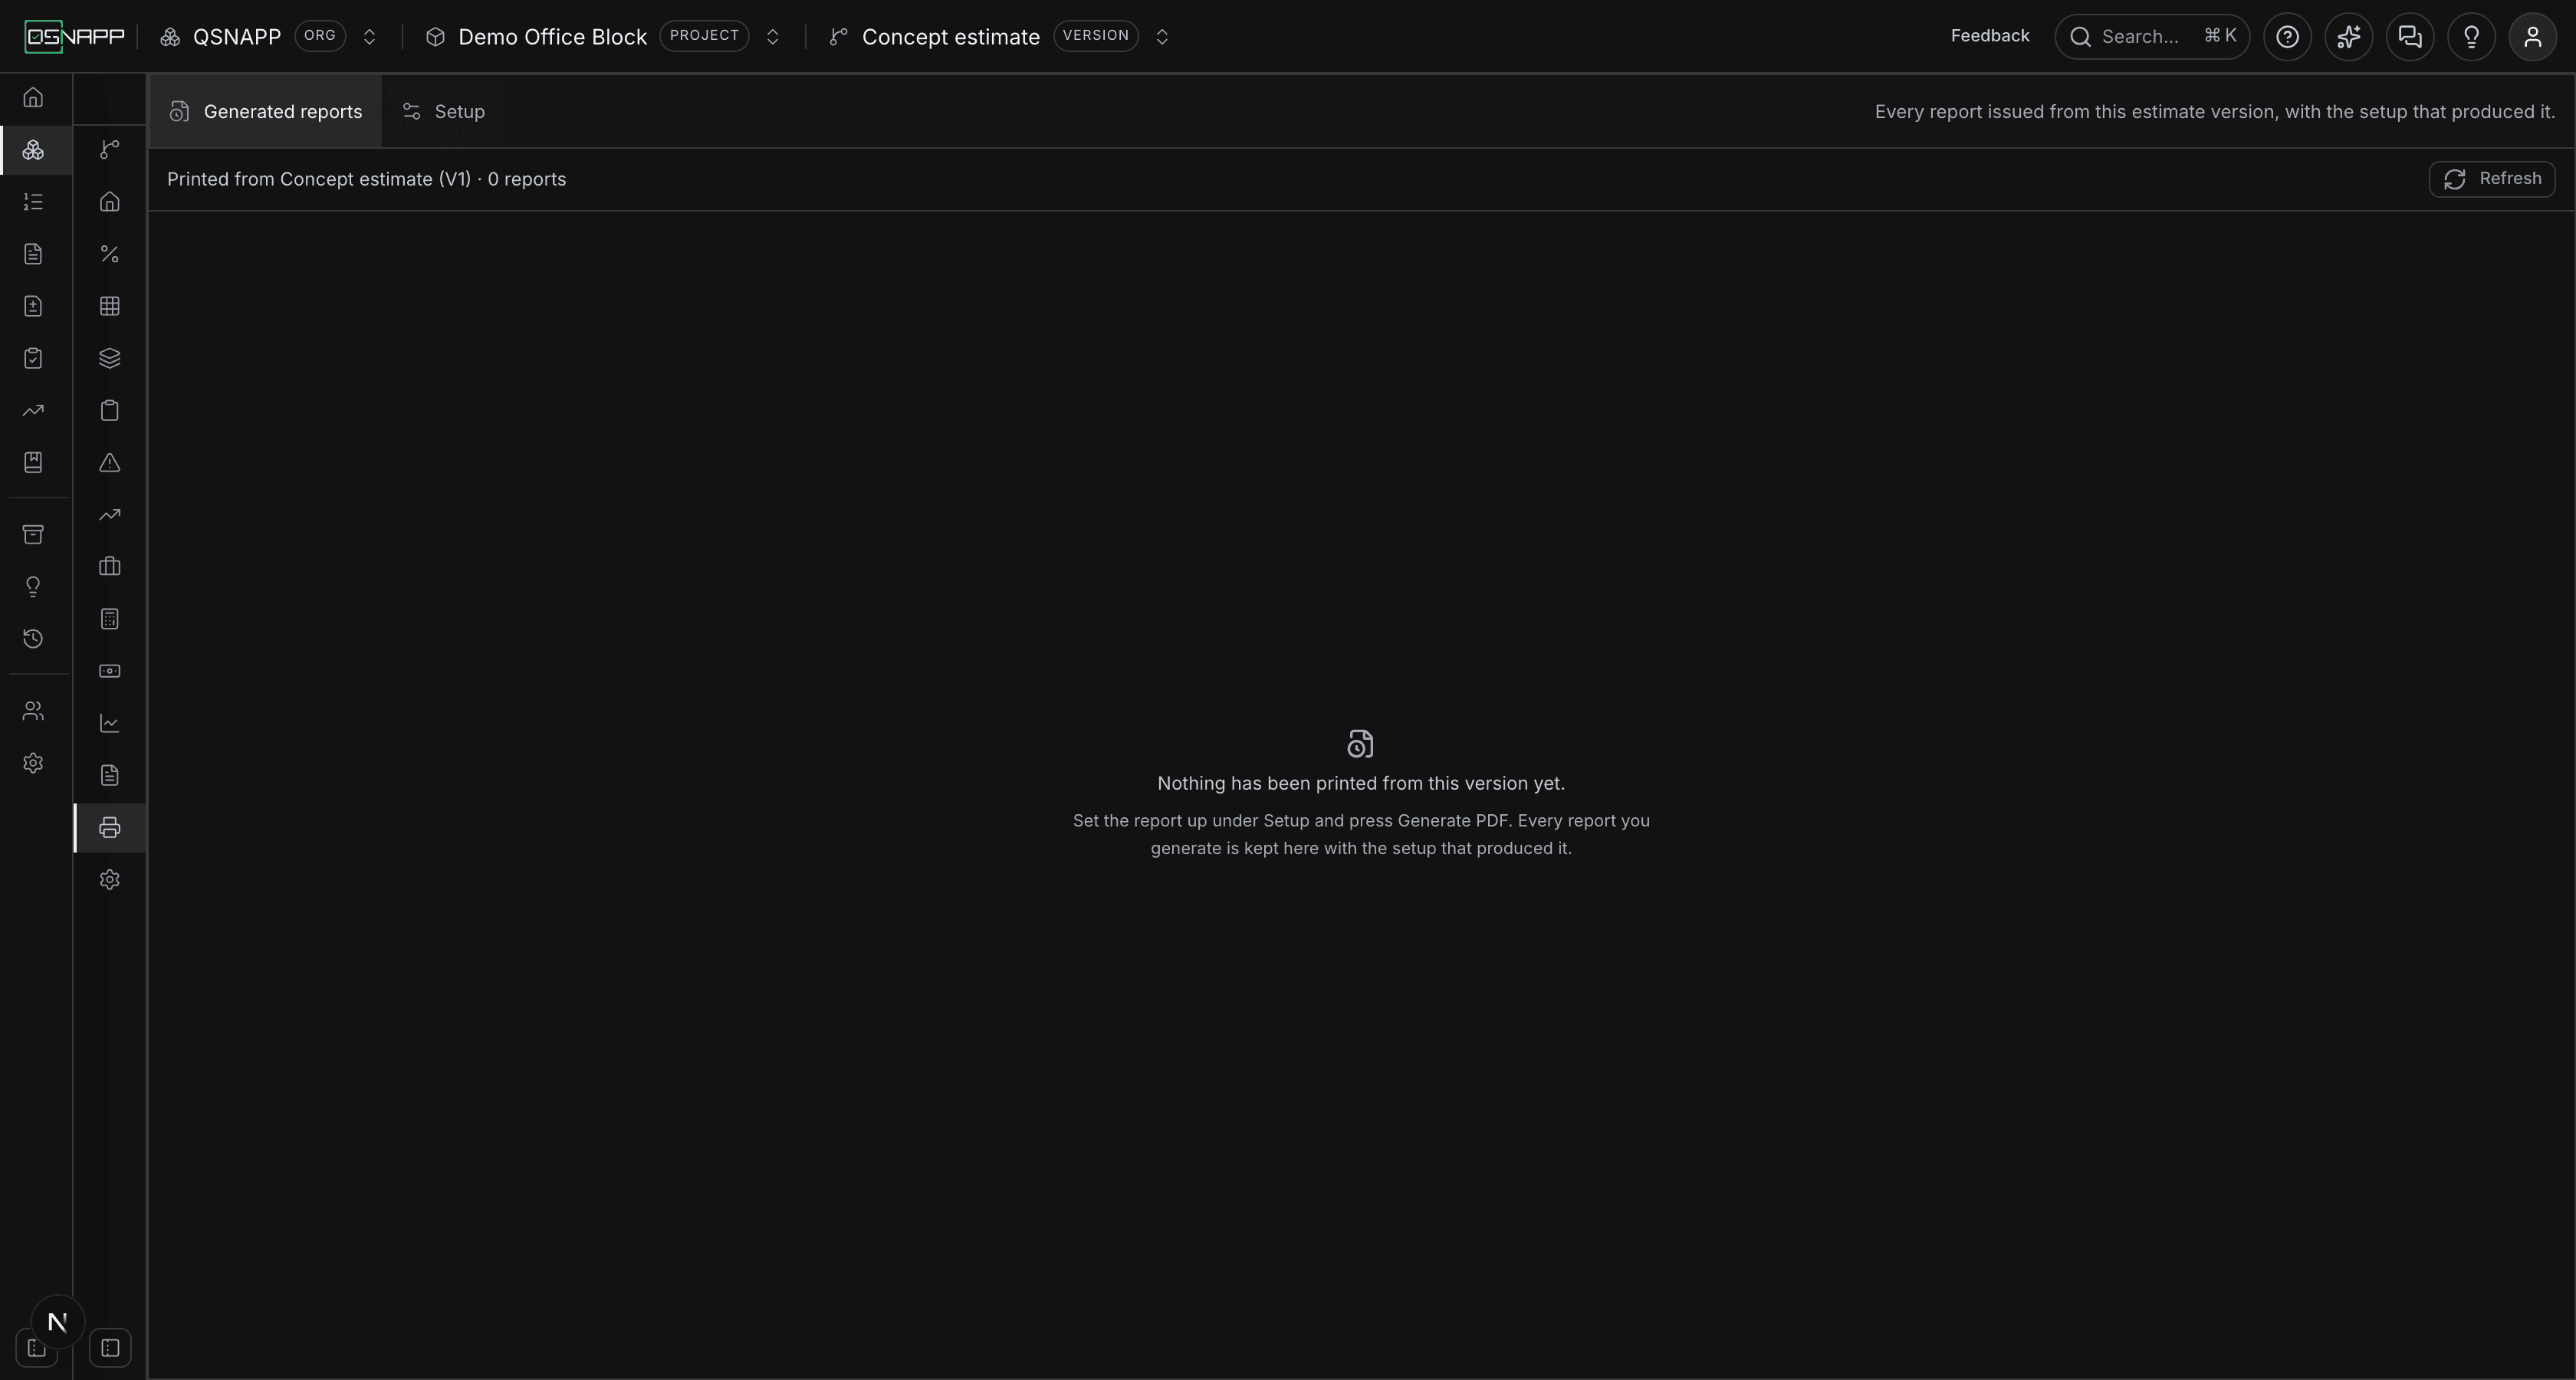
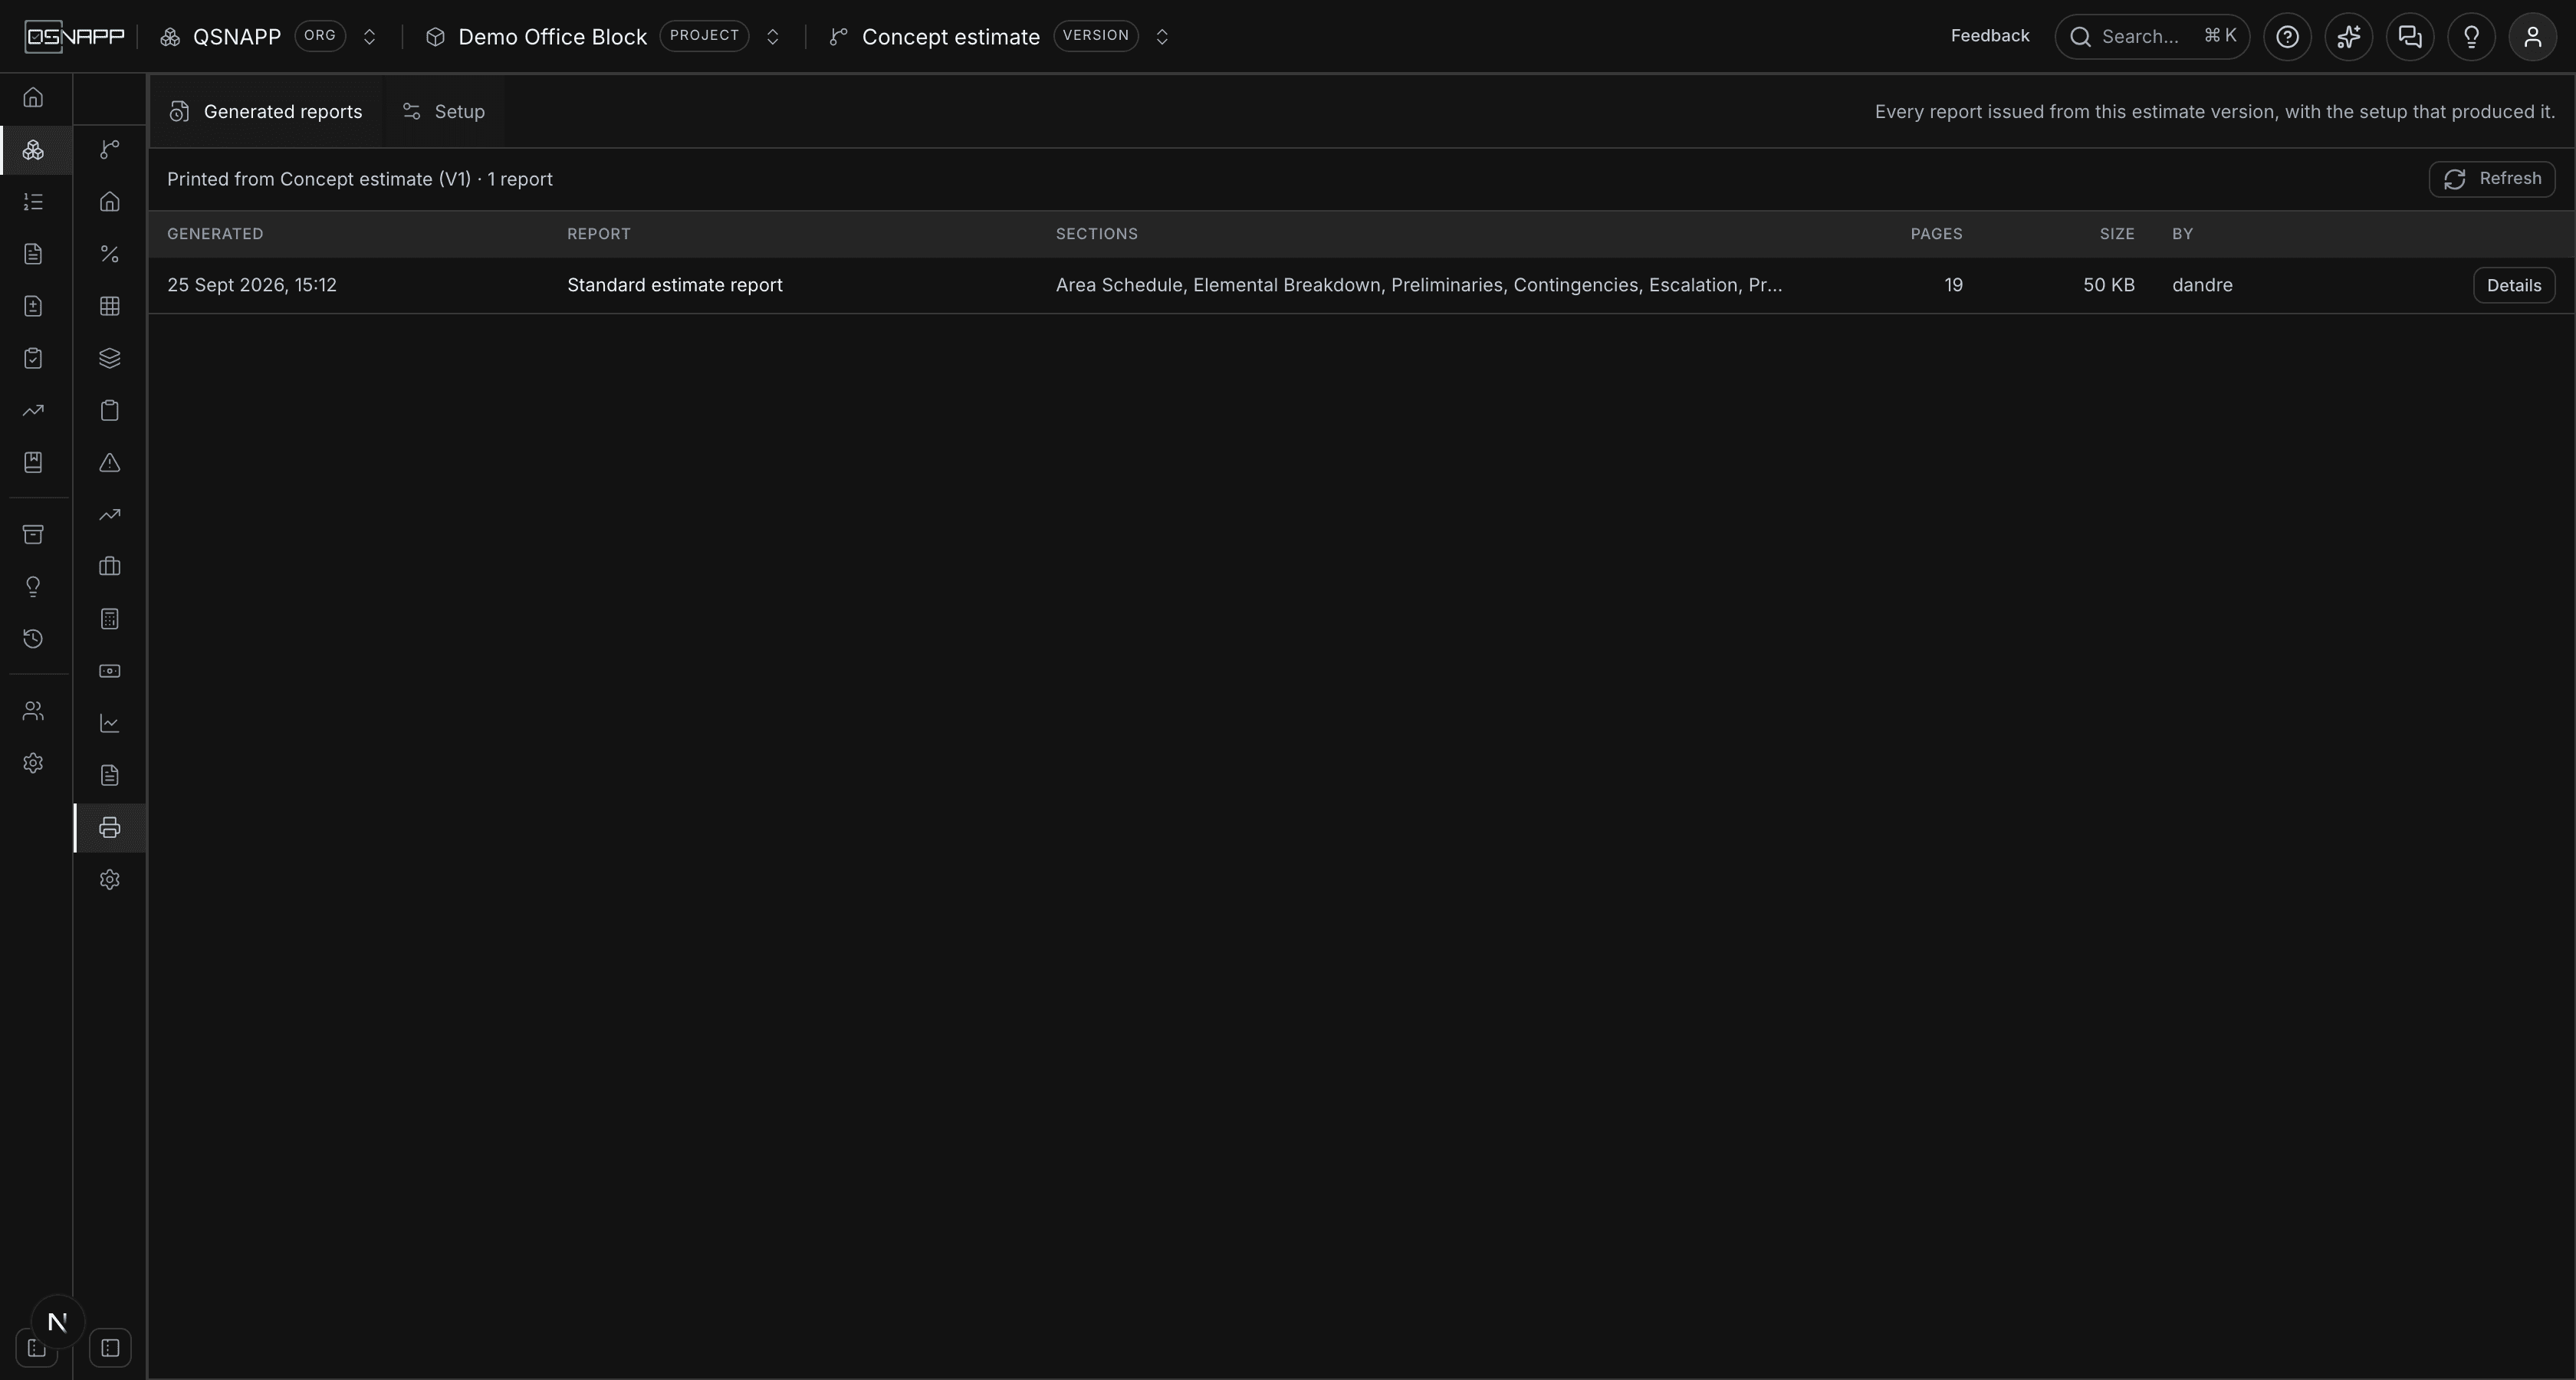
The view the screen opens on. It lists every report generated from the chosen version, newest first, up to the last two hundred. The line above the table says which version and how many; Refresh re-reads the list, though it refreshes itself after every Generate PDF. The columns:
| Column | What it shows |
|---|---|
| Generated | The day and time the document was made. |
| Report | The style name as it stood in the style bar at the time. |
| Sections | The sections it covered, in print order. |
| Pages, Size | How many pages the PDF has, and the size of the file. |
| By | Who pressed Generate PDF. |
| Details | Opens the panel described below. |
The document offered here is the one that was issued, kept as a file, not a fresh render of the same setup. The two differ the moment the estimate moves — re-rendering last month's setup against this month's figures produces a document nobody has ever seen — and the point of the list is the document the client is holding.
The details of a report
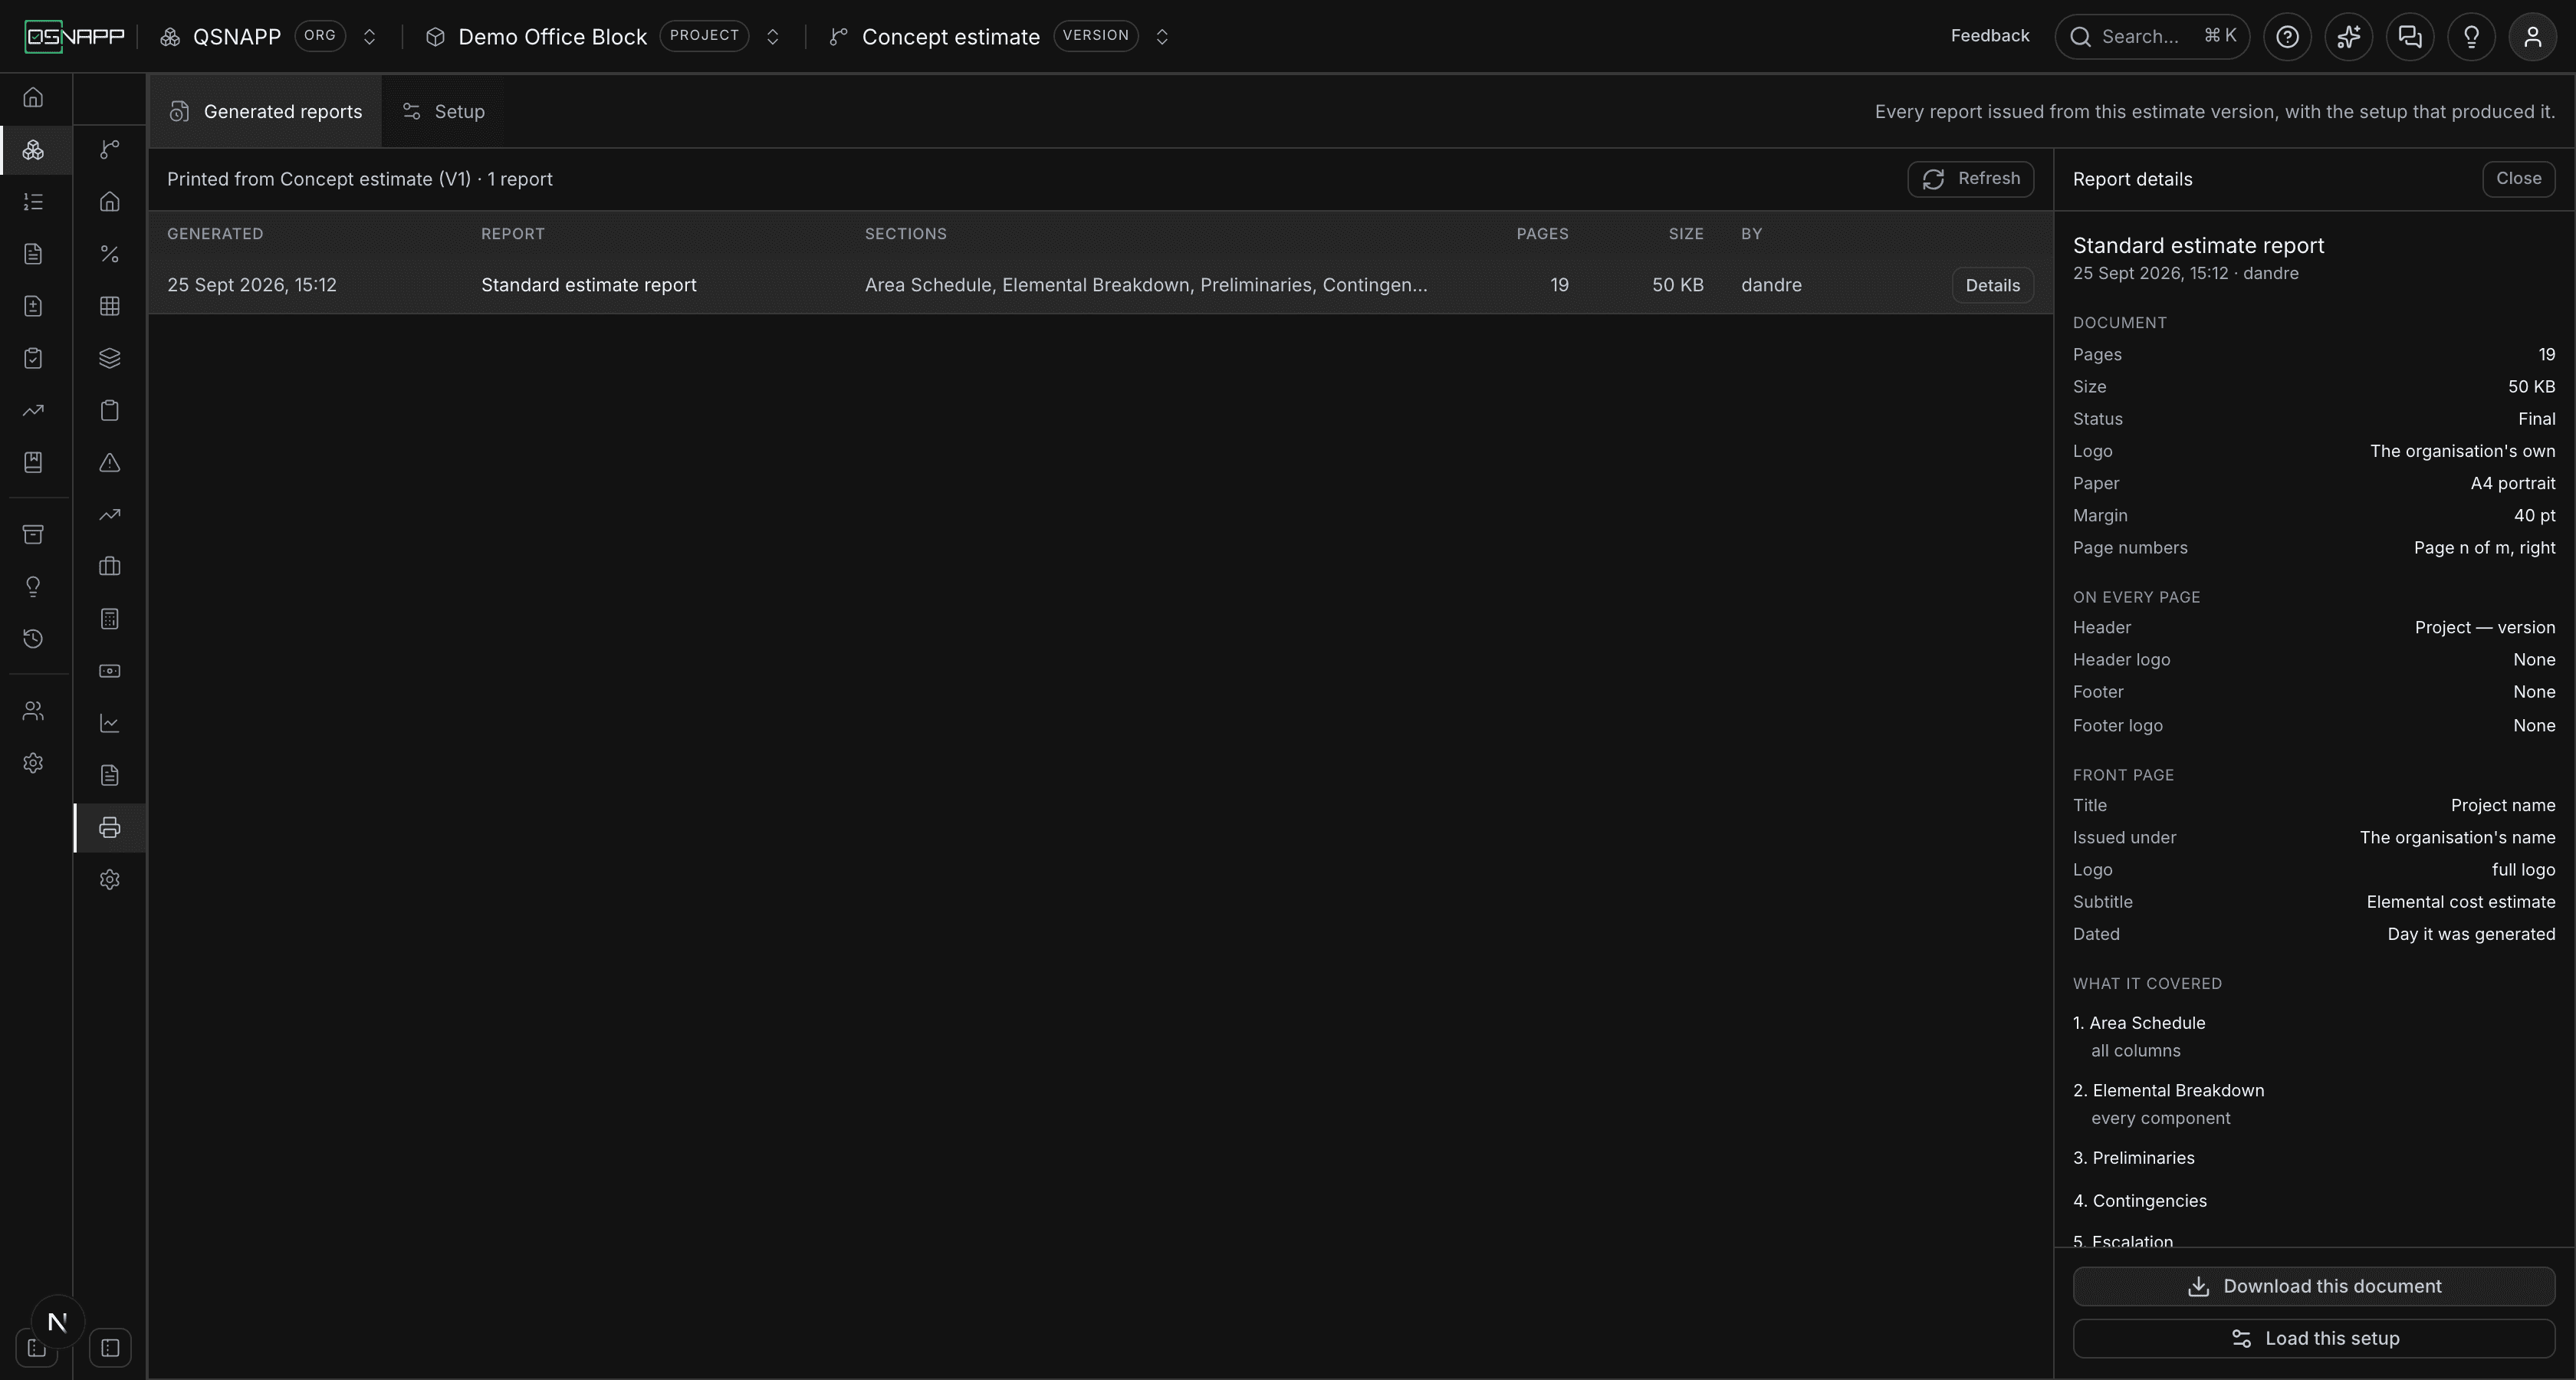
Details on a row opens a panel with the report as it was issued, in five groups:
| Group | What it lists |
|---|---|
| Document | Pages, size, whether it was a draft and with what word, whose logo it carried, the paper and orientation, the margin, and how the pages were numbered. |
| On every page | The header text, where the header logo sat and which image it was, the footer text, and the footer logo. This is what tells two issues of the same style apart — one marked confidential and sent to a bank, one not. |
| Front page | Its title, the name it was issued under, its logo, the subtitle, client and preparer where they were filled in, and its date — or None when the report opened on its first section. |
| What it covered | The sections in the order they printed, each with the choices that made this issue different from another: section totals or every component, with build-up, with constants, monthly summary, with graph, pre-tender only, broken down by stage, active rate sheet, no calculated columns, landscape, runs on from the section before. A section printed at its defaults says nothing. |
| Left out | The sections that were unticked, if any. |
At the foot of the panel: Download this document, which hands over the stored PDF under the style name and the date it was generated — standard-estimate-report-2026-09-07.pdf — and Load this setup, which puts that report's setup into the builder, with its name, and switches to Setup, so a new report can be issued from exactly the setup of an old one. Close shuts the panel.
What is remembered, and where
Three things are kept, in three places, and it is worth knowing which is which:
- The setup you are working on is remembered in this browser, per project, as you change it. Leave the tab and come back and it reopens where you left it. It is not shared with anybody, and it is not the setup on another machine.
- Saved styles are also kept in this browser — see below.
- Generated reports are kept in the database, with the PDF in private storage, and are what everyone on the project sees.
A setup is versioned — it is at version 3 today — and one stored earlier is brought up to date when it is read: sections or columns the report no longer has are dropped, sections it has gained are added switched off, and your order and choices survive. Older setups that stored a fixed column list for the area schedule or the income schedules are read as “every column”, because the list they stored names columns that no longer exist and honouring it printed the places with no figures against them.
Saved styles
A style is a setup with a name: Standard estimate report, Board summary, Bank draft. To make one:
- Set the report up — sections, columns, options, page, front page.
- Type a name in the style bar and press Save style.
- Later, choose it from Saved styles… to load it. Change it and press Save to write over it, or Save as new to keep both.
Styles are kept in this browser only. They are not yet shared across the organisation, so a colleague does not see the style you saved, and a browser in private mode may refuse to save one at all — the screen says so, and the report still prints. The setup of any report already generated is in Generated reports, which is shared, and can be loaded from there with Load this setup — which is the way to pass a setup to a colleague today.
Who can print
Generating a report needs permission to view the project — reading the estimate is what a report does, and someone who may see the figures may take them away on paper. The same permission reads the list of generated reports and downloads the documents. Nothing here needs permission to update the project.
A generated report is a record of something issued, and it is not edited afterwards: there is no way to change one from the screen, and the database has no update rule for the table. Deleting one would need permission to update the project, and the screen offers no control for it.
An organisation whose trial has ended is read-only, and filing a report is a write. The report is still generated and downloaded — an expired trial can still take its estimate away on paper — but it is not added to Generated reports, and the screen says so.