Escalation
An estimate is priced at today's rates, and the building is paid for over the next two years. Escalation is the allowance for the difference: what the works are expected to cost by the time they are tendered and then built, rather than at the date they were measured.
What the tab is for
The elemental breakdown, the preliminaries and the contingencies together give a figure for the works at the base date of the estimate. Nobody pays that figure. The tender comes in months later, at the prices of that day, and the contract then runs for a year or two more during which the contractor is compensated for price movement under the contract price adjustment provisions. An estimate that stopped at the base date would be understated by both.
This tab holds the two allowances that close that gap. Each is a table of rows you type — an amount, two dates, two index readings and a rate per annum — and each row's escalation is worked out from those. The totals at the foot are what the Professional fees tab charges the fee scale against, and the Escalation section of the printed estimate.
Escalation belongs to one estimate version. A new version starts with no rows.
Two allowances, not one
The AAQS Guide to Elemental Cost Estimating splits escalation in two because they are different things, running over different periods and predicted from different indices:
- Pre-tender escalation runs from the base date of the estimate to the tender date. It is what the tender is expected to come in at, over and above the estimate. The published tender price index is the measure of it.
- Contract (post-tender) escalation runs from the tender date to construction completion. It is the contract price adjustment the client will pay over the contract period — a provisional sum, not an invoiced amount. The building cost index is the measure of it.
So the screen is two tables rather than one with a switch, and the arithmetic differs between them: pre-tender takes the larger of two predictions and rounds to cents; contract escalation pro-rates a rate over the period, scales it by the index and rounds to the nearest hundred rand. Both are set out below.
How the screen is laid out
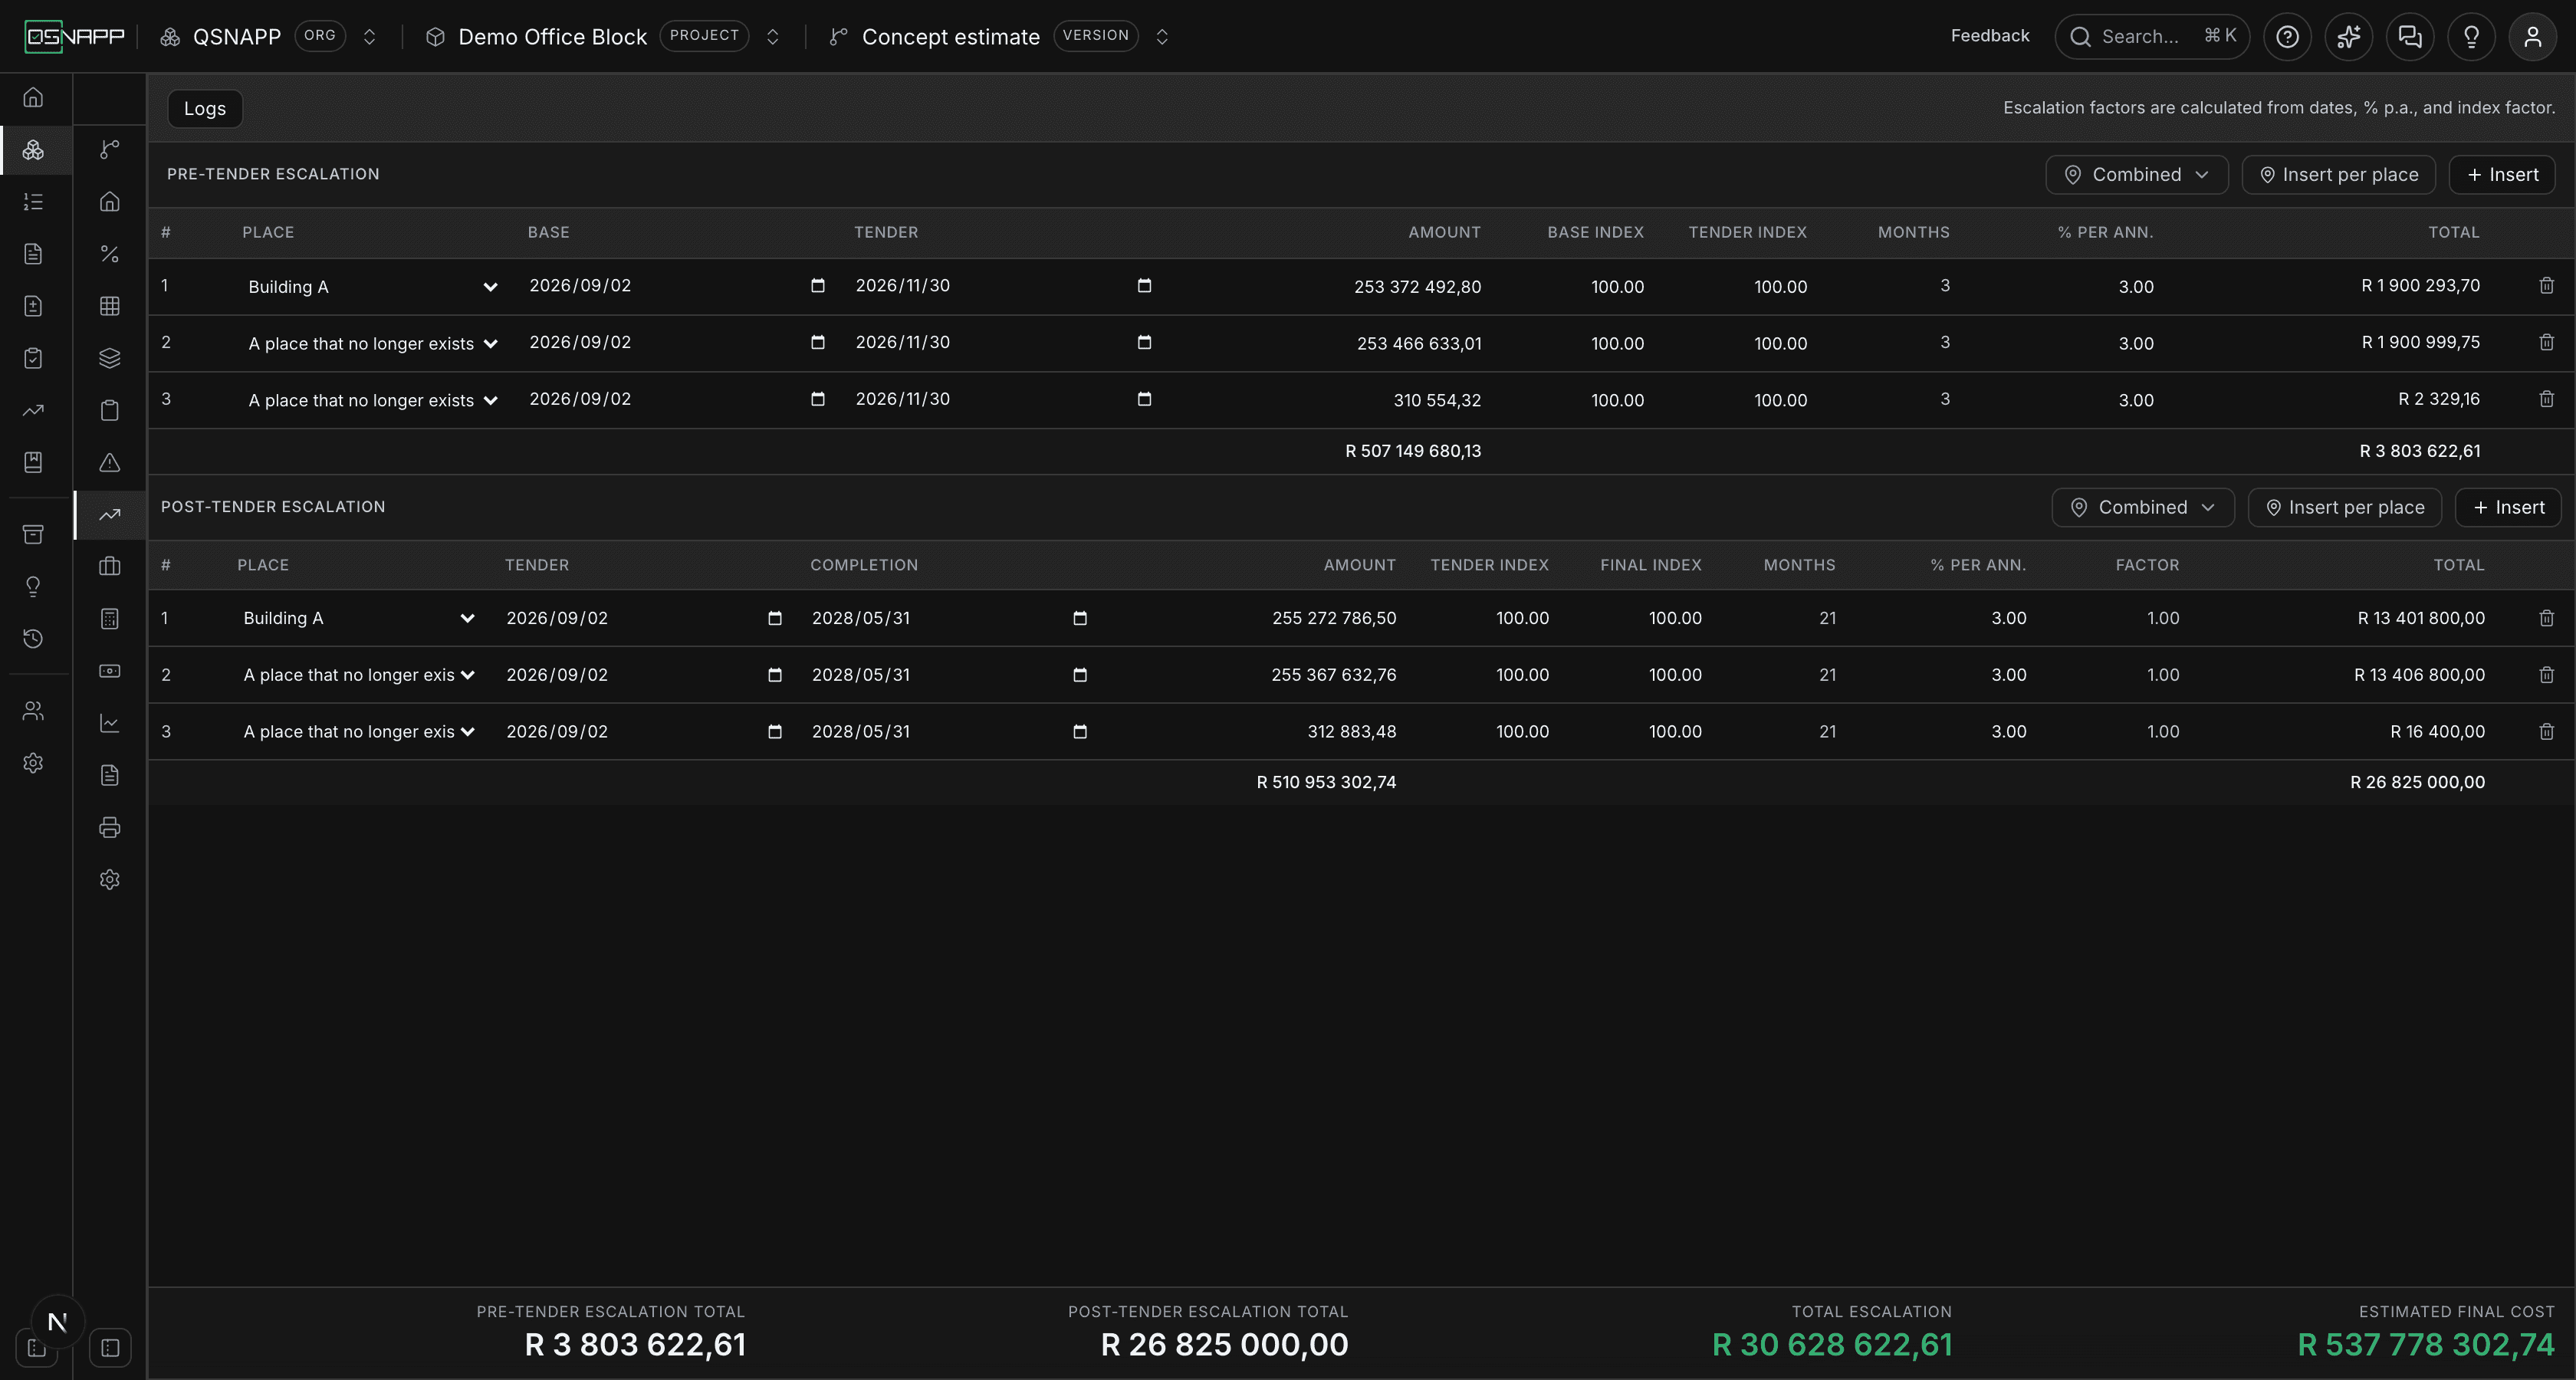
The toolbar carries Logs, and — only once something has been changed — Save changes and Discard. The note at its right end says what the tab does in one line: the escalation is calculated from the dates, the percentage per annum and the index factor.
Below it, Pre-Tender Escalation and Post-Tender Escalation each have a heading with an Insert button, and — when the estimate is measured in places — a place filter and Insert per place. Each table ends in a subtotal row. The four figures at the foot are worked out from both tables together.
The columns are sized to what they hold, so both tables fit the pane without a horizontal scrollbar; on a narrower window they compress rather than running off the edge, so the Total column and the row you are reading are always on screen together.
Pre-tender escalation
The columns
| Column | What it holds |
|---|---|
# | The row's position in the table. Rows keep the order they were inserted in. |
Place | Which place this row is for — Whole project, or one of the places the estimate is measured in. Only shown when the estimate uses places. See Reading by place. |
Base | The base date of the estimate: the date its rates are current at. |
Tender | The expected tender date. |
Amount | The figure being escalated. Seeded when the row is inserted; typed thereafter. See What the amount is. |
Base Index | The tender price index at the base date. Starts at 100,00. |
Tender Index | The tender price index expected at the tender date. Starts at 100,00. |
Months | Whole months from Base to Tender. Worked out, not typed — see How months are counted. |
% Per Ann. | The rate of escalation per annum. Starts at 3,00. |
Total | The escalation on this row. Not editable — it is worked out from the cells beside it. |
The bin at the end of the row removes it. Like every other edit on this screen, that is a draft until you save.
How a row is worked out
Two predictions of the same inflation are available on a pre-tender row. One is the movement in the tender price index between the base date and the tender date. The other is the flat rate per annum, applied over the months between the two dates. The row takes whichever is larger, and applies it to the amount:
index route   Tender index ÷ Base index − 1
time route    % per annum ÷ 100 × Months ÷ 12
Total         Amount × the larger of the two, rounded to cents
Taking the larger is deliberate. An index that has not moved yet — or that you have left at 100,00 because you have no better figure — must not wipe out the time-based allowance; and a rate you have set low must not hide an index that has already risen past it. A falling index never produces a negative allowance for the same reason: the time route is still there to be taken.
Two gates come before either route. If Months is nought — the same date twice, a tender date before the base date, or a date left blank — the total is nought. If the rate per annum is nought, the total is nought even when the index has moved. And a base index of nought disables the index route rather than dividing by it (the database will not hold one in any case: both indices must be above zero).
Worked through. R10 000 000 over twelve months at 5% per annum, with the index at 159,50 at base date and 174,00 expected at tender:
index route   174,00 ÷ 159,50 − 1  = 9,09%
time route    5 ÷ 100 × 12 ÷ 12    = 5,00%
Total         R10 000 000 × 9,09%  = R909 090,91   (the index wins)
The same amount over eight months at 6%, with both indices left at 100,00:
index route   100,00 ÷ 100,00 − 1  = 0
time route    6 ÷ 100 × 8 ÷ 12     = 4,00%
Total         R10 000 000 × 4,00%  = R400 000,00   (the time route wins)
Each row is rounded to cents on its own, so the totals you read down the column add up to the subtotal exactly.
Contract escalation
The lower table. The product calls it post-tender escalation on screen and contract escalation in print; they are the same thing.
The columns
| Column | What it holds |
|---|---|
#, Place | As above. |
Tender | The tender date — where the pre-tender row left off. |
Completion | The expected date of construction completion. |
Amount | The figure being escalated over the contract. Seeded with the pre-tender amounts plus the pre-tender escalation — the expected tender sum — and typed thereafter. |
Tender Index | The building cost index at tender date. Starts at 100,00. |
Final Index | The building cost index expected at completion. Starts at 100,00. |
Months | Whole months from Tender to Completion. Worked out, not typed. |
% Per Ann. | The rate of escalation per annum. Starts at 3,00. |
Factor | Final index ÷ Tender index, to two decimals. Worked out, not typed. |
Total | The escalation on this row, to the nearest R100. |
How a row is worked out
Contract escalation does not choose between two routes; it uses both at once. The rate per annum is pro-rated over the months of the contract, and the result is scaled by the movement in the building cost index:
Factor   Final index ÷ Tender index          (1 when the tender index is nought)
Total    Amount × % per annum × Months × Factor ÷ 1 200, rounded to the nearest R100
Dividing by 1 200 is the percentage and the twelve months of the year in one step: it is ÷ 100 ÷ 12. The rounding to R100 is the convention for a contract escalation allowance, which is a provisional sum in the estimate and not a figure anyone will be invoiced. A half-hundred rounds up.
The total is nought when Months is nought, when the rate is nought, or when the amount is nought or less — a negative contract sum yields nothing rather than a credit.
Worked through. R10 000 000 over an eighteen-month contract at 6% per annum, with the index at 100,00 at tender and 105,00 expected at completion:
Factor   105,00 ÷ 100,00                          = 1,05
Total    R10 000 000 × 6 × 18 × 1,05 ÷ 1 200    = R945 000,00
With both indices left at 100,00 the factor is 1 and the same row comes to R900 000,00. And the rounding, on a small row: R100 000 for one month at 6,7% is R558,33 by the formula, and shows as R600,00.
How months are counted
Both tables count the period between their two dates the way the spreadsheet this module was ported from did, so figures captured there and here agree. The days are counted on a 30/360 basis — Excel's DAYS360 — and then quantised to whole months:
days     30/360 day count: the 31st of a month reads as the 30th; February is not stretched
months   days ÷ 30, taken up to the next tenth, then down to the nearest half, then to the nearest whole
In practice: a period of thirteen days or more counts as a month, twelve days or fewer does not. Forty-four days is two months. 2 September to 30 November is 88 days, which is three months; 2 September 2026 to 31 May 2028 is 628 days, which is twenty-one. A period ending on 28 February is two or three days short of a whole month, because February is not extended to thirty days.
Dates the wrong way round give nought months, not a negative period. A completion date entered before the tender date yields no escalation rather than a credit.
What the amount is
Escalation is a percentage of something, and what that something is decides the figure. On this tab the amount is a column you type — but Insert does not leave it blank.
A new pre-tenderrow is seeded with the base estimate: every component in the elemental breakdown added up by section, with each section's preliminaries percentage applied and then its contingencies percentage applied on top of that. That is the same figure, fetched the same way, that the Preliminaries and Contingencies tabs arrive at, and it is what the estimate is worth at the base date. Professional fees are not in it: the fees are charged on the escalated figure, not escalated themselves. A section with no percentage set on either tab is taken at 12%, as those tabs take it.
A new post-tenderrow is seeded with the pre-tender table's amount subtotal plus its escalation subtotal — the sum the tender is expected to come in at, which is the sum the contract will then escalate.
The seed is taken once, when the row is inserted. The amount does not follow the elemental breakdown afterwards: reprice the works and the row keeps the figure it was inserted with, which is what lets an escalation be agreed and left alone. If the estimate has moved, retype the amount or insert a fresh row.
Amounts, indices and rates accept a comma or a point as the decimal, and thousands may be grouped or not. On leaving the cell the amount is shown grouped in the South African way — 253 372 492,80 — and the indices and rate to two decimals. Anything that is not a number is read as nought.
Subtotals and the four figures
Each table ends in a row that adds up its Amount and Total columns. The four figures at the foot of the screen are:
- Pre-Tender Escalation Total — the pre-tender Total column added up.
- Post-Tender Escalation Total — the post-tender Total column added up.
- Total Escalation — the two together.
- Estimated Final Cost — the pre-tender Amount subtotal, plus the pre-tender escalation, plus the contract escalation. The post-tender amounts are not added in: they already carry the pre-tender amounts and their escalation, so adding them would count the works twice.
The subtotals and the four figures are always the whole version's, whatever the place filter is showing. A filter is a way of reading the tables, not a different estimate.
Reading by place
Buildings escalate over different periods. Building A tenders in March and completes in eighteen months; Building C starts a year later against different indices. Those are genuinely different rows, and the Place column records which building each one is for. The column and the filter only appear when the estimate is measured in places — see Area schedule — and a project that never uses them never sees either.
Whole project is the ordinary case and what every row starts as. Naming a place is the exception you opt into, and it changes nothing about the arithmetic: a row for Building A is worked out exactly as a row for the whole project is. What it changes is how the tables can be read.
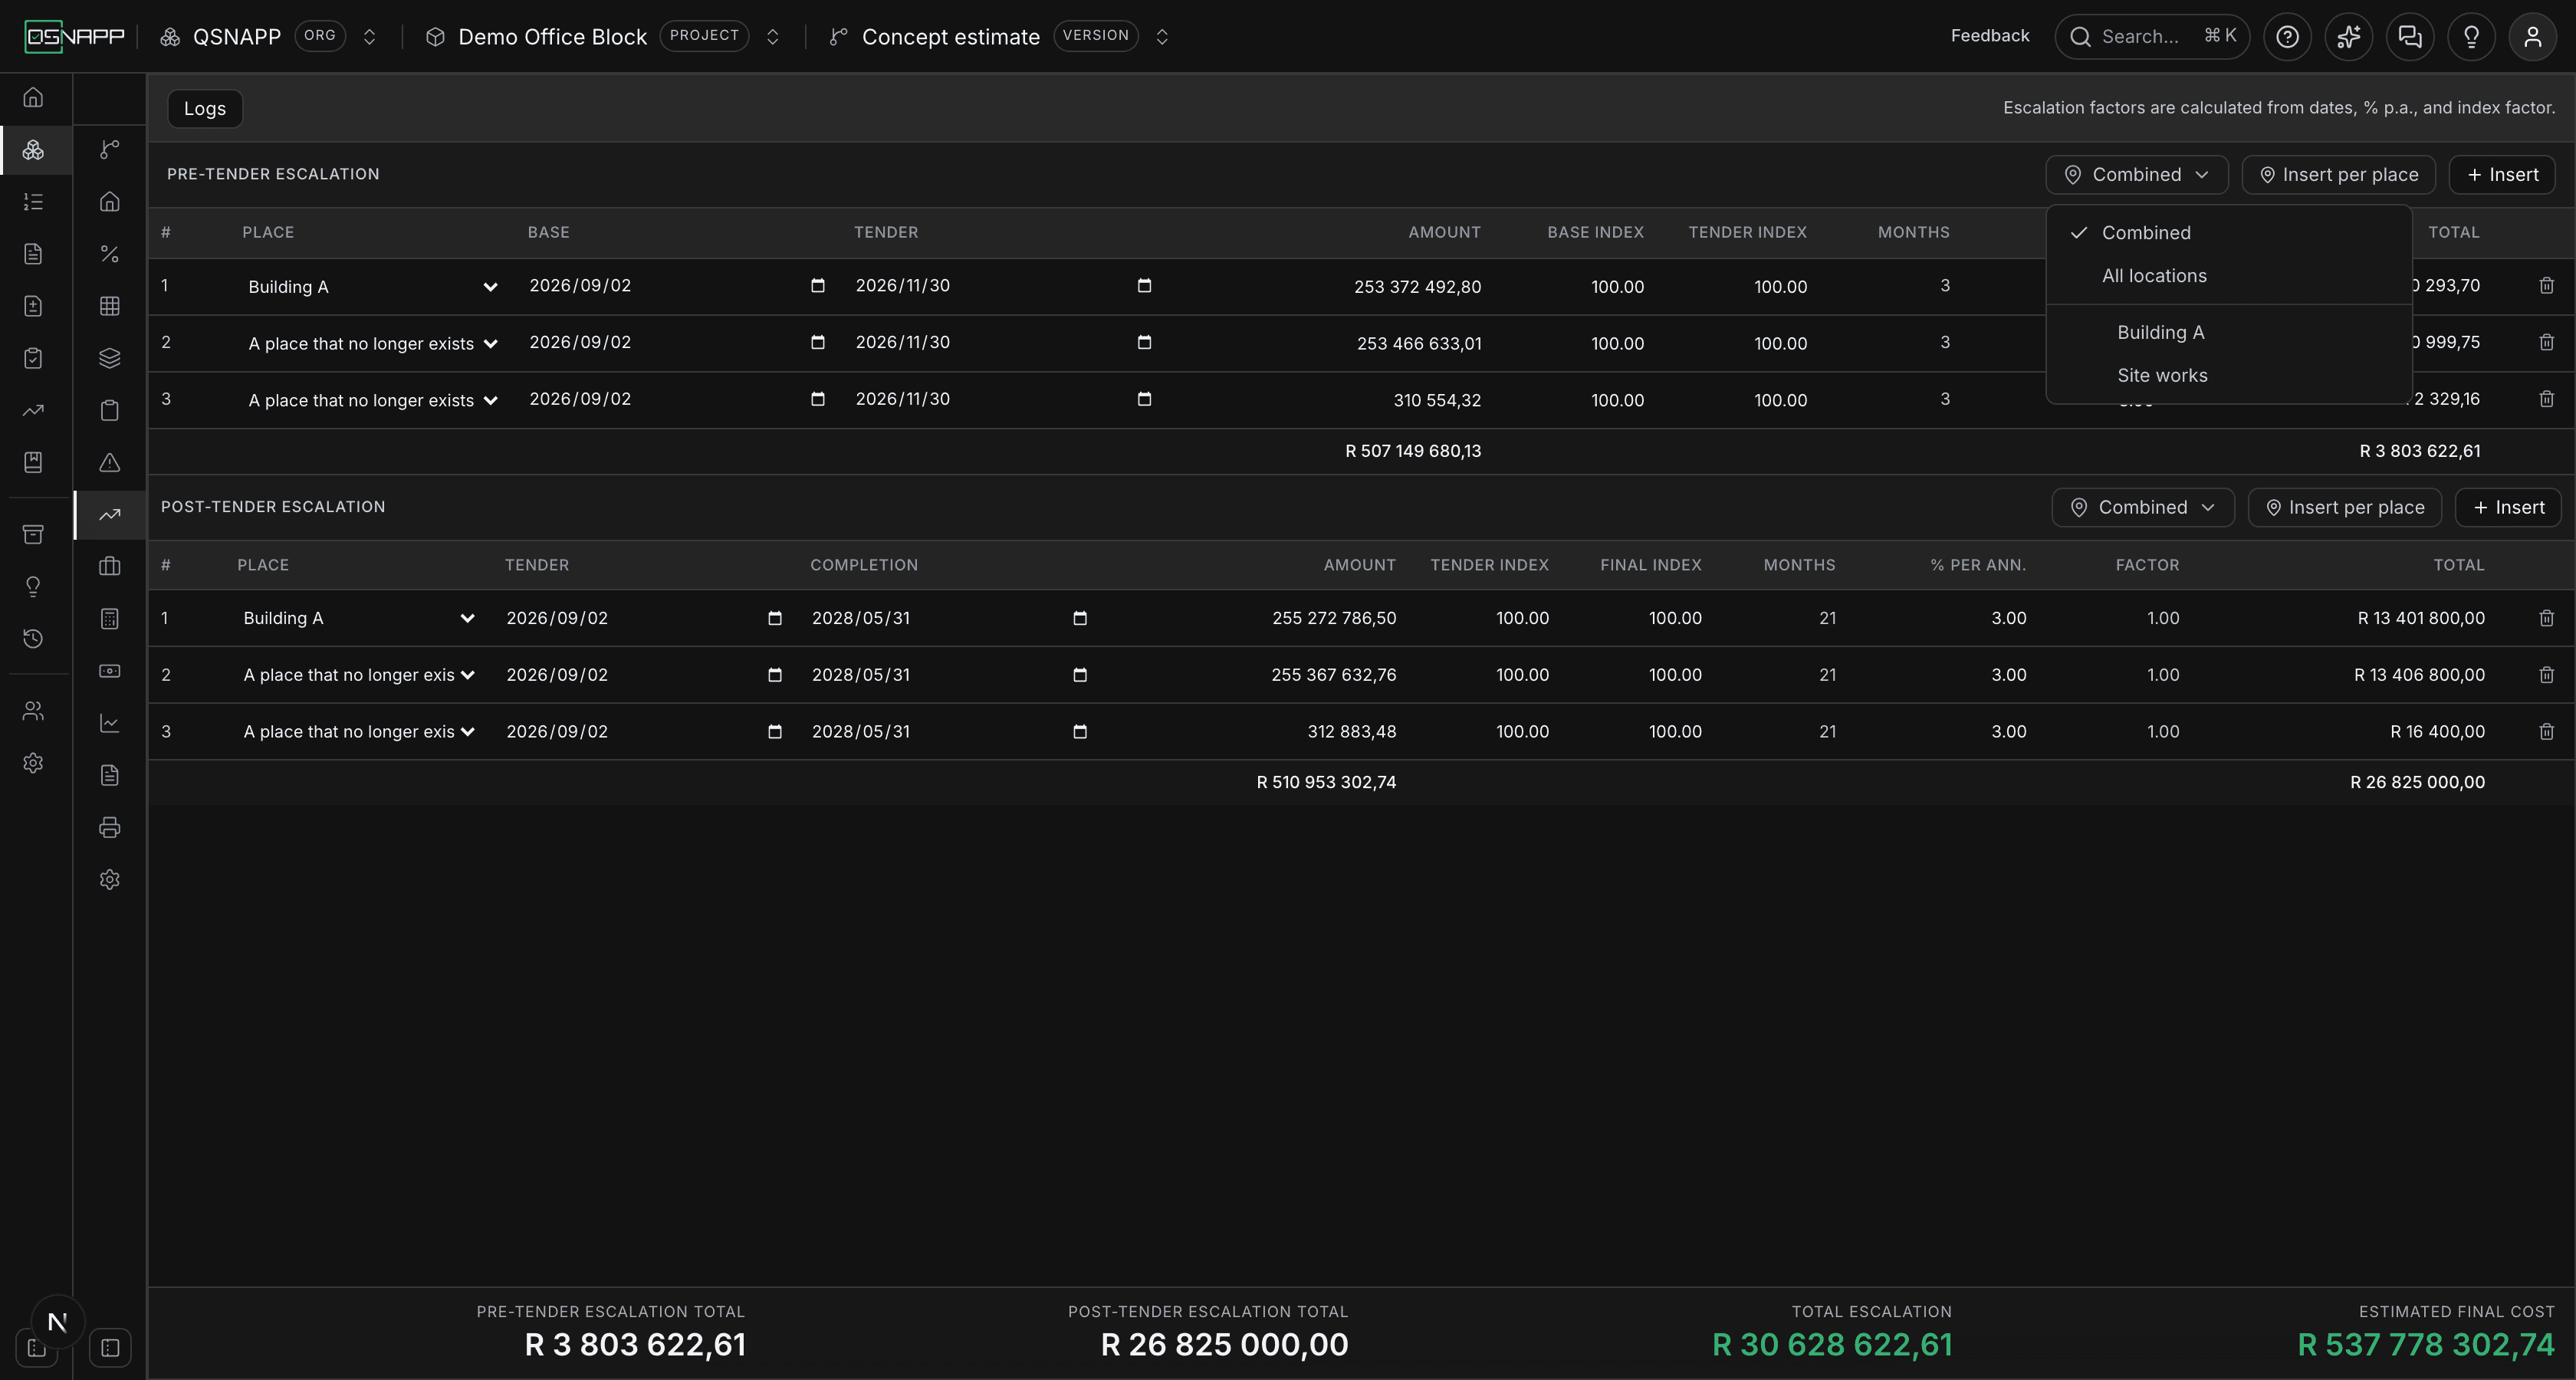
The filter reads Combined when nothing is picked and every row is shown; All locationswhen every place is; a place's name when one is; and a count when several are. Picking places keeps the rows about them and the rows about no place, because escalation over the whole project applies to every building in it.
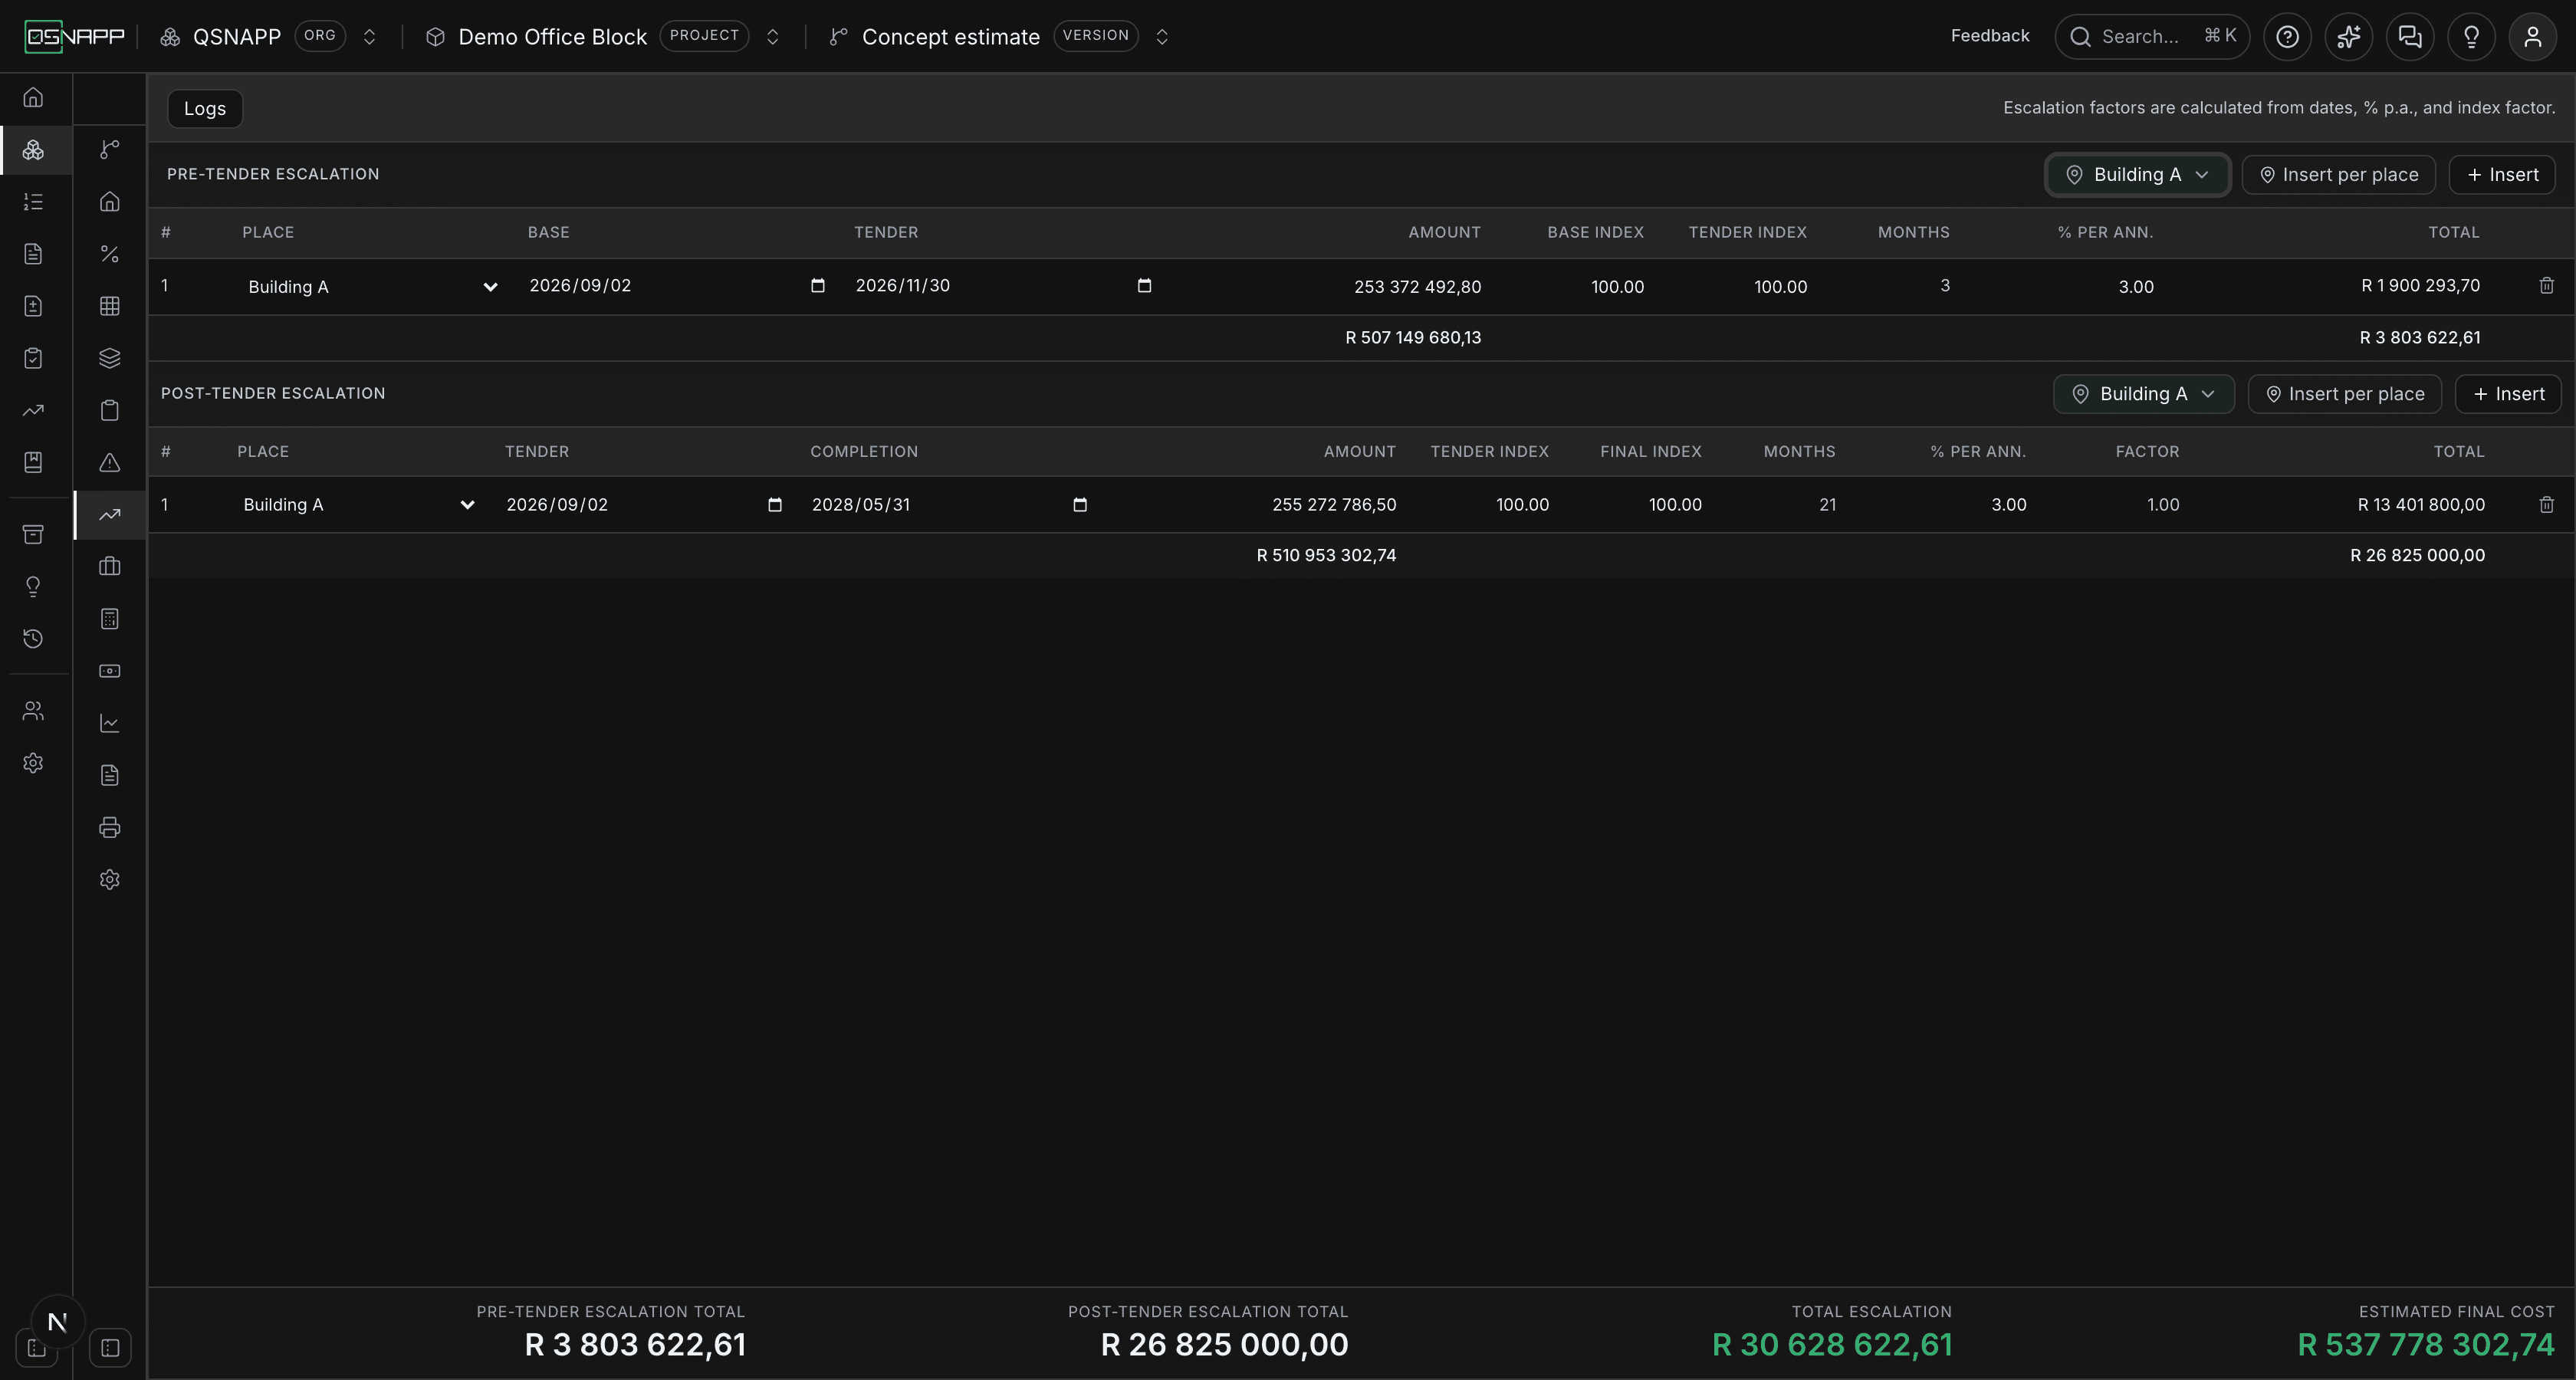
This is not how the Preliminaries and Contingencies tabs read by place, and the difference is deliberate. Those tabs hold a percentage per section, so reading them through a place means splitting a figure that is already derived. An escalation amount is typed; there is no cost column to divide. So a place here filters the rows rather than dividing them.
Deleting a place in the area schedule does not delete the escalation rows for it. Money somebody typed, with dates and indices, must not go out of the estimate because a location was tidied up: the row falls back to Whole project, which is wrong in a way that is visible on screen and put right by picking the place again. A row naming a place the estimate no longer measures in says A place that no longer exists in its Place cell rather than quietly reading as the whole project.
Insert per place
Insert per placeon the pre-tender table adds one row for every place the estimate measures in — or, if the filter is on, for every place picked — each seeded with that place's share of the base estimate. The shares are the components' own allocations to their places, scaled up by the same preliminaries and contingencies percentages as the whole, so they add up to what a single whole-project row would have carried. That is the part an estimator would otherwise do by hand and get wrong: if the shares came to a different base, the escalation would be worked out over a different estimate from the one being escalated.
On the post-tender table it seeds each place's row from that place's own pre-tender rows — their amounts plus their escalation — so Building A's contract escalation starts from Building A's tender sum rather than the project's. A place with no pre-tender row gets a row seeded at nought rather than being skipped; a figure to type over is more use than a row that is not there.
Editing, saving and discarding
Every cell is typed straight into the table; the dates open a date picker. Everything you do on this screen is a draft until Save changes: an edit, an inserted row and a removed one alike. The totals recalculate as you type, so the effect of a rate or a date is visible before anything is written.
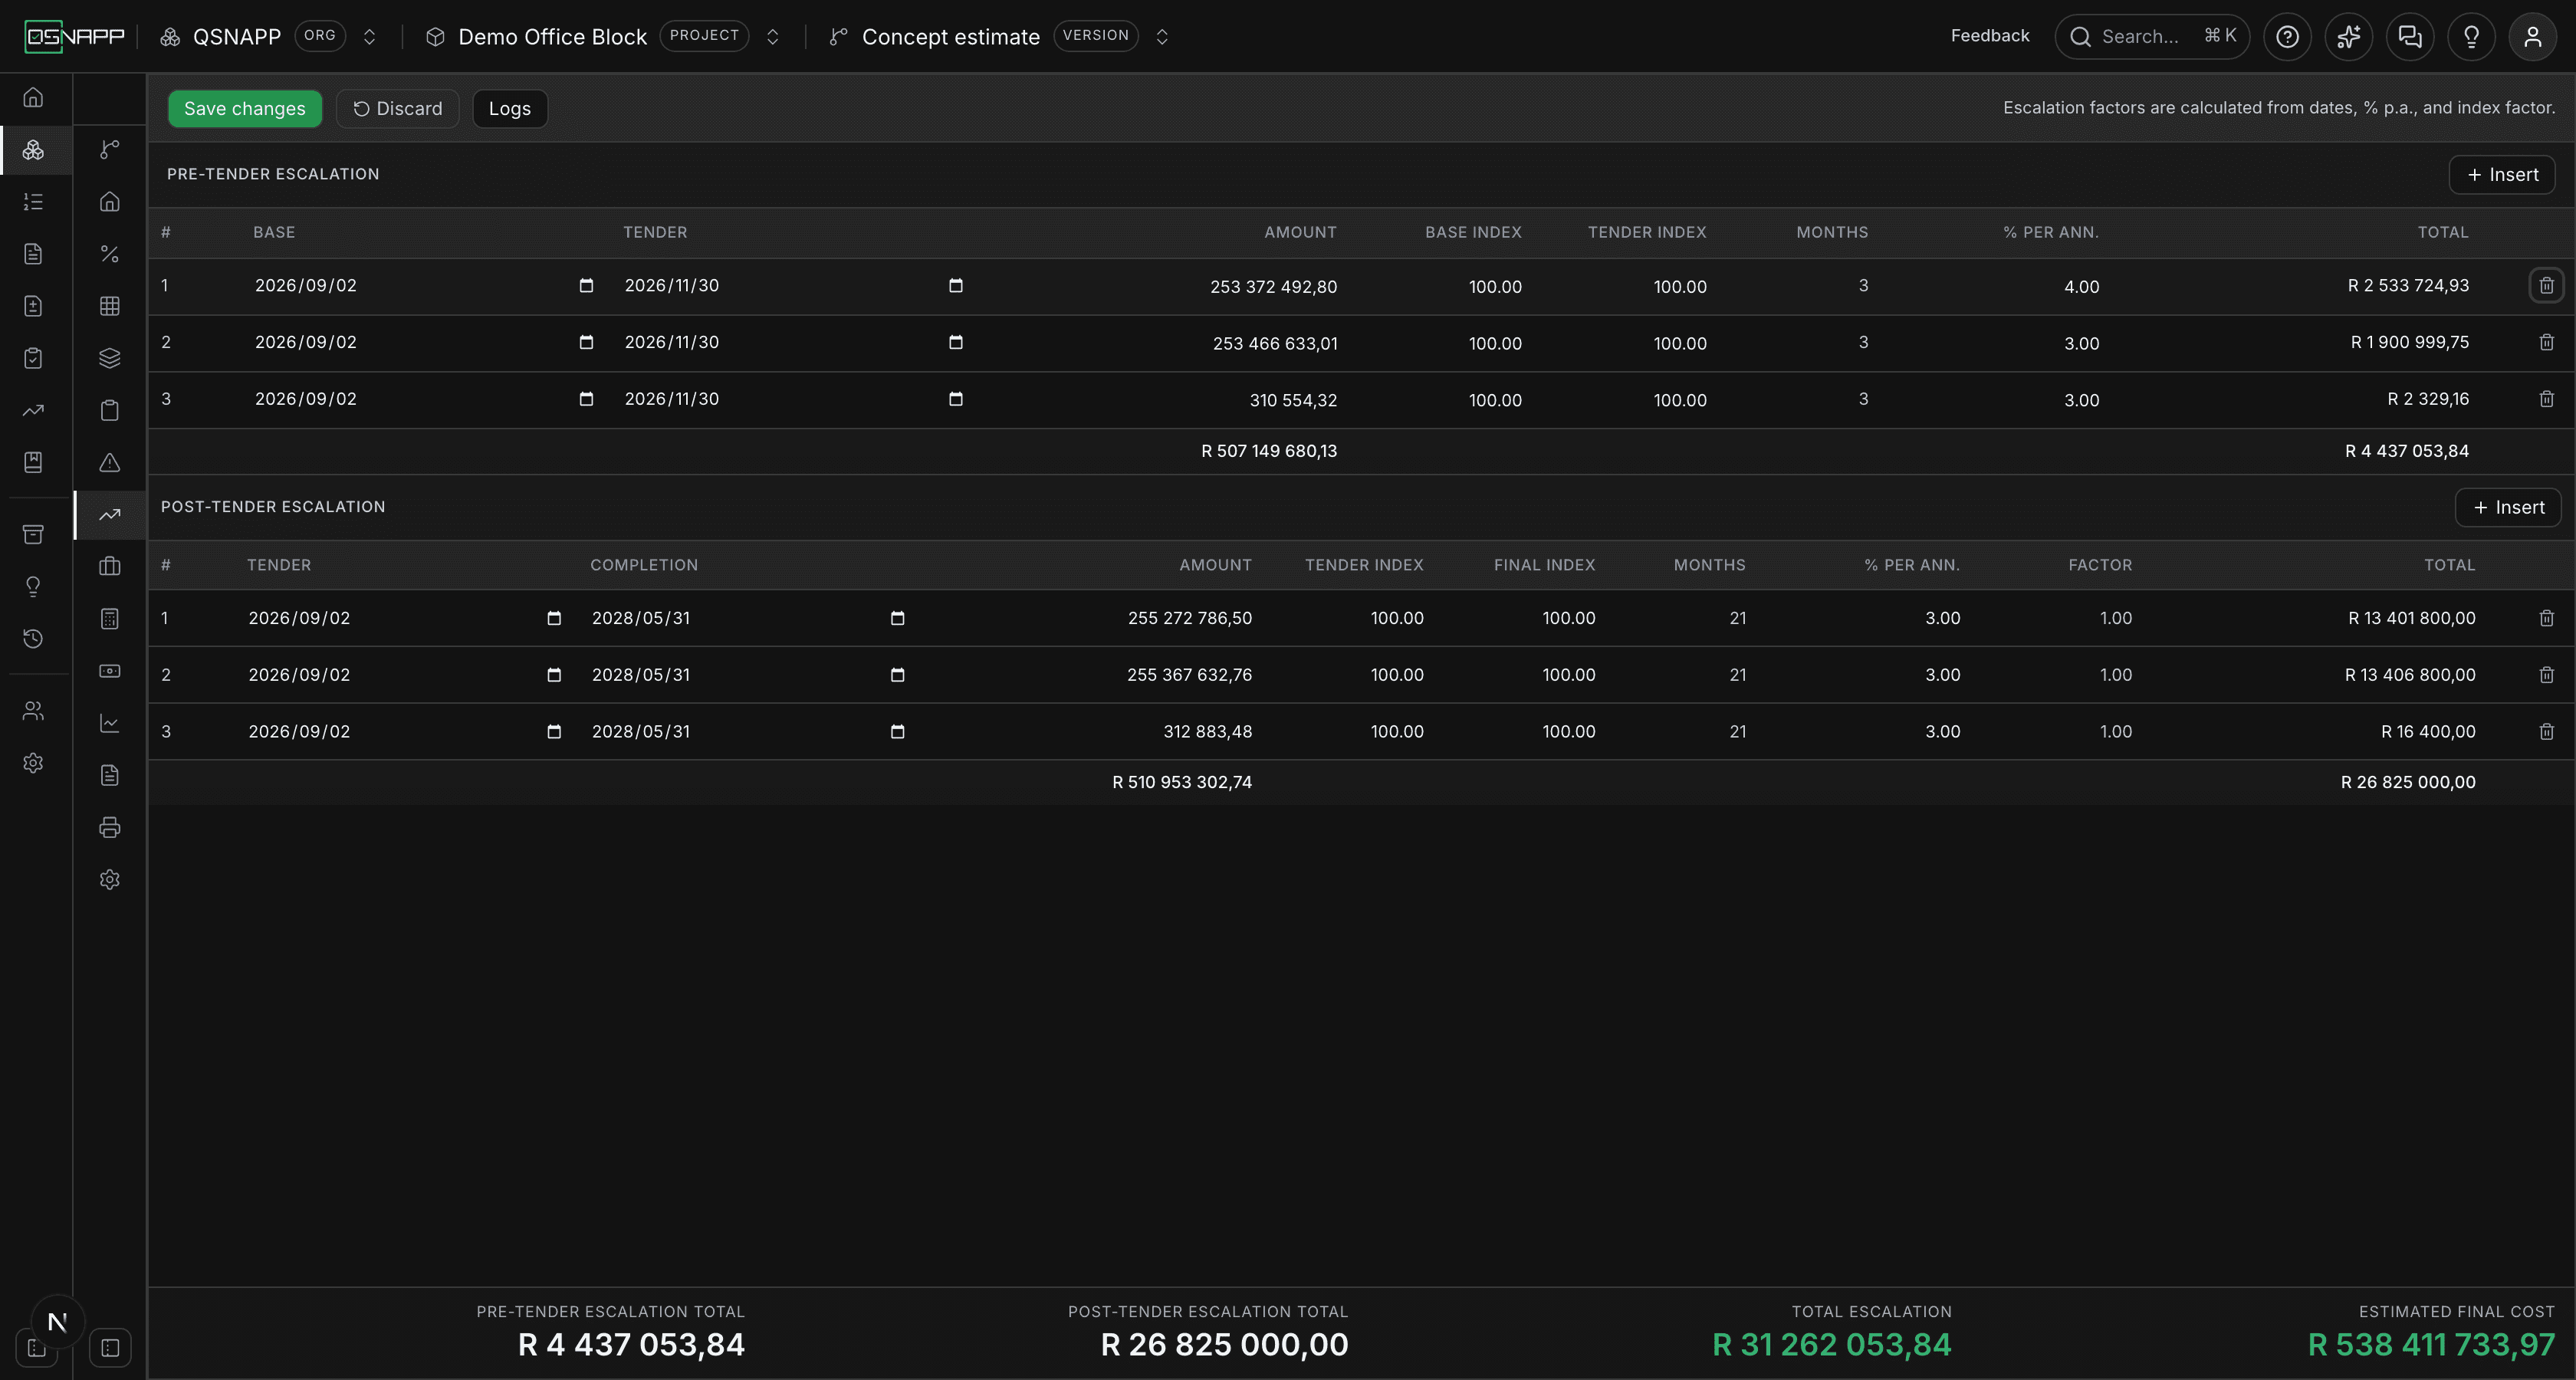
Discard puts both tables back to the last save. It costs nothing and touches no database — which is also why removing a row does not ask you to confirm: the draft-then-save cycle is the confirmation, and a dialog on top of it would be a second one for a change that has not happened yet.
Saving writes every row of both tables in their current order, deletes the ones you removed, and records each field that changed in the log. Nothing warns you if you leave the tab with unsaved changes: they are not kept, so save before moving on.
Blank dates and zeros
A date can be left blank, and a blank date is stored as blank rather than as some date. A row with a blank date has no period, so its months are nought and its total is nought — the row is still there, with its amount, waiting for the date. A rate of nought does the same: the row escalates nothing, whatever the indices say.
Insert dates a new row today at both ends, so it starts at nought months and nought escalation until you set the dates. That is a row that plainly has not been filled in yet, rather than one carrying an allowance nobody chose.
The log
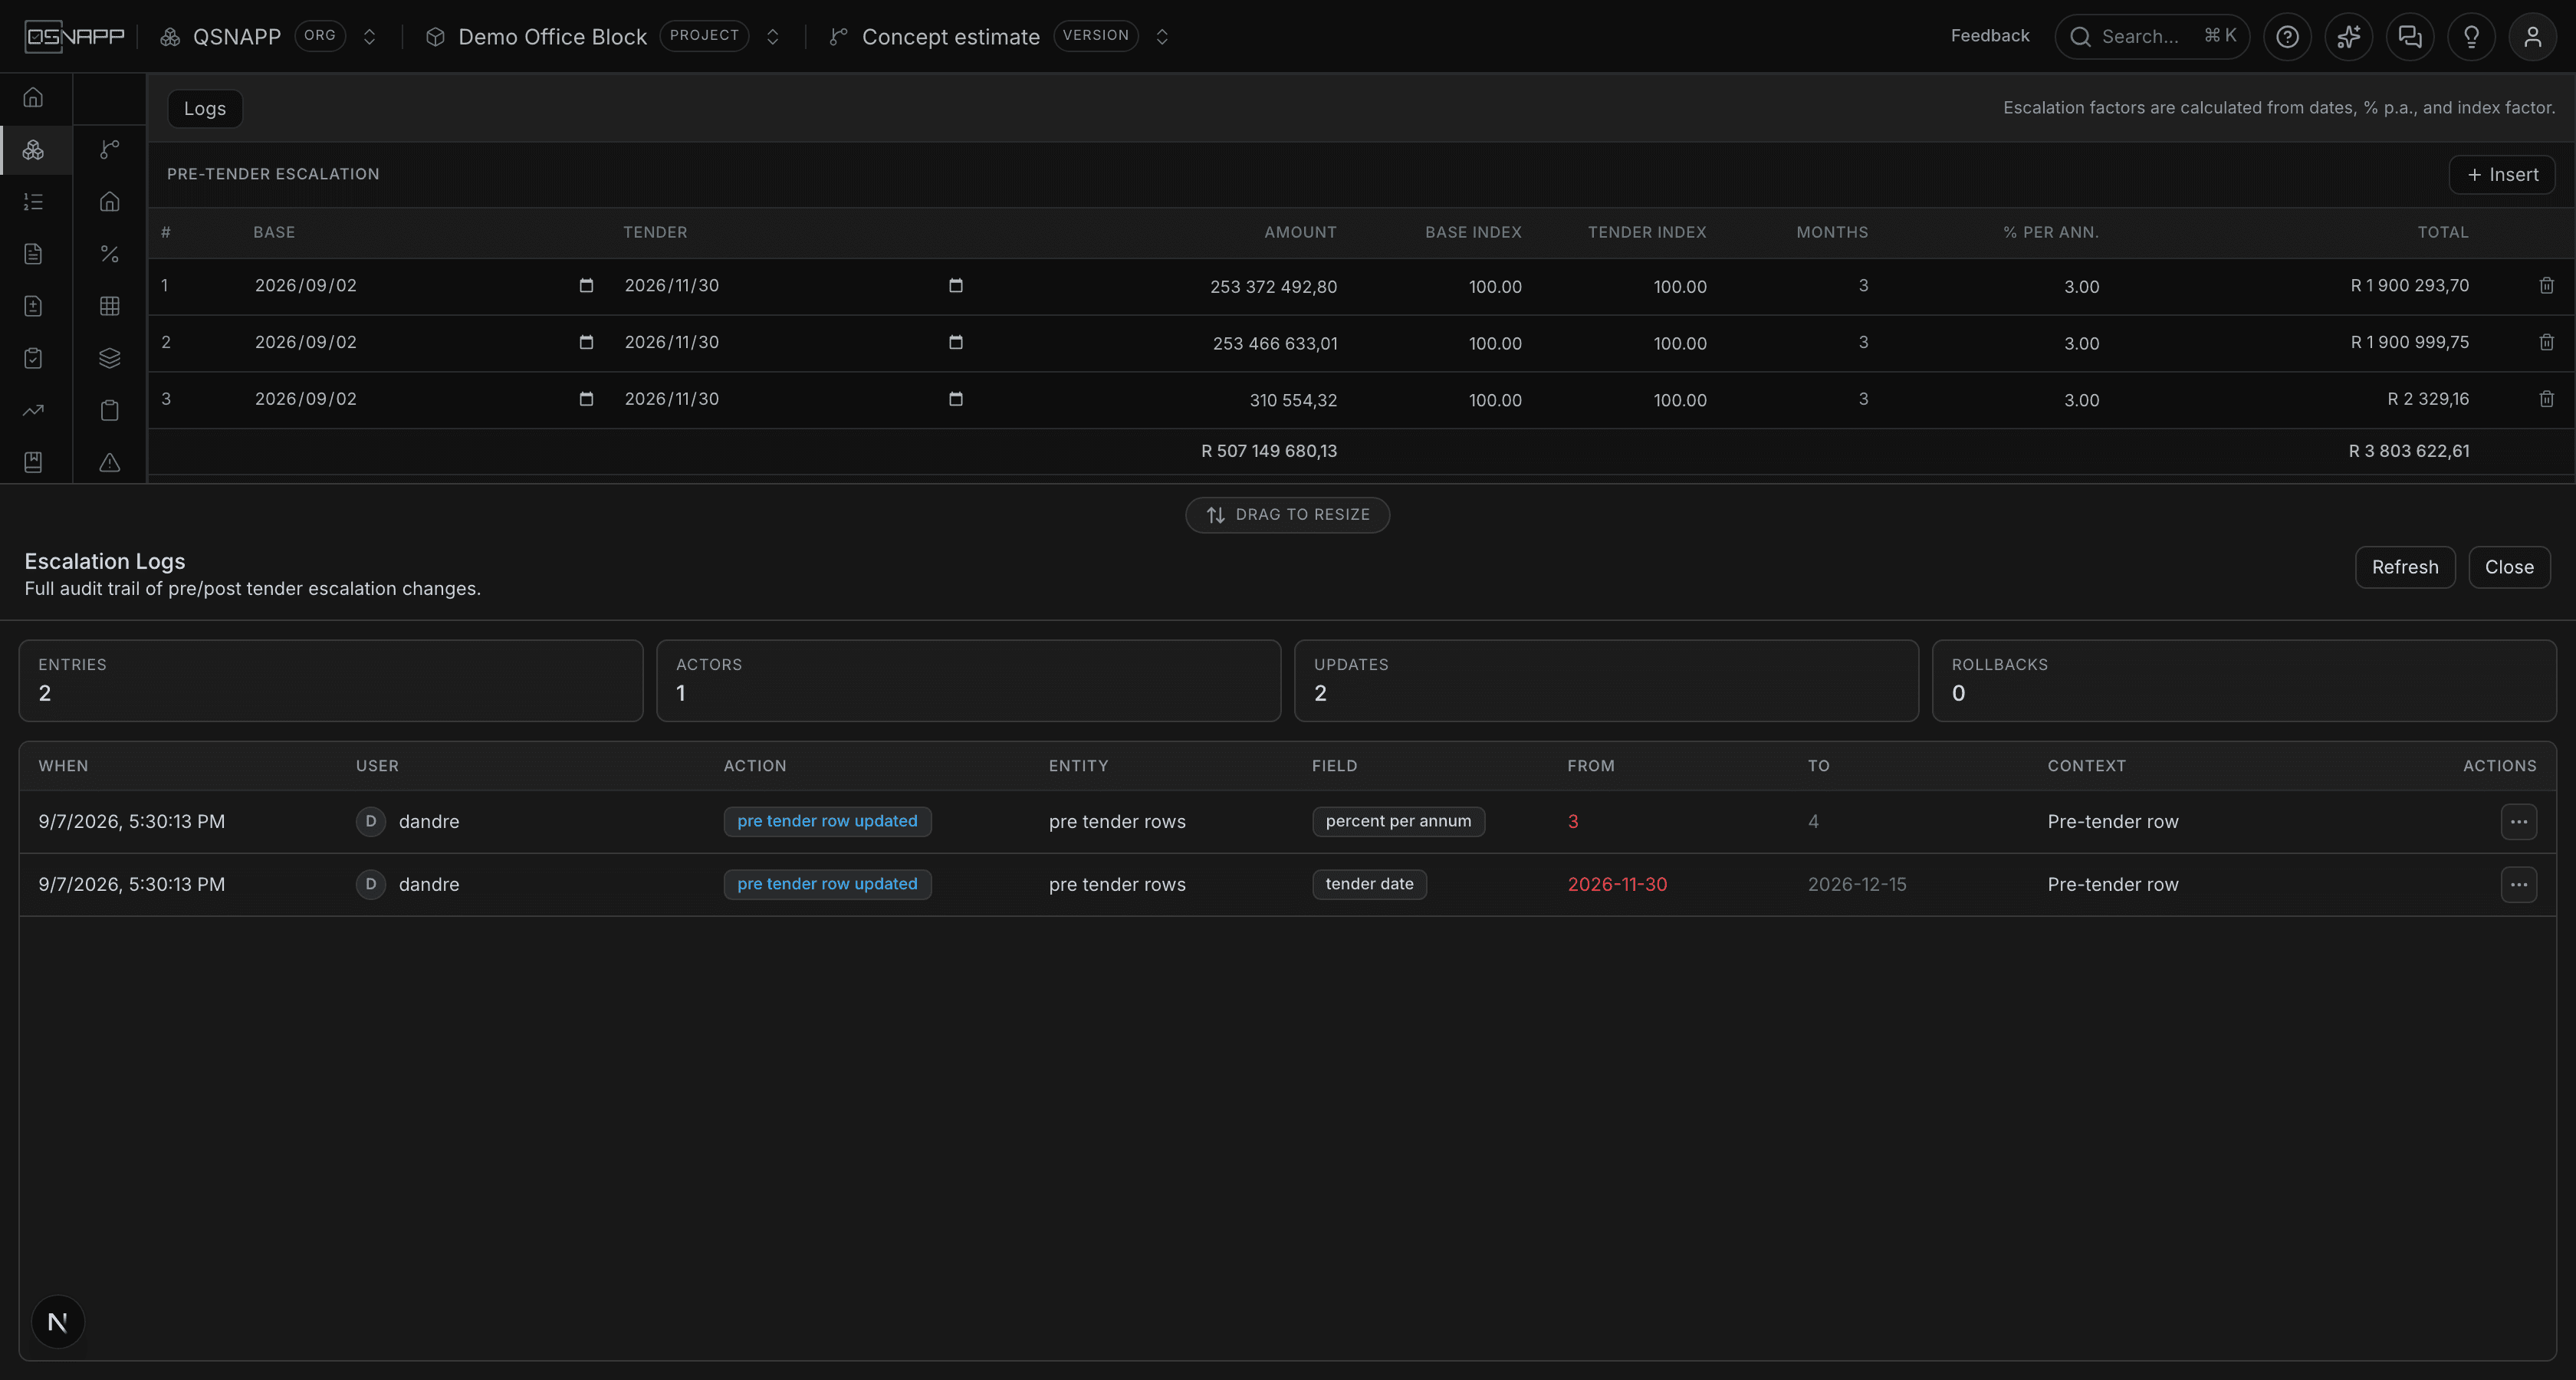
Logs in the toolbar opens a drawer from the foot of the screen — drag the handle to resize it — listing every saved change to either table: a row created, a row deleted, or a field changed, with who made it, when, and the value before and after. Above the list are counts of entries, people, updates and rollbacks. The log is the project's, not the version's: it shows escalation changes across every version of the estimate, most recent first, up to four hundred of them.
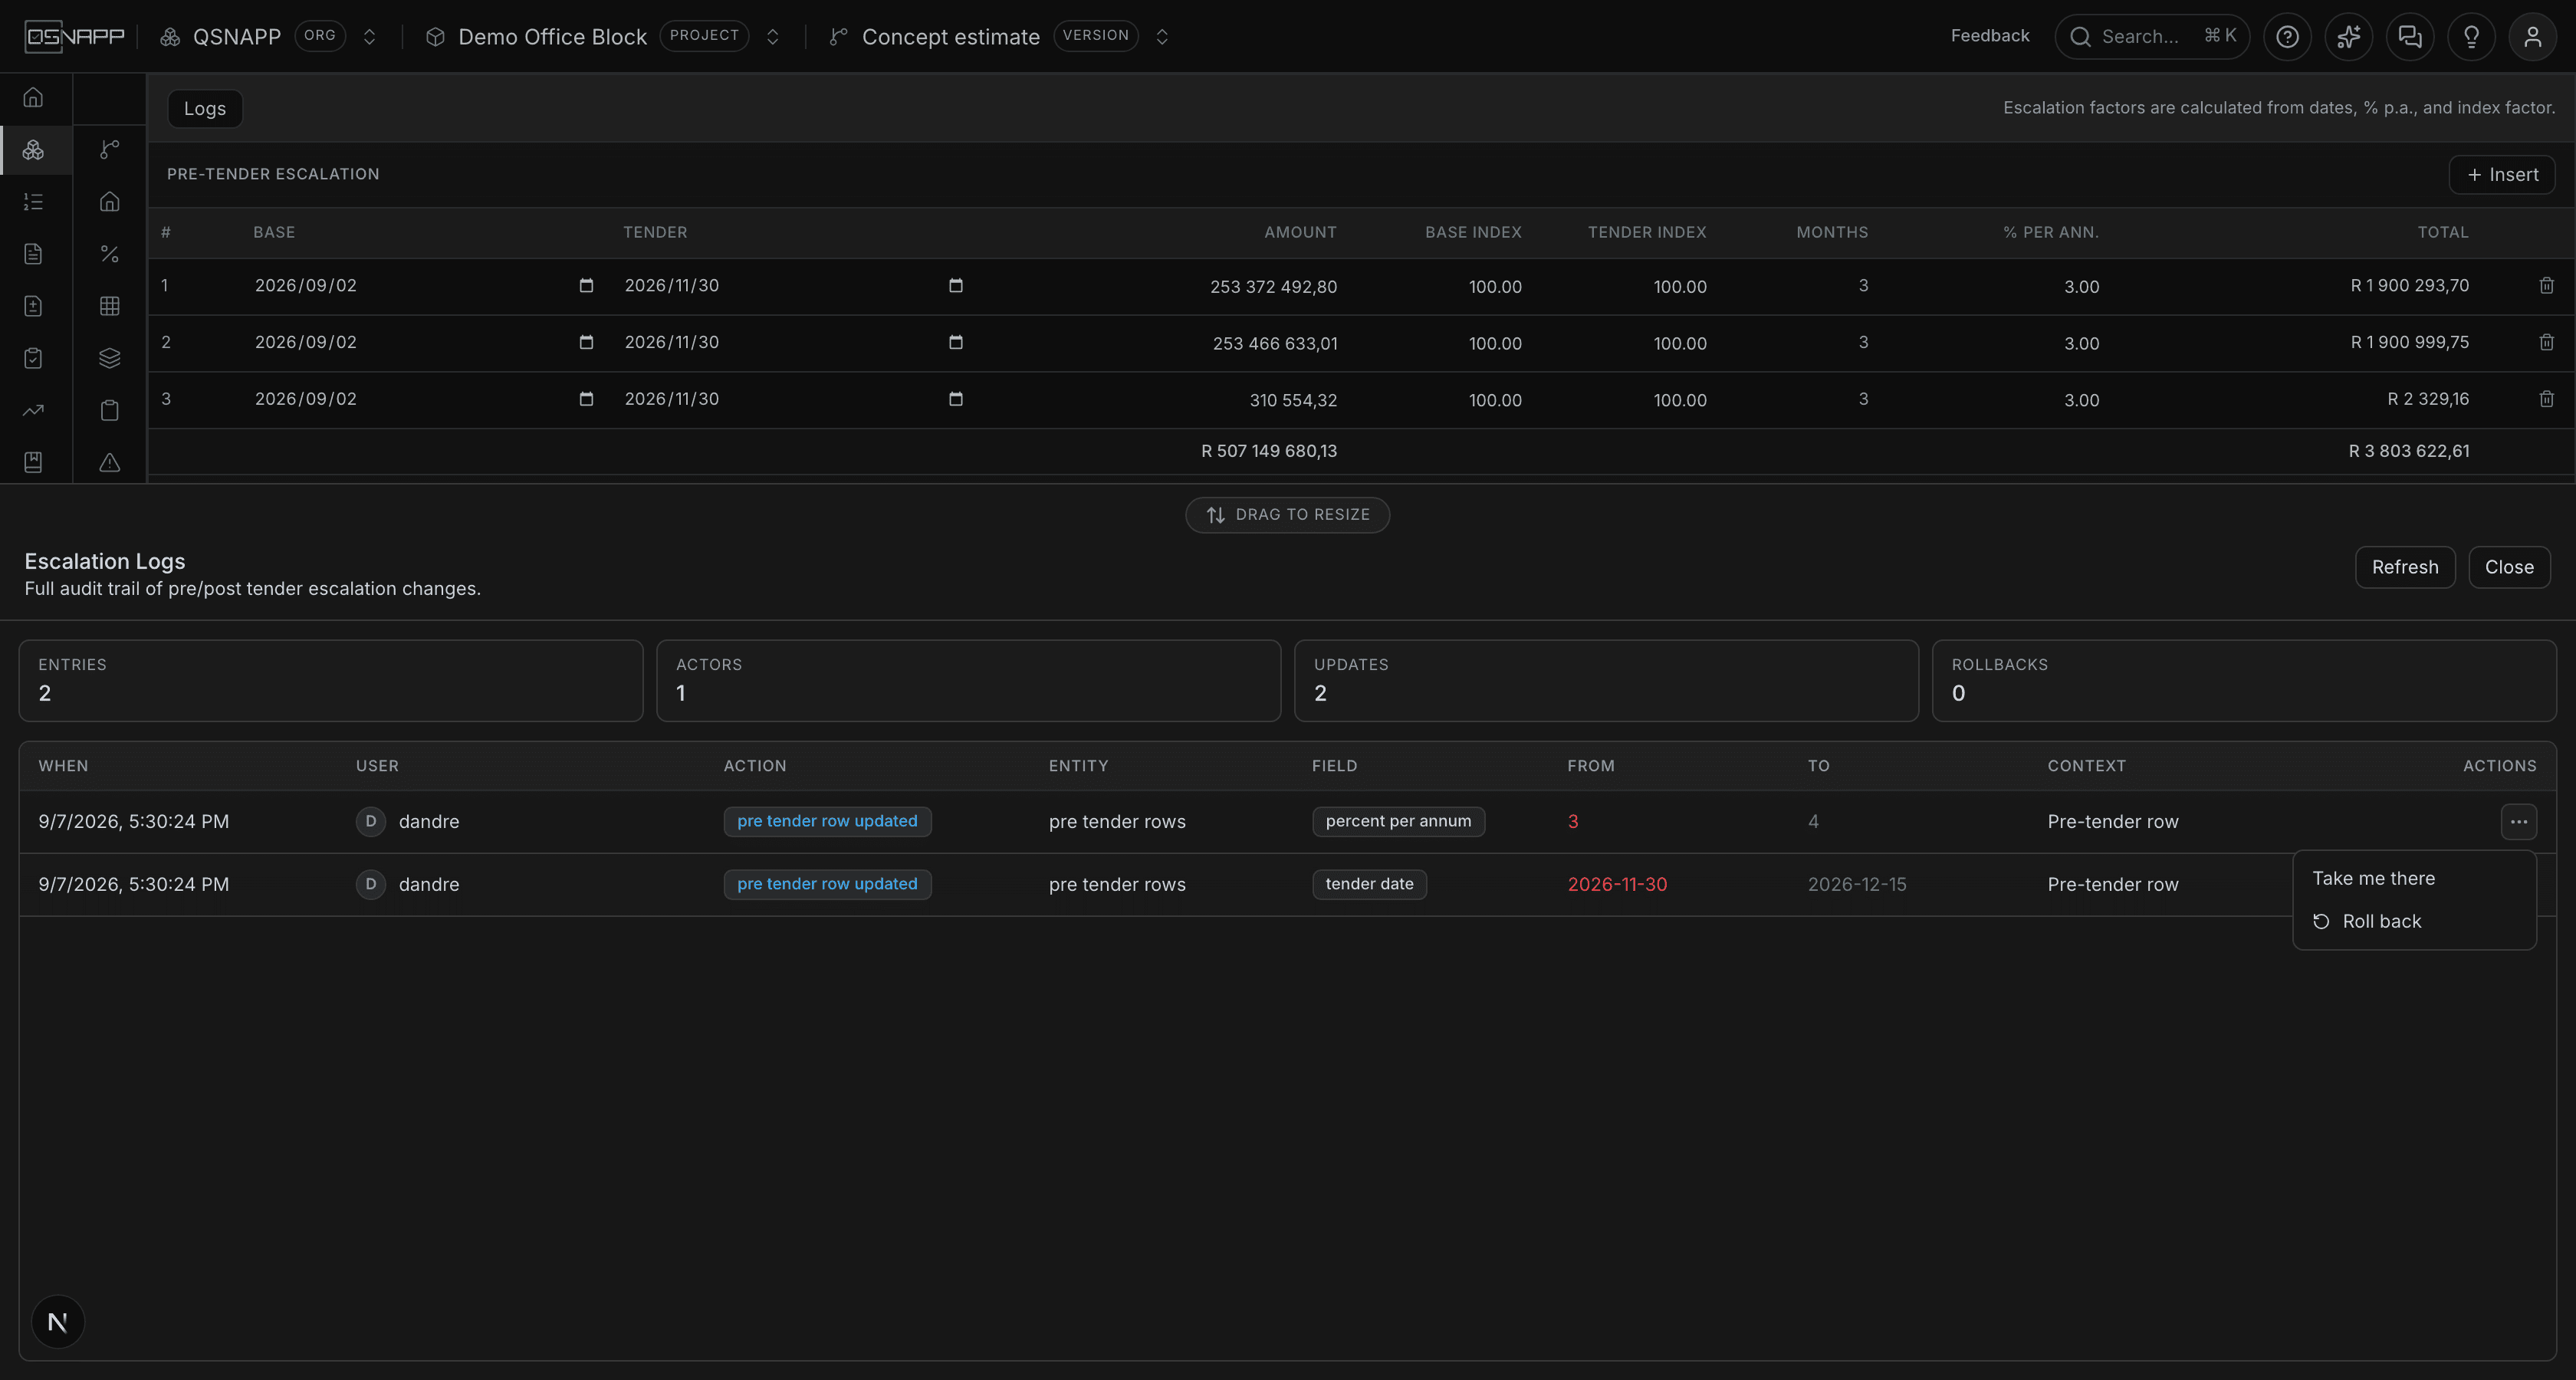
Take me there closes the drawer, scrolls to the row the entry is about and flashes it. Roll back puts one field back to the value it had before that change. Unlike everything else on this screen it is not a draft: it is written at once, shown in the table, and recorded in the log as a rollback, so the log stays a complete account of what happened. Only entries that record a field change can be rolled back; a row that was created or deleted has no single field to put back.
What the rest of the estimate reads
Professional feesre-derives this tab's Estimated Final Cost from the saved rows — the pre-tender amounts plus both escalations, by the same arithmetic — and offers it as the linked fee base, since the fees are a percentage of what the building will finally cost. When no escalation has been allowed for, the base falls back to the works with preliminaries and contingencies. The ASAQS fee scale itself is charged on a base that leaves contingencies and escalation out, as the scale requires.
Total project cost, Cash flow and Return on investment read this tab differently. They add up the Amount column of both tables — every pre-tender amount and every post-tender amount — and carry that as Estimated Final Cost (Escalation), the figure the Estimated Building Cost line starts from. That is not the figure this tab shows under the same name: this tab leaves the post-tender amounts out, because they already carry the pre-tender ones. With post-tender rows seeded the way Insert seeds them, the two differ by the post-tender amounts. Check the Total project cost tab's figure against this one before relying on it.
Printing it
On Print & Export the Escalation section lists the rows under Pre-tender escalation and Contract escalationheadings, each row's escalation worked out by the same functions this tab uses, with a Total escalation line. Either table can be left out, the total line can be dropped, and the two index columns are off unless you tick them. Pick places and the section prints only the rows about them — rows about no place are always printed — with a Place column that reads Whole project where none is named. An estimate with no rows prints No escalation has been allowed for.
Who can change what
Reading the tab needs permission to view the project. Saving needs permission to update it: without that, the tables can still be read and typed into, but the save is refused and the screen says so. Rolling back from the log writes to the same tables and needs the same permission.