Elemental breakdown
The elemental breakdown is where an estimate is actually priced. It holds the structure the estimate is measured against, the rate for each component, and the build-up behind that rate.
What this screen is
An elemental estimate prices a building by element — substructure, ground floor, structural frame — rather than by trade. Each element holds components, each component has a quantity and a rate, and the two multiply into that component's total. The elements add up to the works cost, which every later tab in Estimates builds on.
A new version starts from a library: the platform's AAQS Elemental Guide 2016 structure, your organisation's own copy of it, or another version of the same estimate. What you get is the structure and the wording — the measuring is yours.
Sections, elements, components
Three levels, and the screen is laid out along them:
- Section — the top of the structure, chosen from the dropdown above the rail. “1. Primary Elements” is the usual one.
- Element — listed down the left rail:
100. Substructure,101. Ground floor, and so on. Selecting one opens it as a tab across the top; more than one can be open at a time, so you can move between two elements without losing your place in either. - Component — a row in the grid.
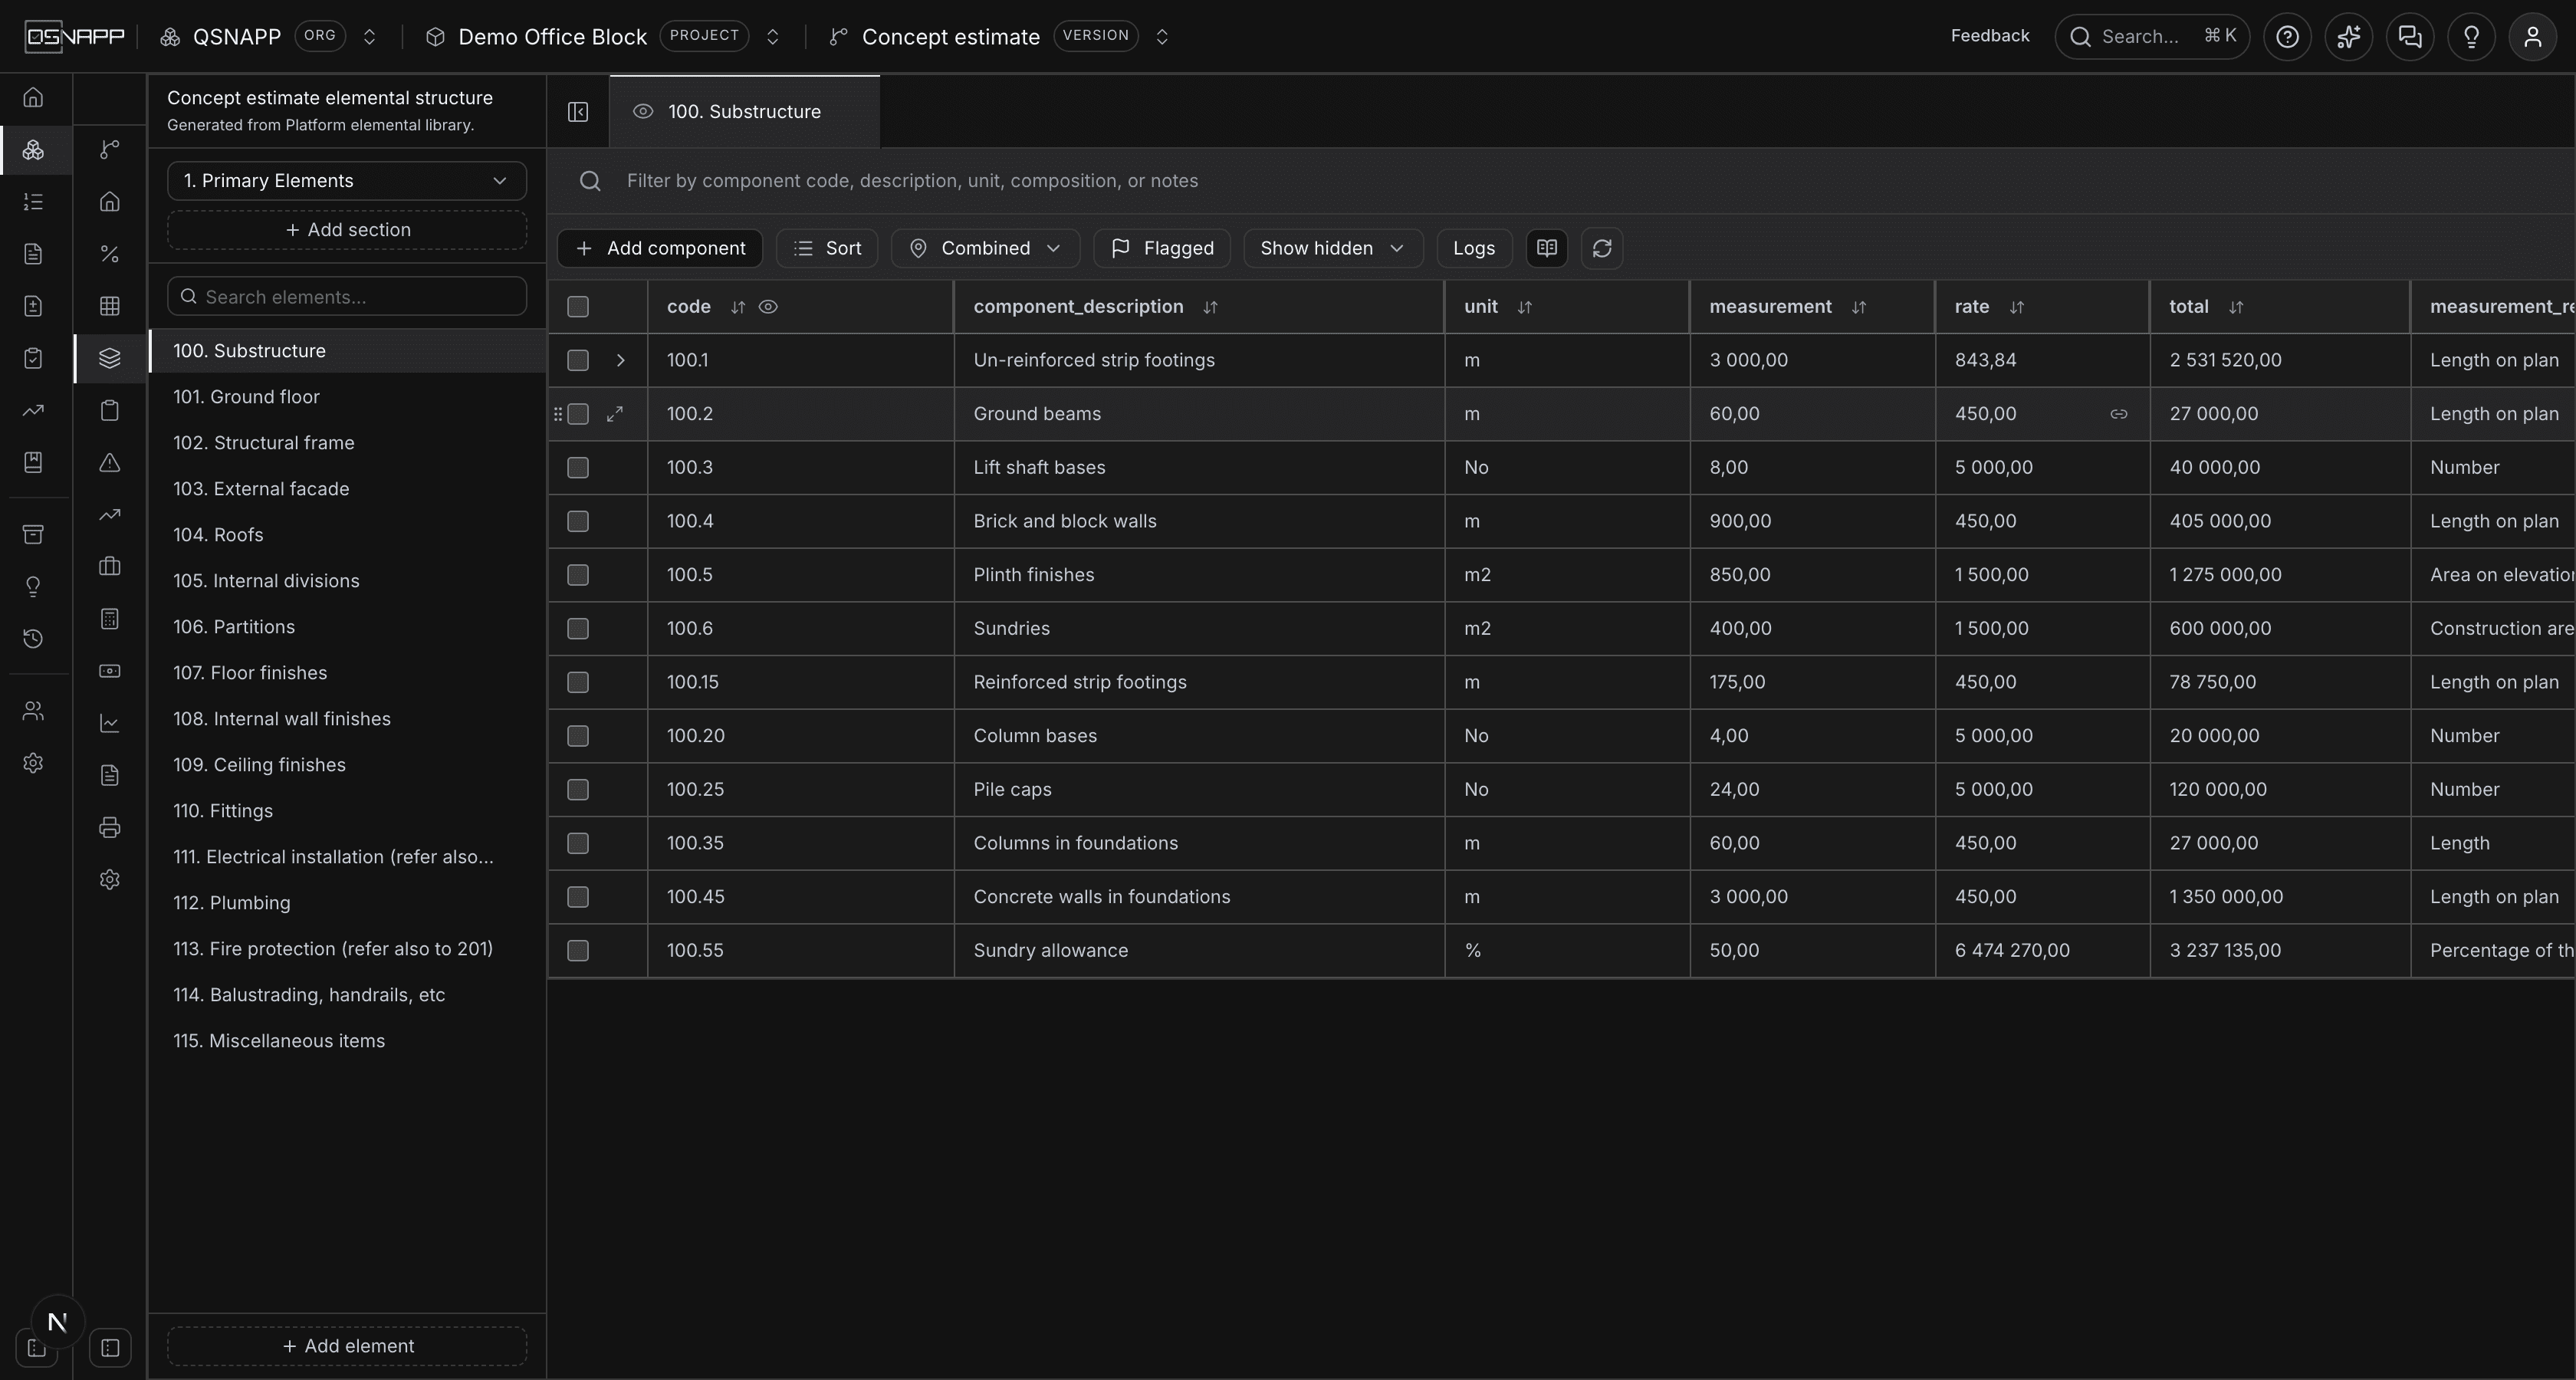
100.45 Concrete walls - 230mmis a component of Substructure.
Add section and Add element sit under the rail; Add component is in the toolbar above the grid and offers the element you have open. All three open the same kind of drawer on the right, and all three let you start from a library or from nothing.
Adding from a library, or blank
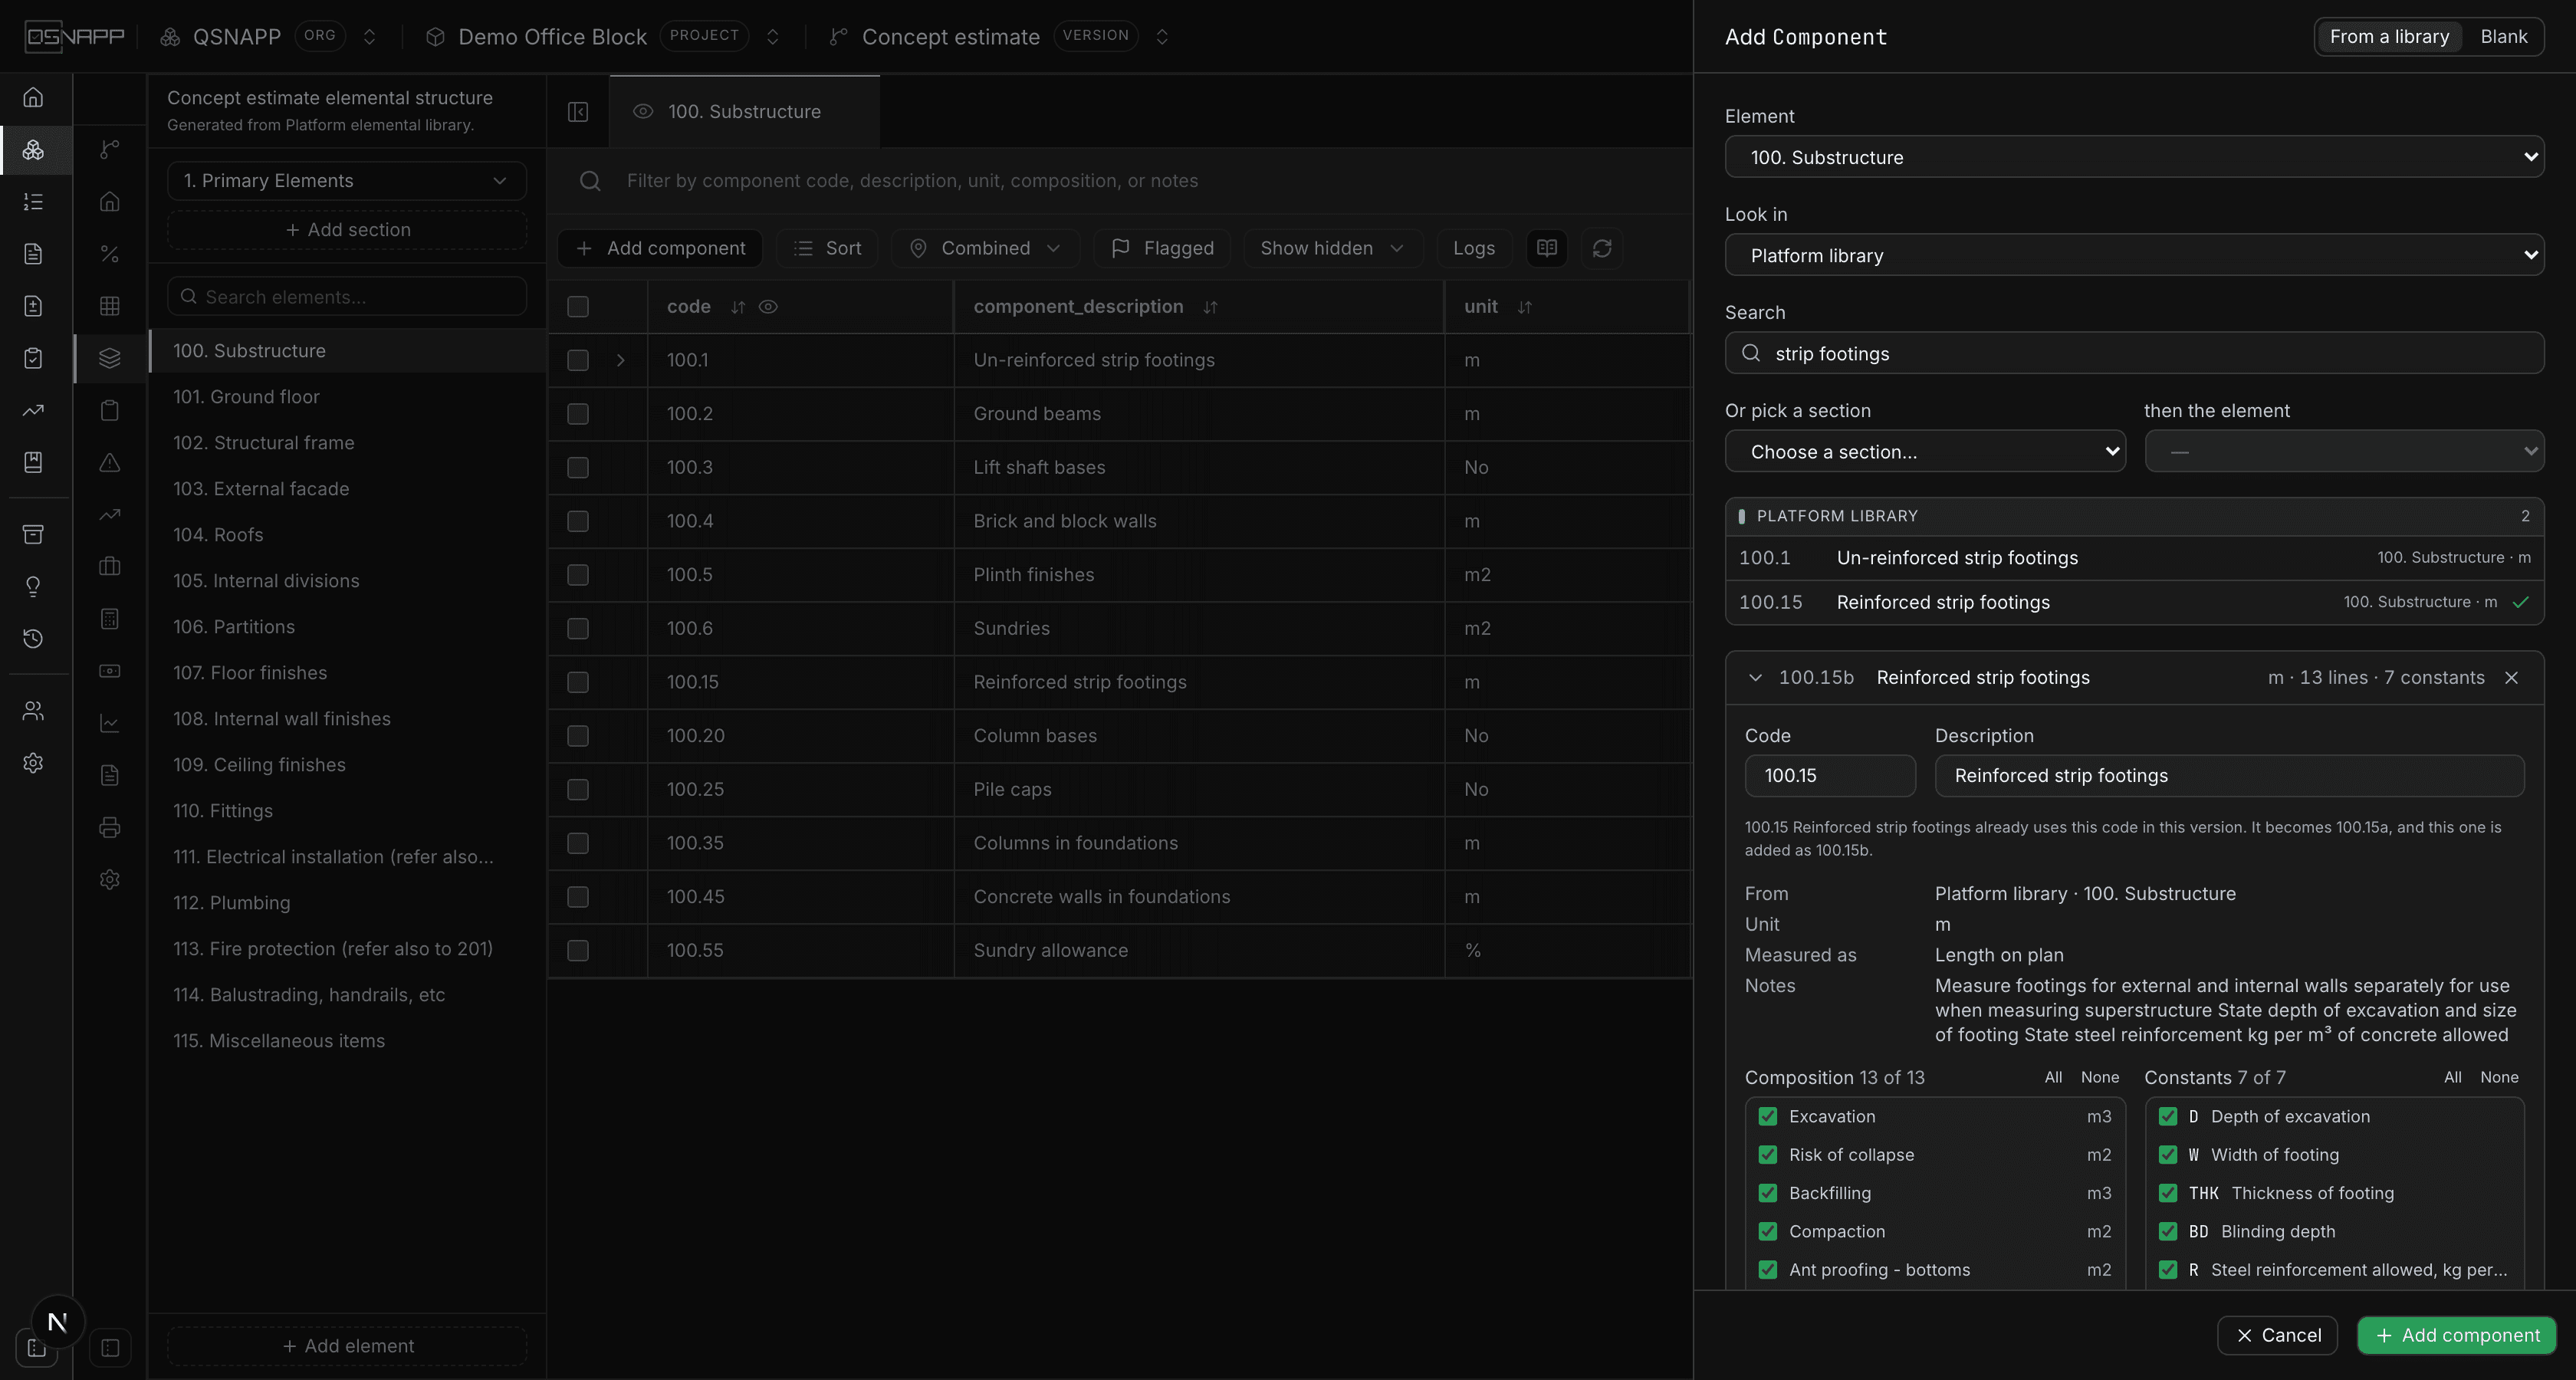
From a library is the usual way in. Look inchooses where: the platform library, your organisation's library, a project in this organisation — with one of its versions — or everywhere at once. Then either search by code or description, or pick a section and an element and read down its components. With a single library or a chosen version selected, leaving the search blank lists everything there.
Results are grouped under a header that names their source, so a component from another estimate is never mistaken for the standard one. Choosing a result shows what it carries: its unit, what has to be measured, its notes, and every composition line and constant with a tick against each. Untick anything that should stay behind. What comes across is named — the lines with their units, the constants with their descriptions. Figures never do: a dimension or a rate belongs to the estimate it was taken off, so the copy arrives unmeasured and its constants arrive waiting to be stated.
If the code is already used in this version, the drawer says so and letters the pair — the existing row becomes 100.5a and the new one 100.5b — rather than leaving two rows answering to one code. See Copying a component for the rule.
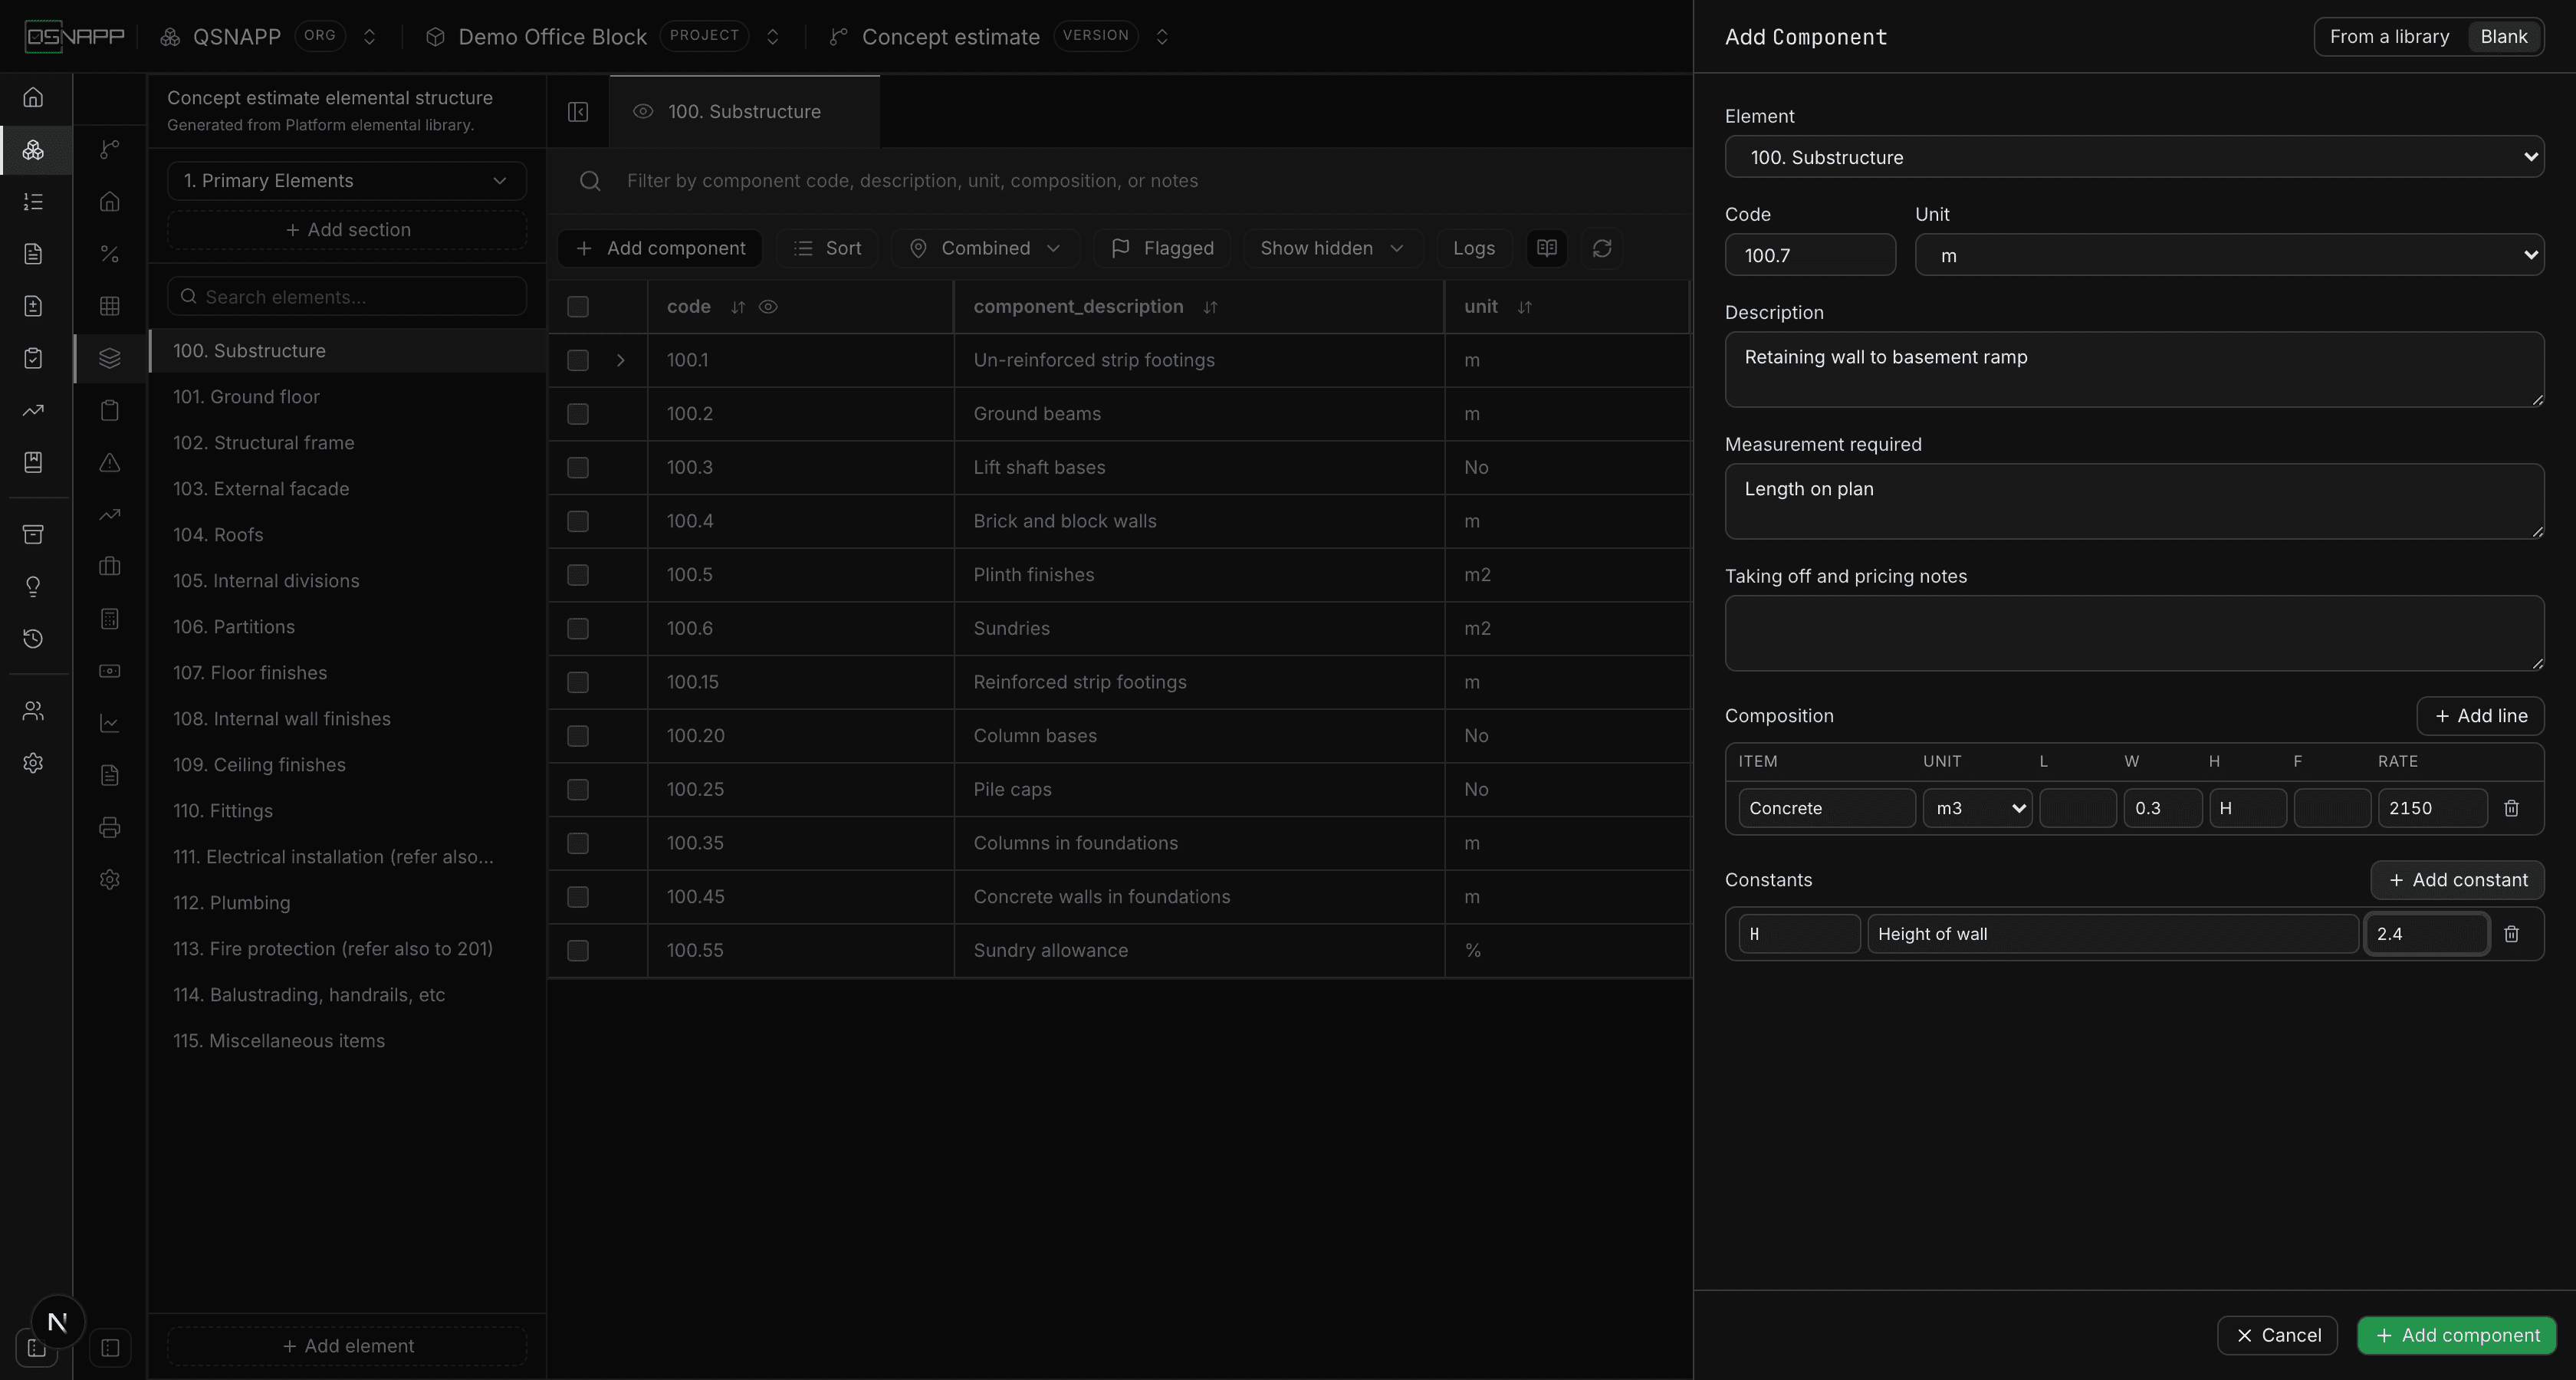
Blank states the component from nothing: code, unit, description, what has to be measured, the notes, then the composition lines with their units, dimensions and rates, and the constants with their values. The rate follows the lines that state a total, exactly as it does in the grid, and everything is written in one save.
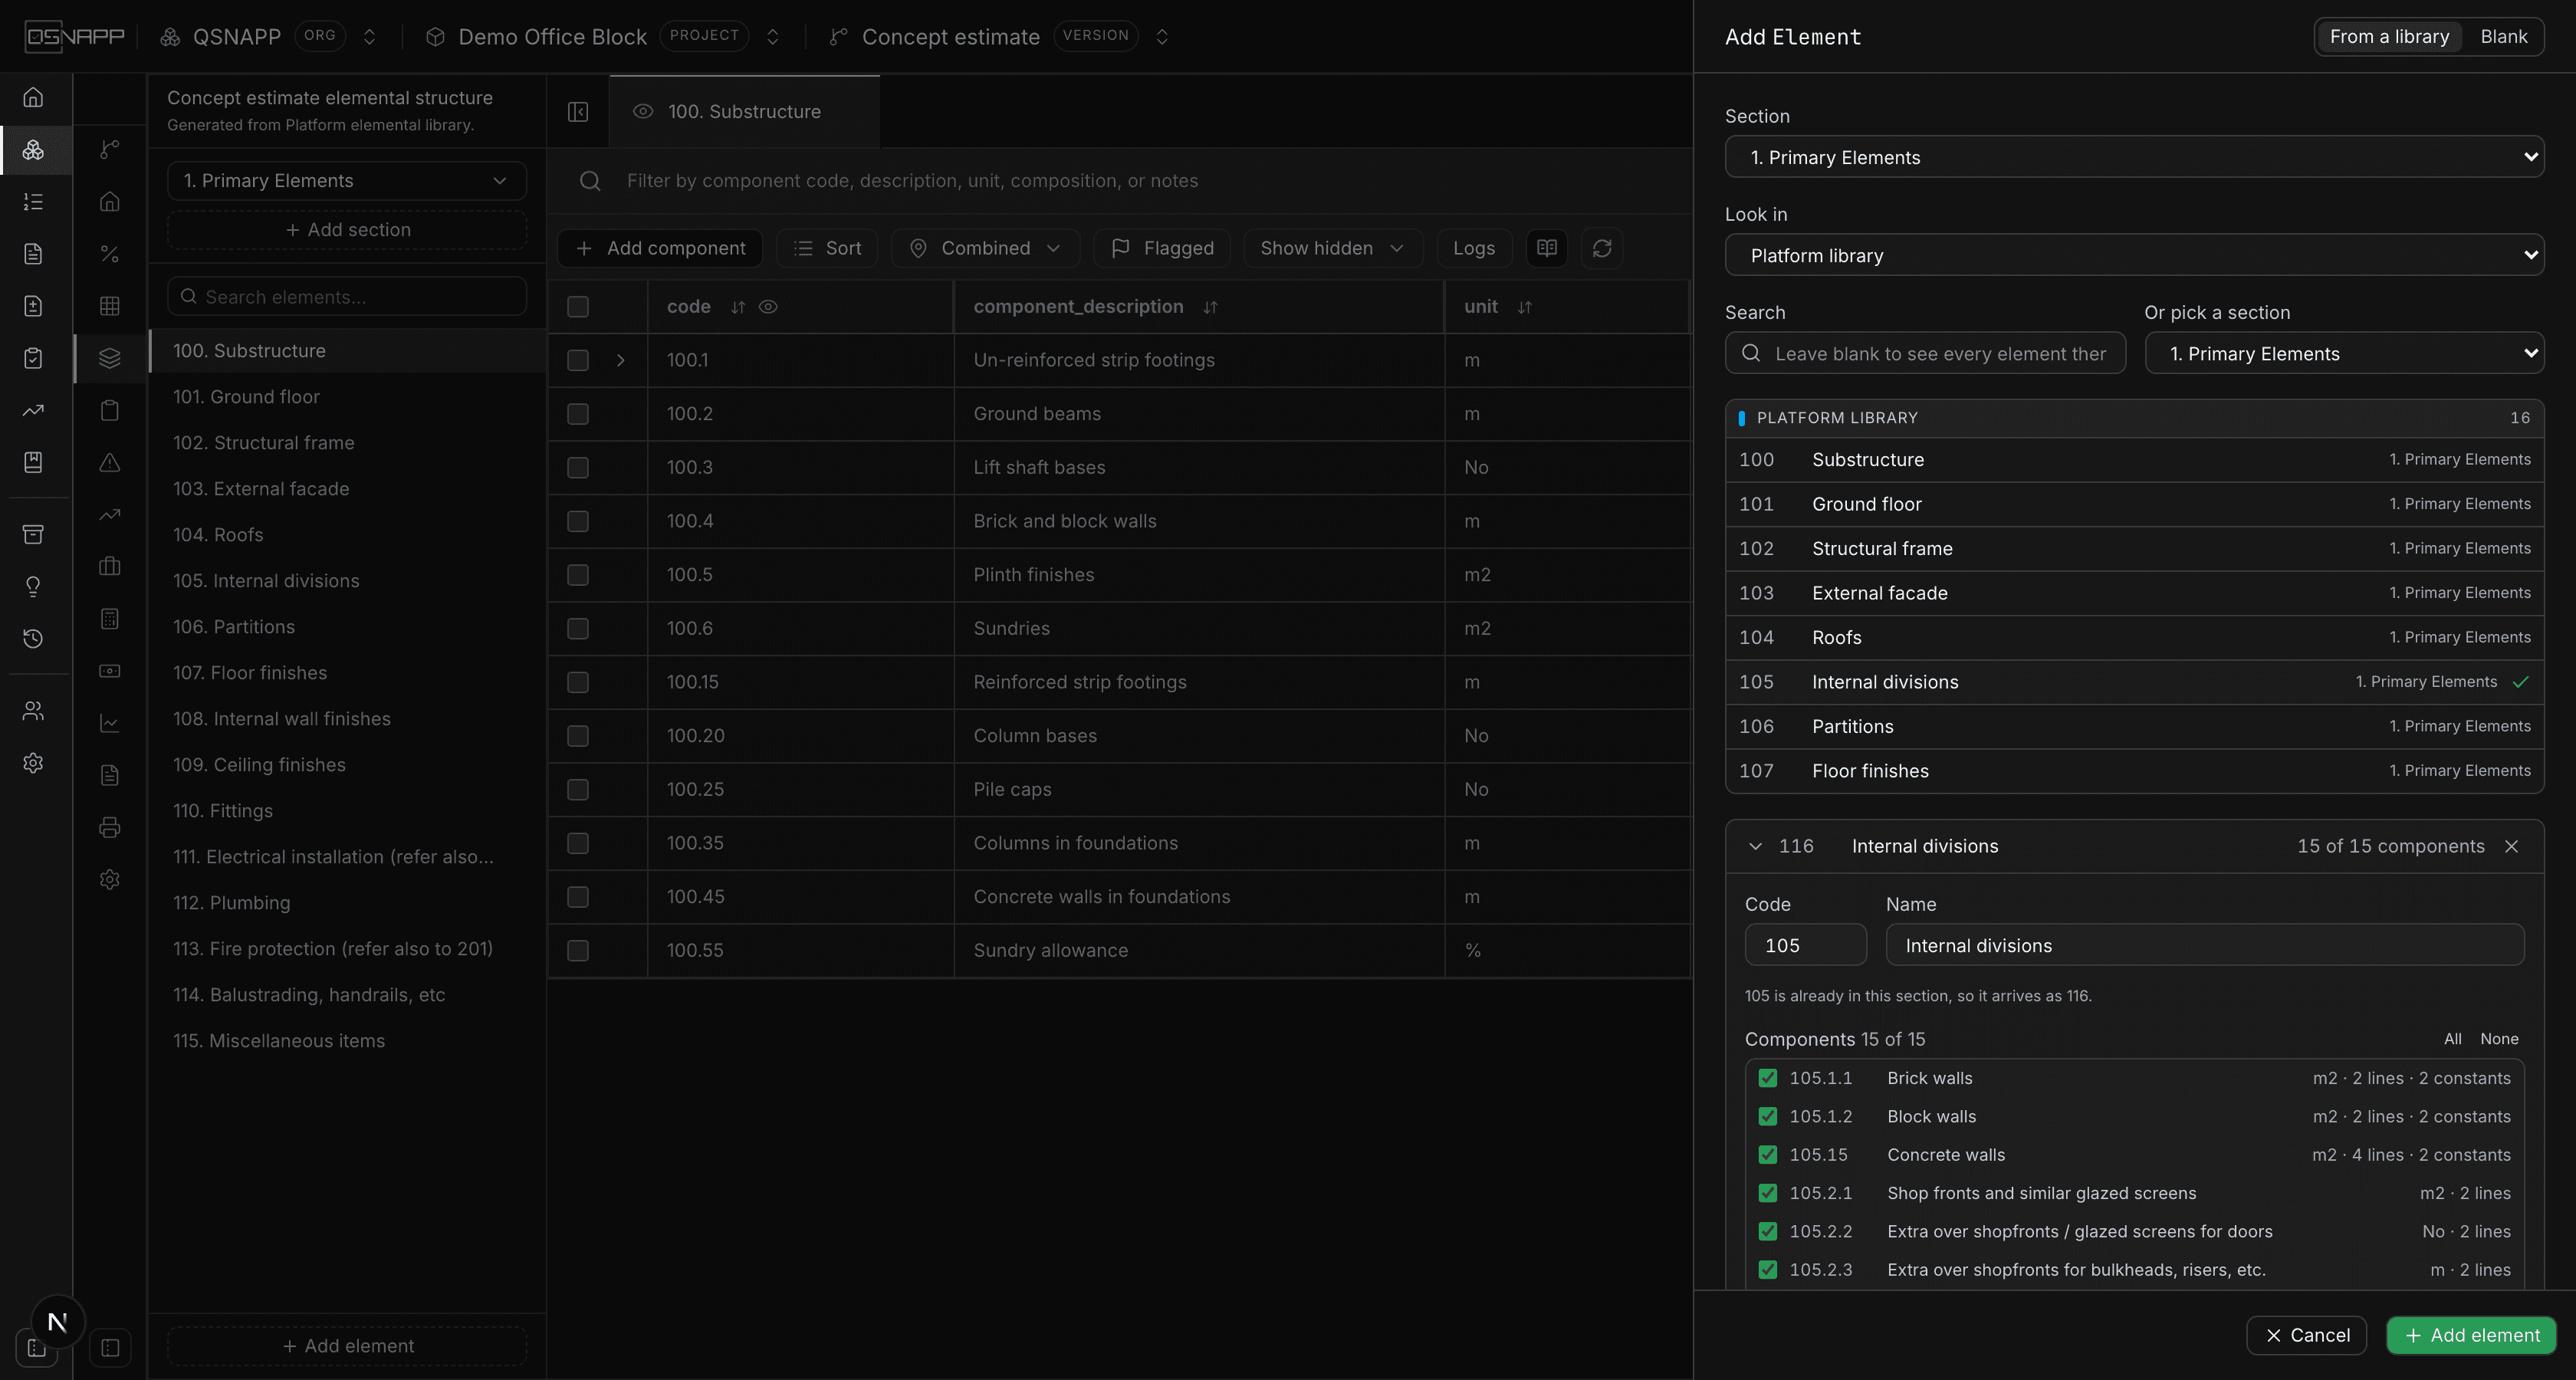
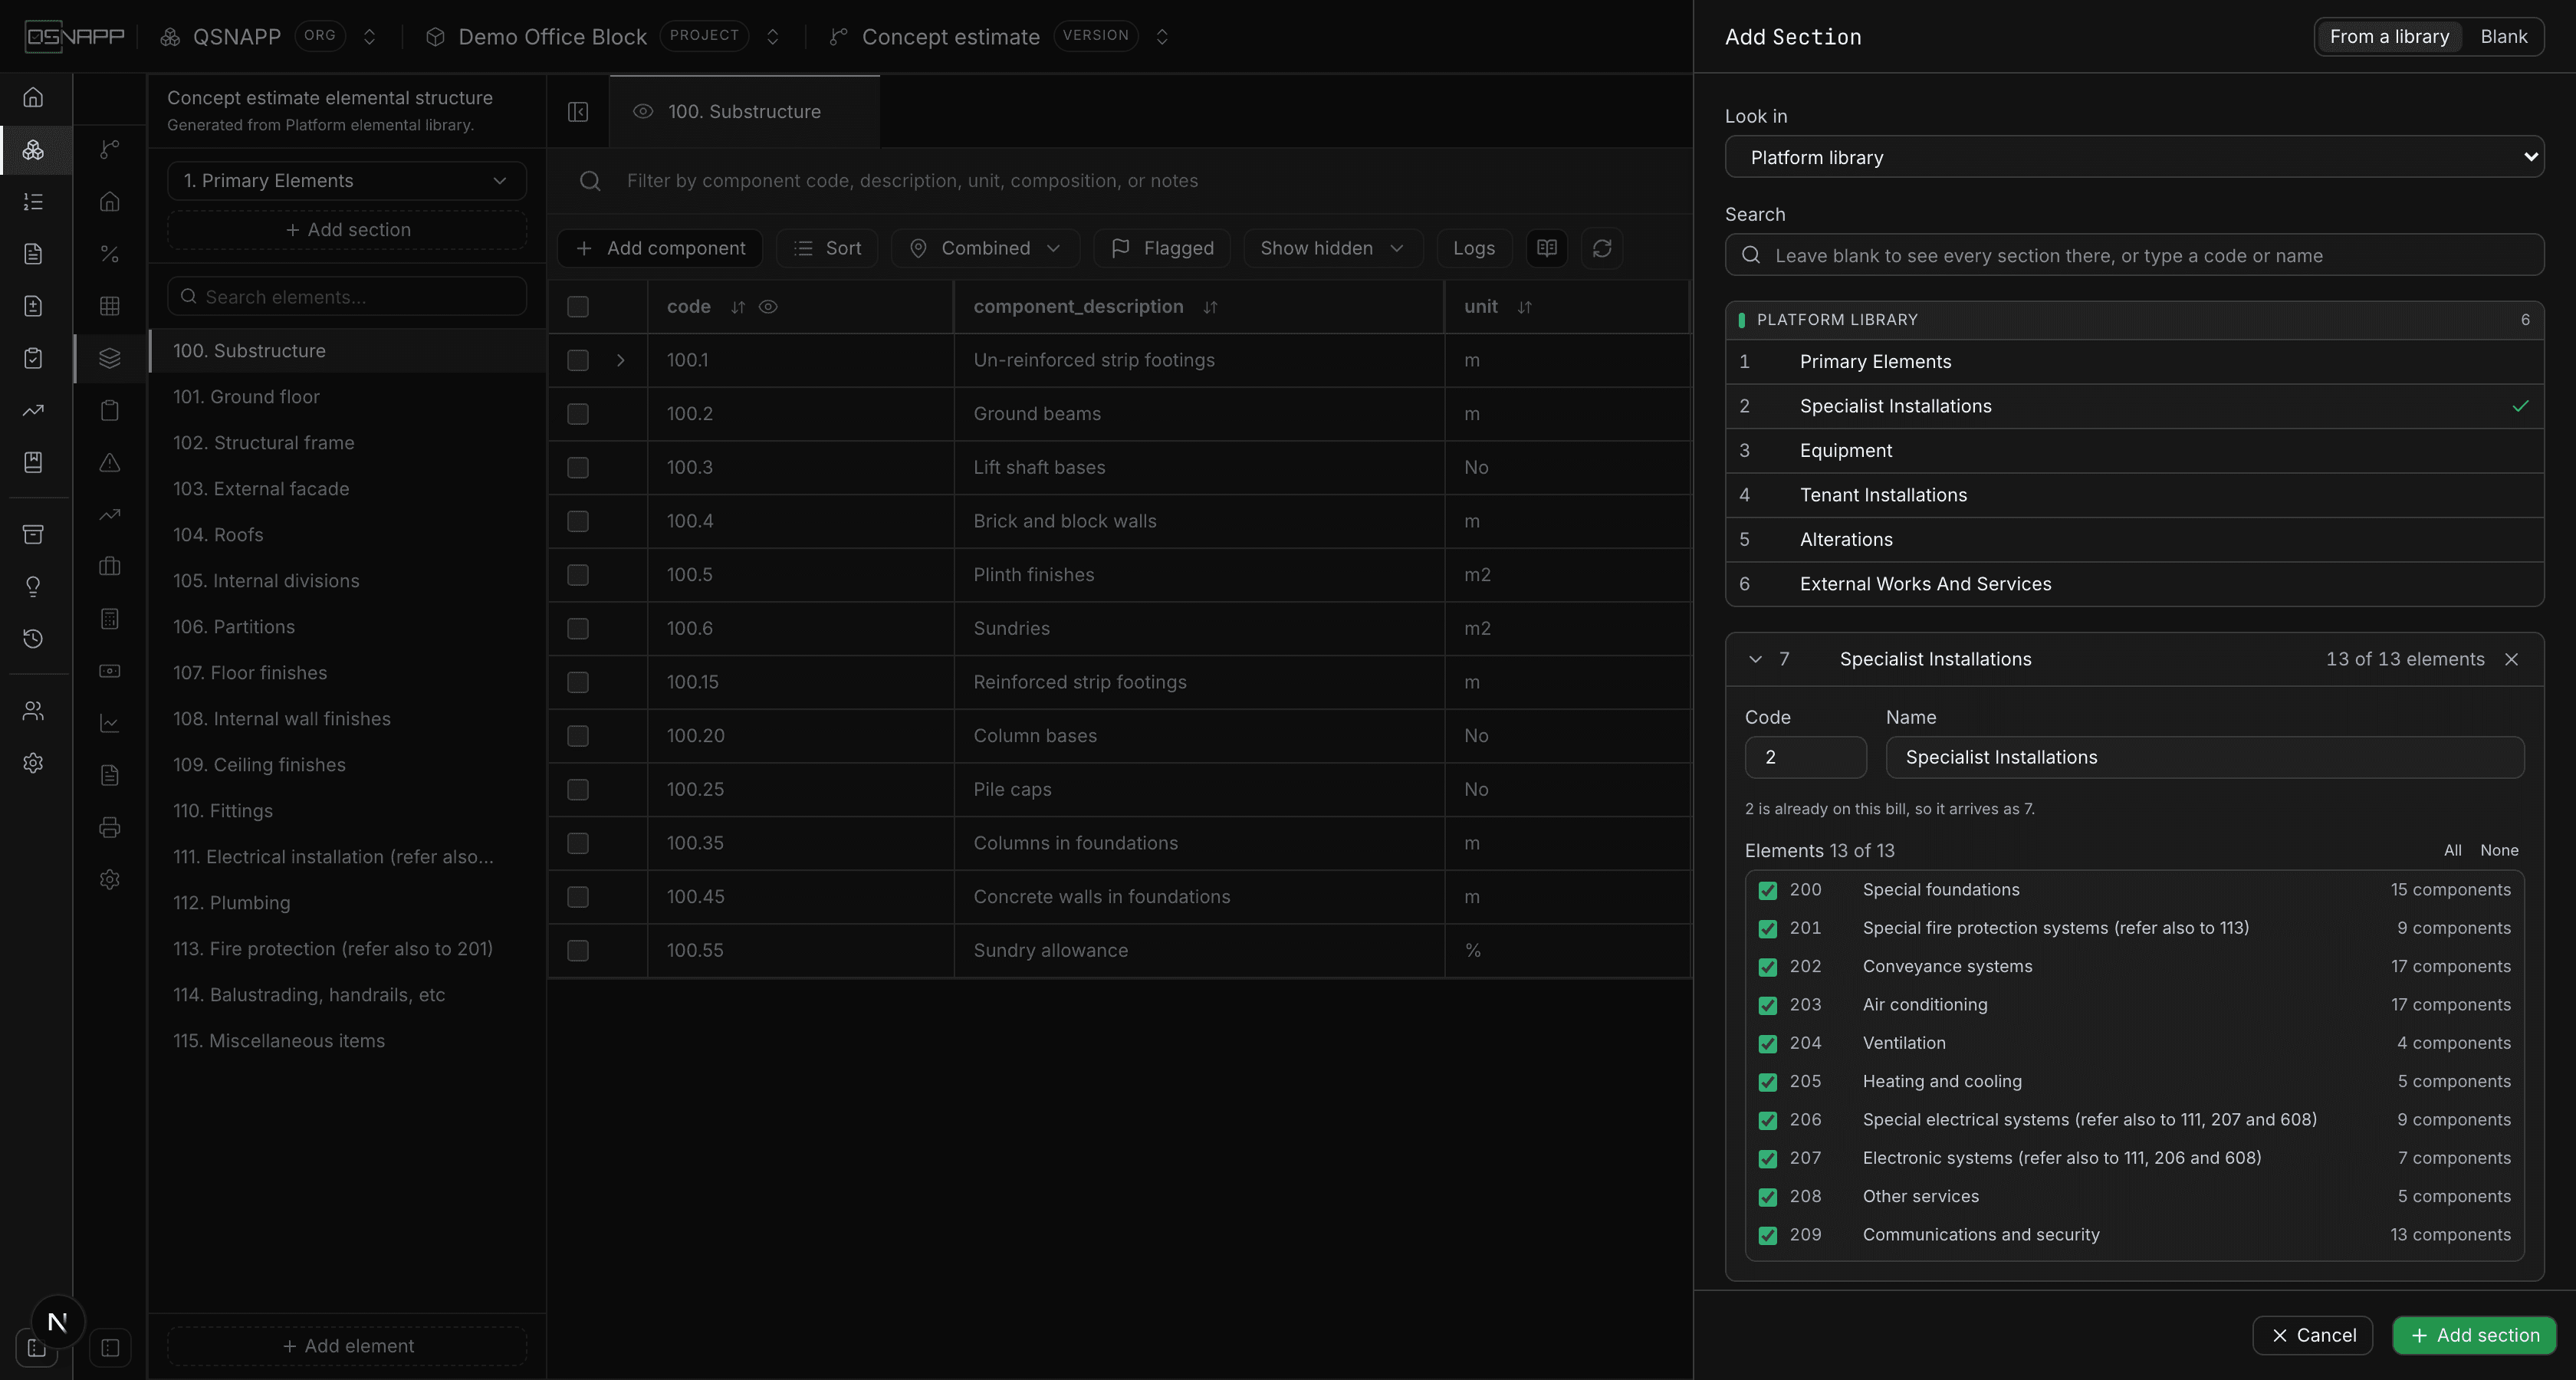
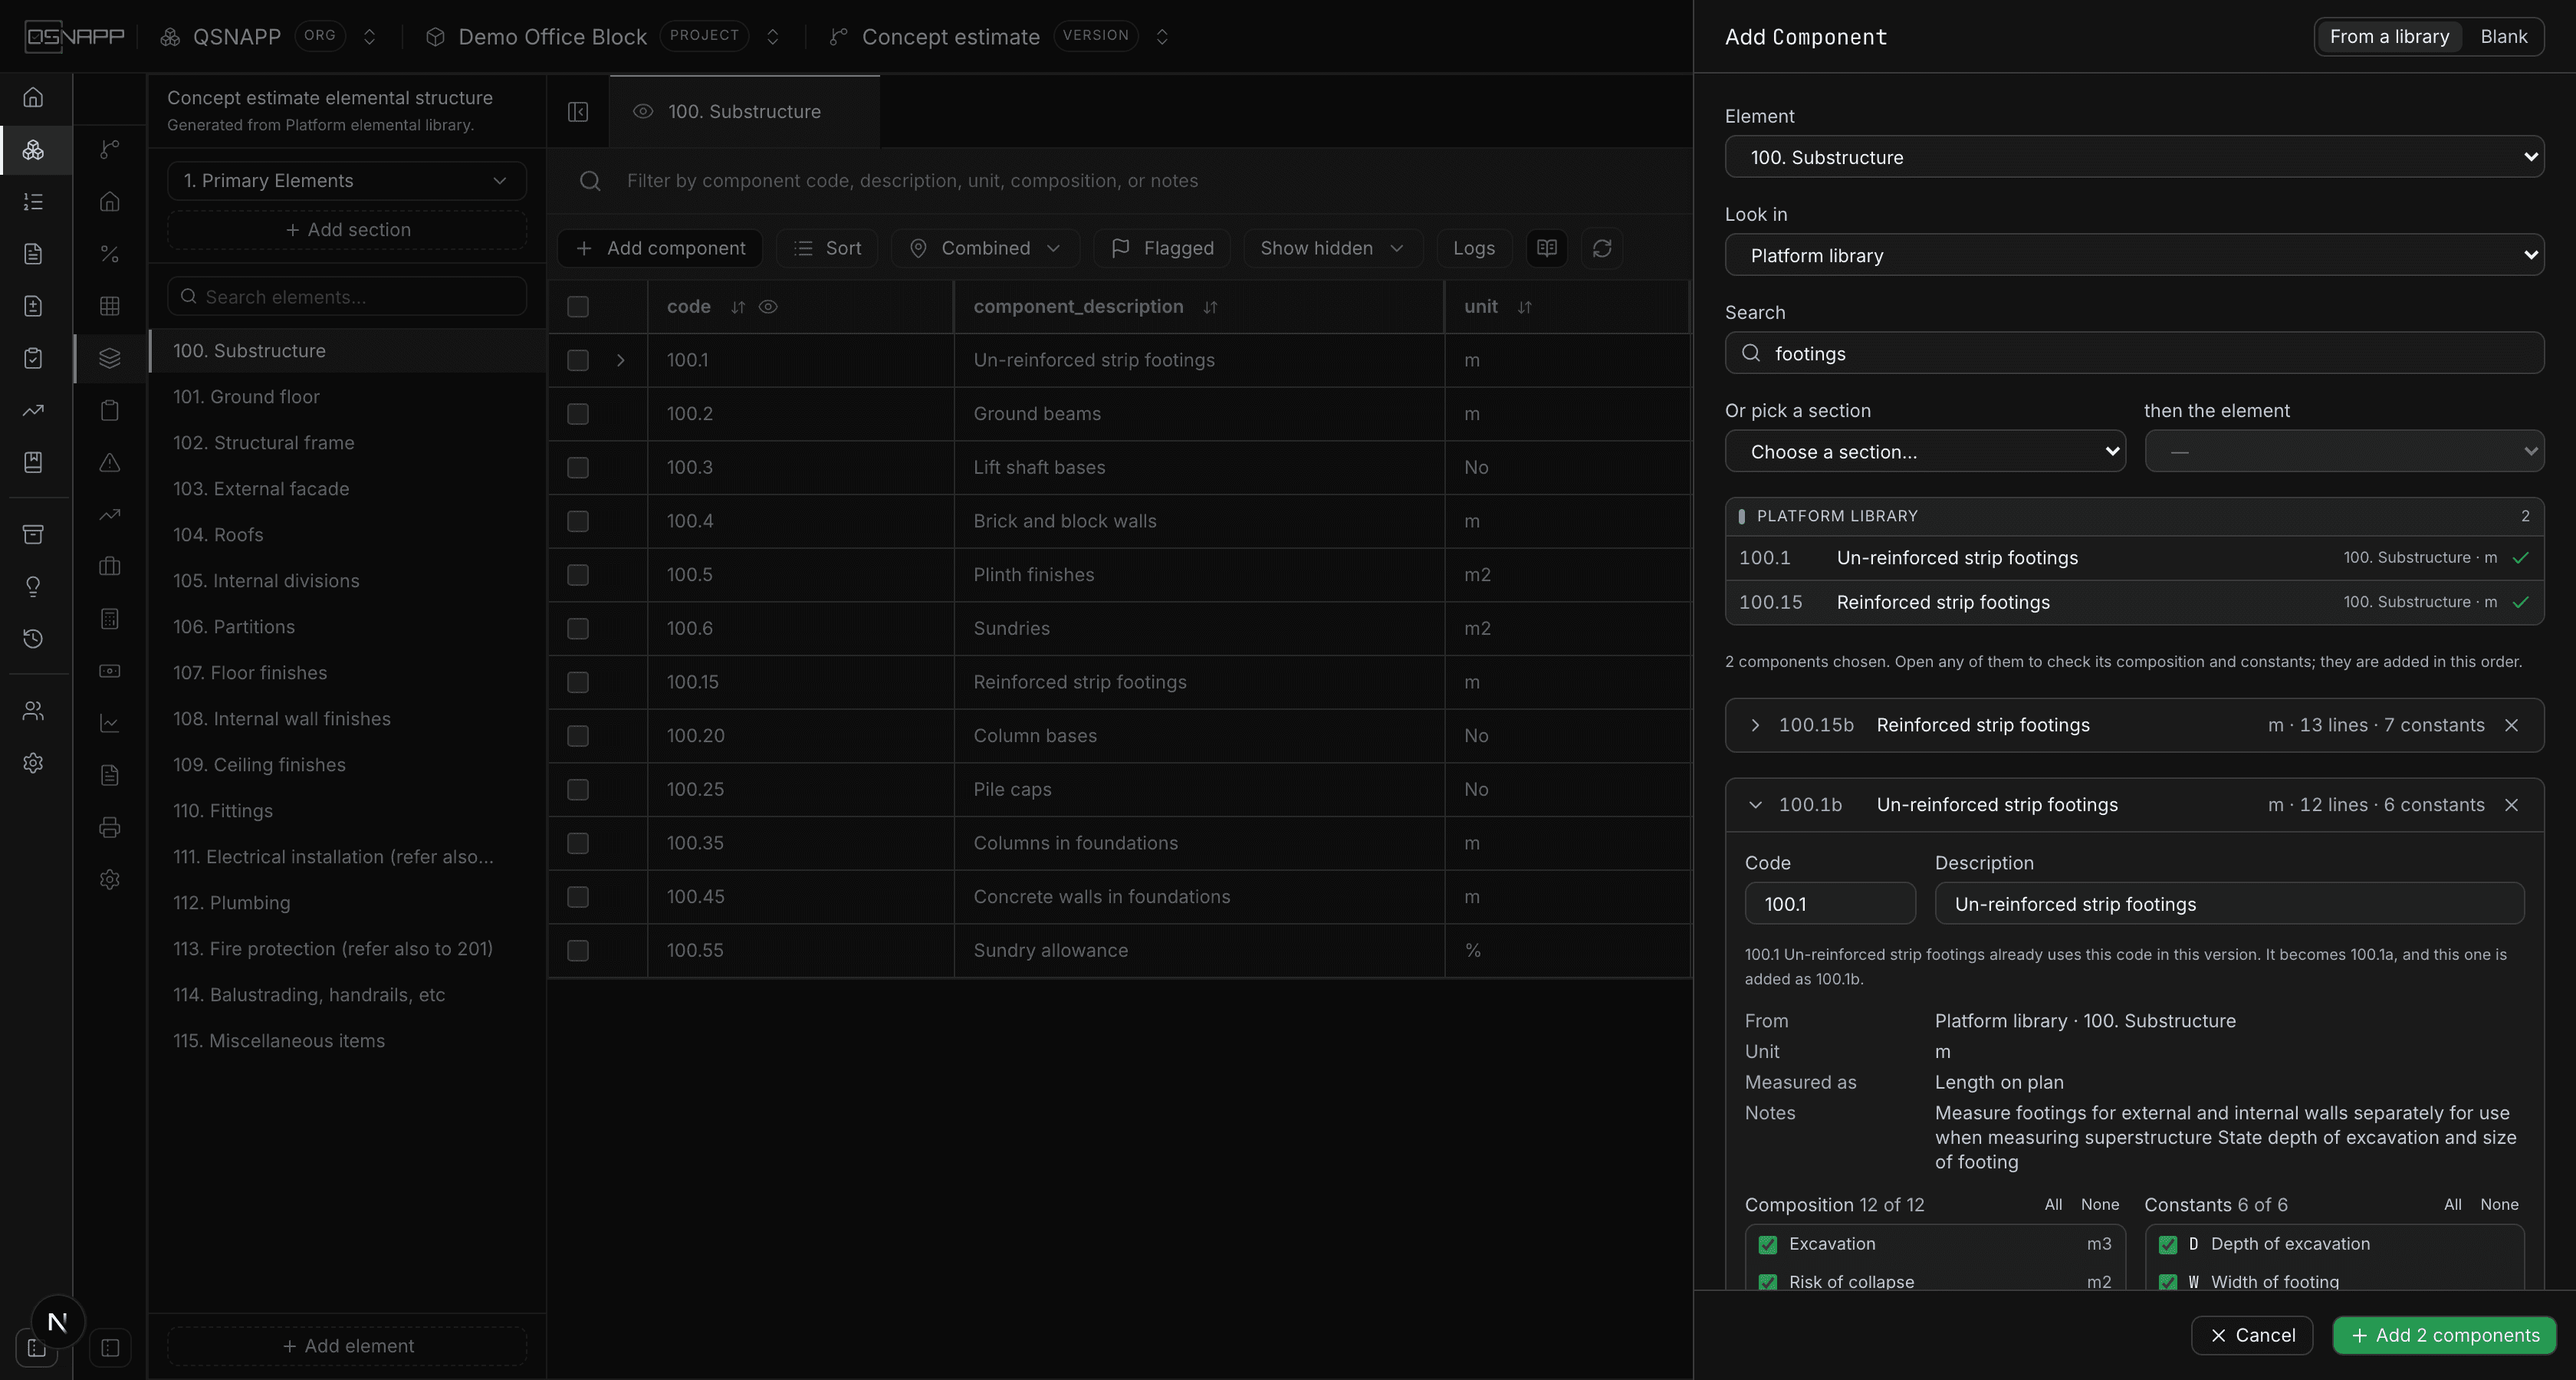
You can pick several at once. Each result you choose opens its own card — with its code, its description and its ticks — and the ones picked before it fold away but stay chosen. Add brings them all in one go, in the order you picked them, each taking a free code if the one it asks for is taken. Adding elements and sections works the same way.
Add element and Add section work the same way one and two levels up. An element comes with the components you tick, each with its own lines and constants; a section comes with the elements you tick, and every component under them. Each keeps its own code where the target does not already have it, and takes the next code where it does — the drawer says which before you add. Blank gives you the name; the code follows on from what is there.
Reordering components
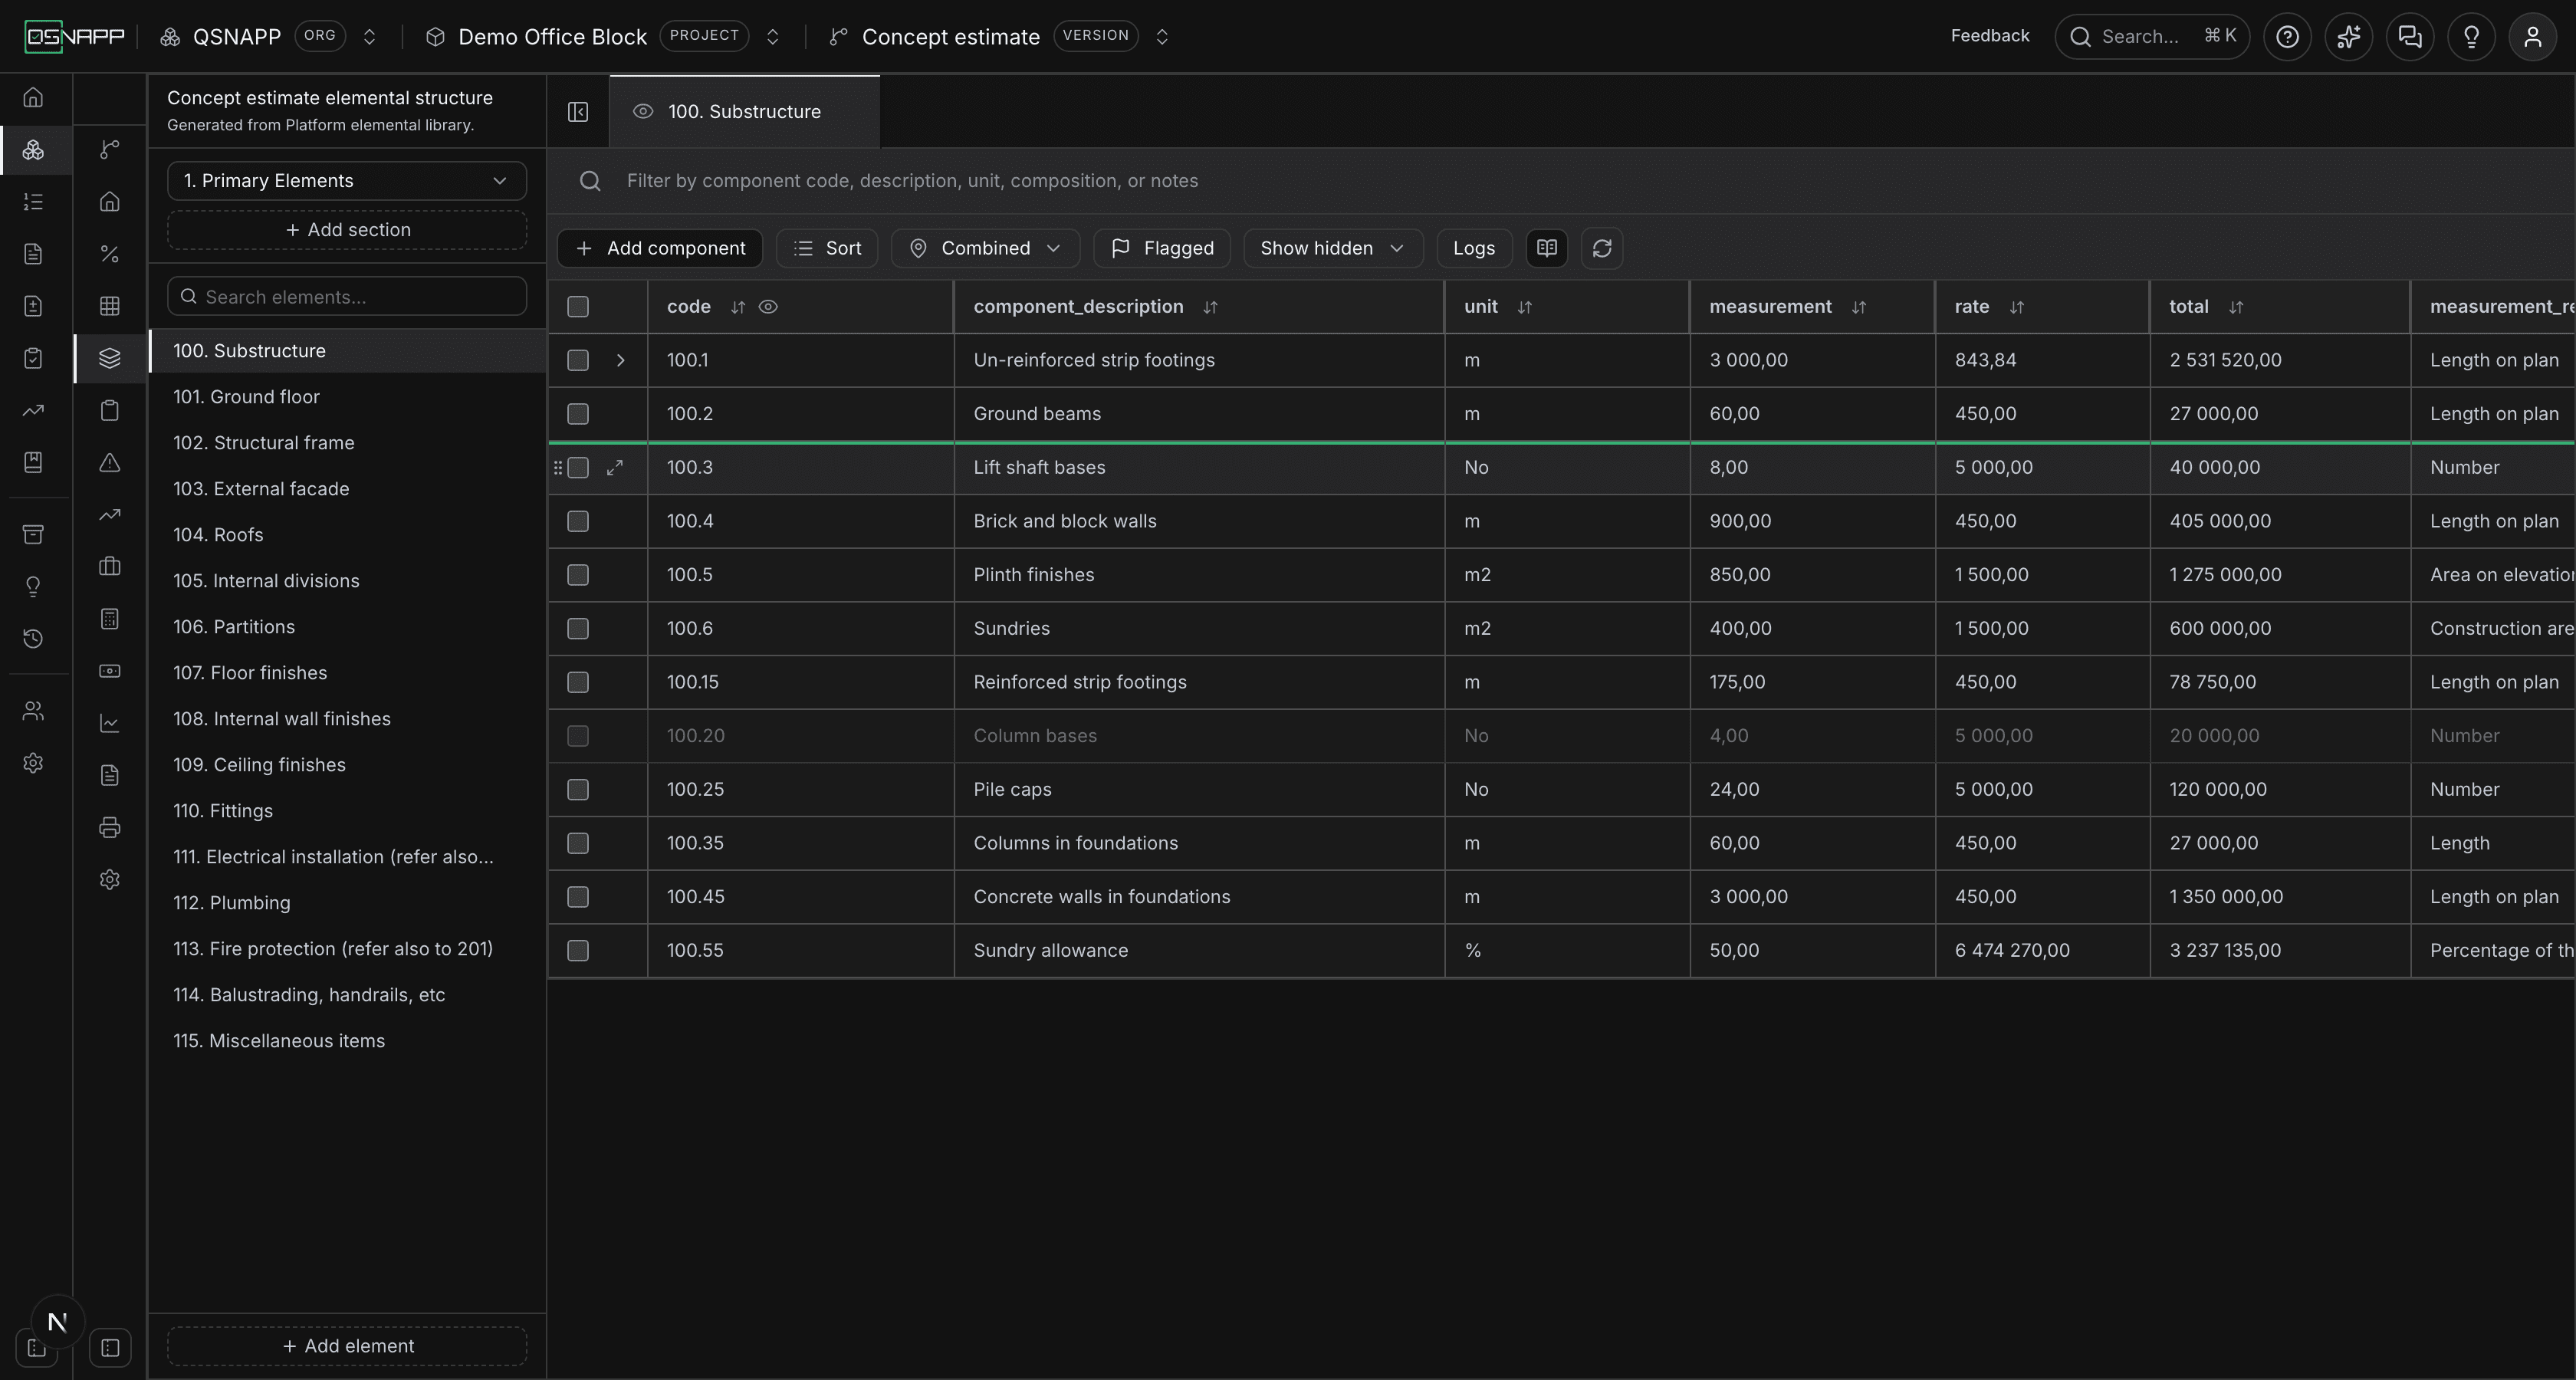
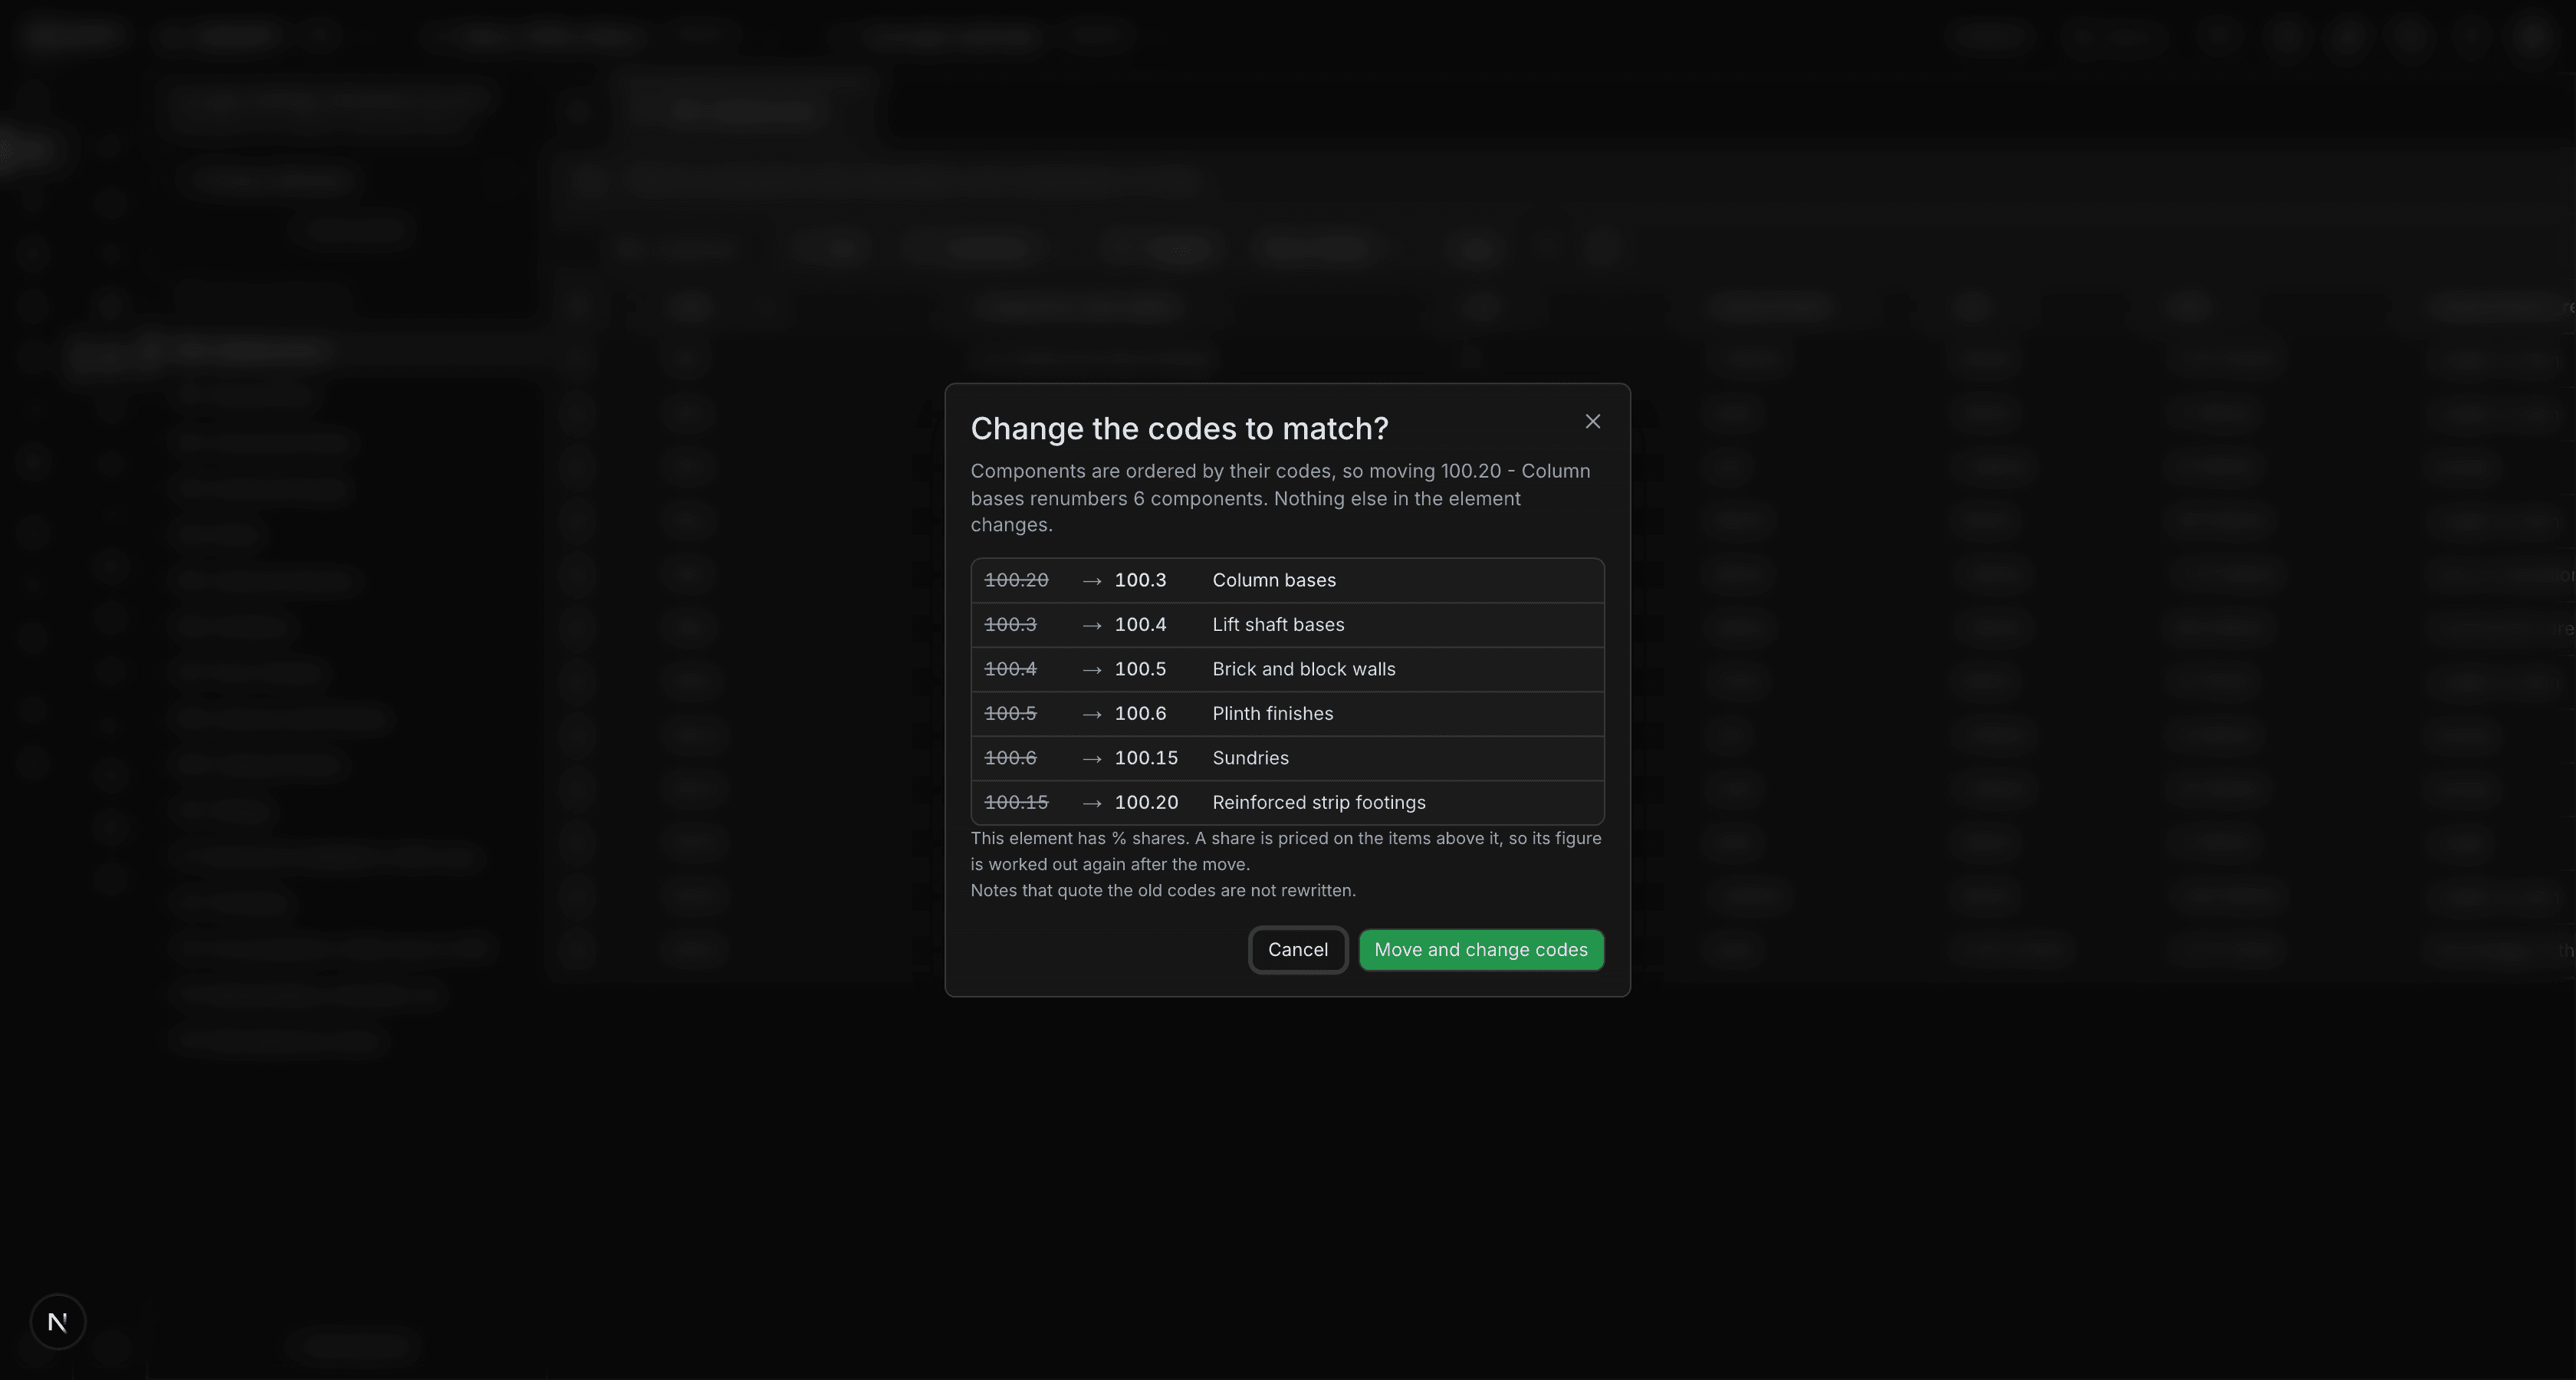
Drag a component by the handle at the left of its row to move it within its element. The order of an element is its codes — the grid, the printed estimate and the shares all read components in code order — so a move is a renumbering: drop 100.20 between 100.2 and 100.3 and it becomes 100.3, and the rows it passed each take the code of the slot below. Before anything changes you are shown every code that will move and asked to confirm. Only the rows between where the component was and where it lands are renumbered; notes that quote the old codes are not rewritten. A component with no code cannot be dragged, because moving it would mean numbering something you left unnumbered.
Editing and removing elements and sections
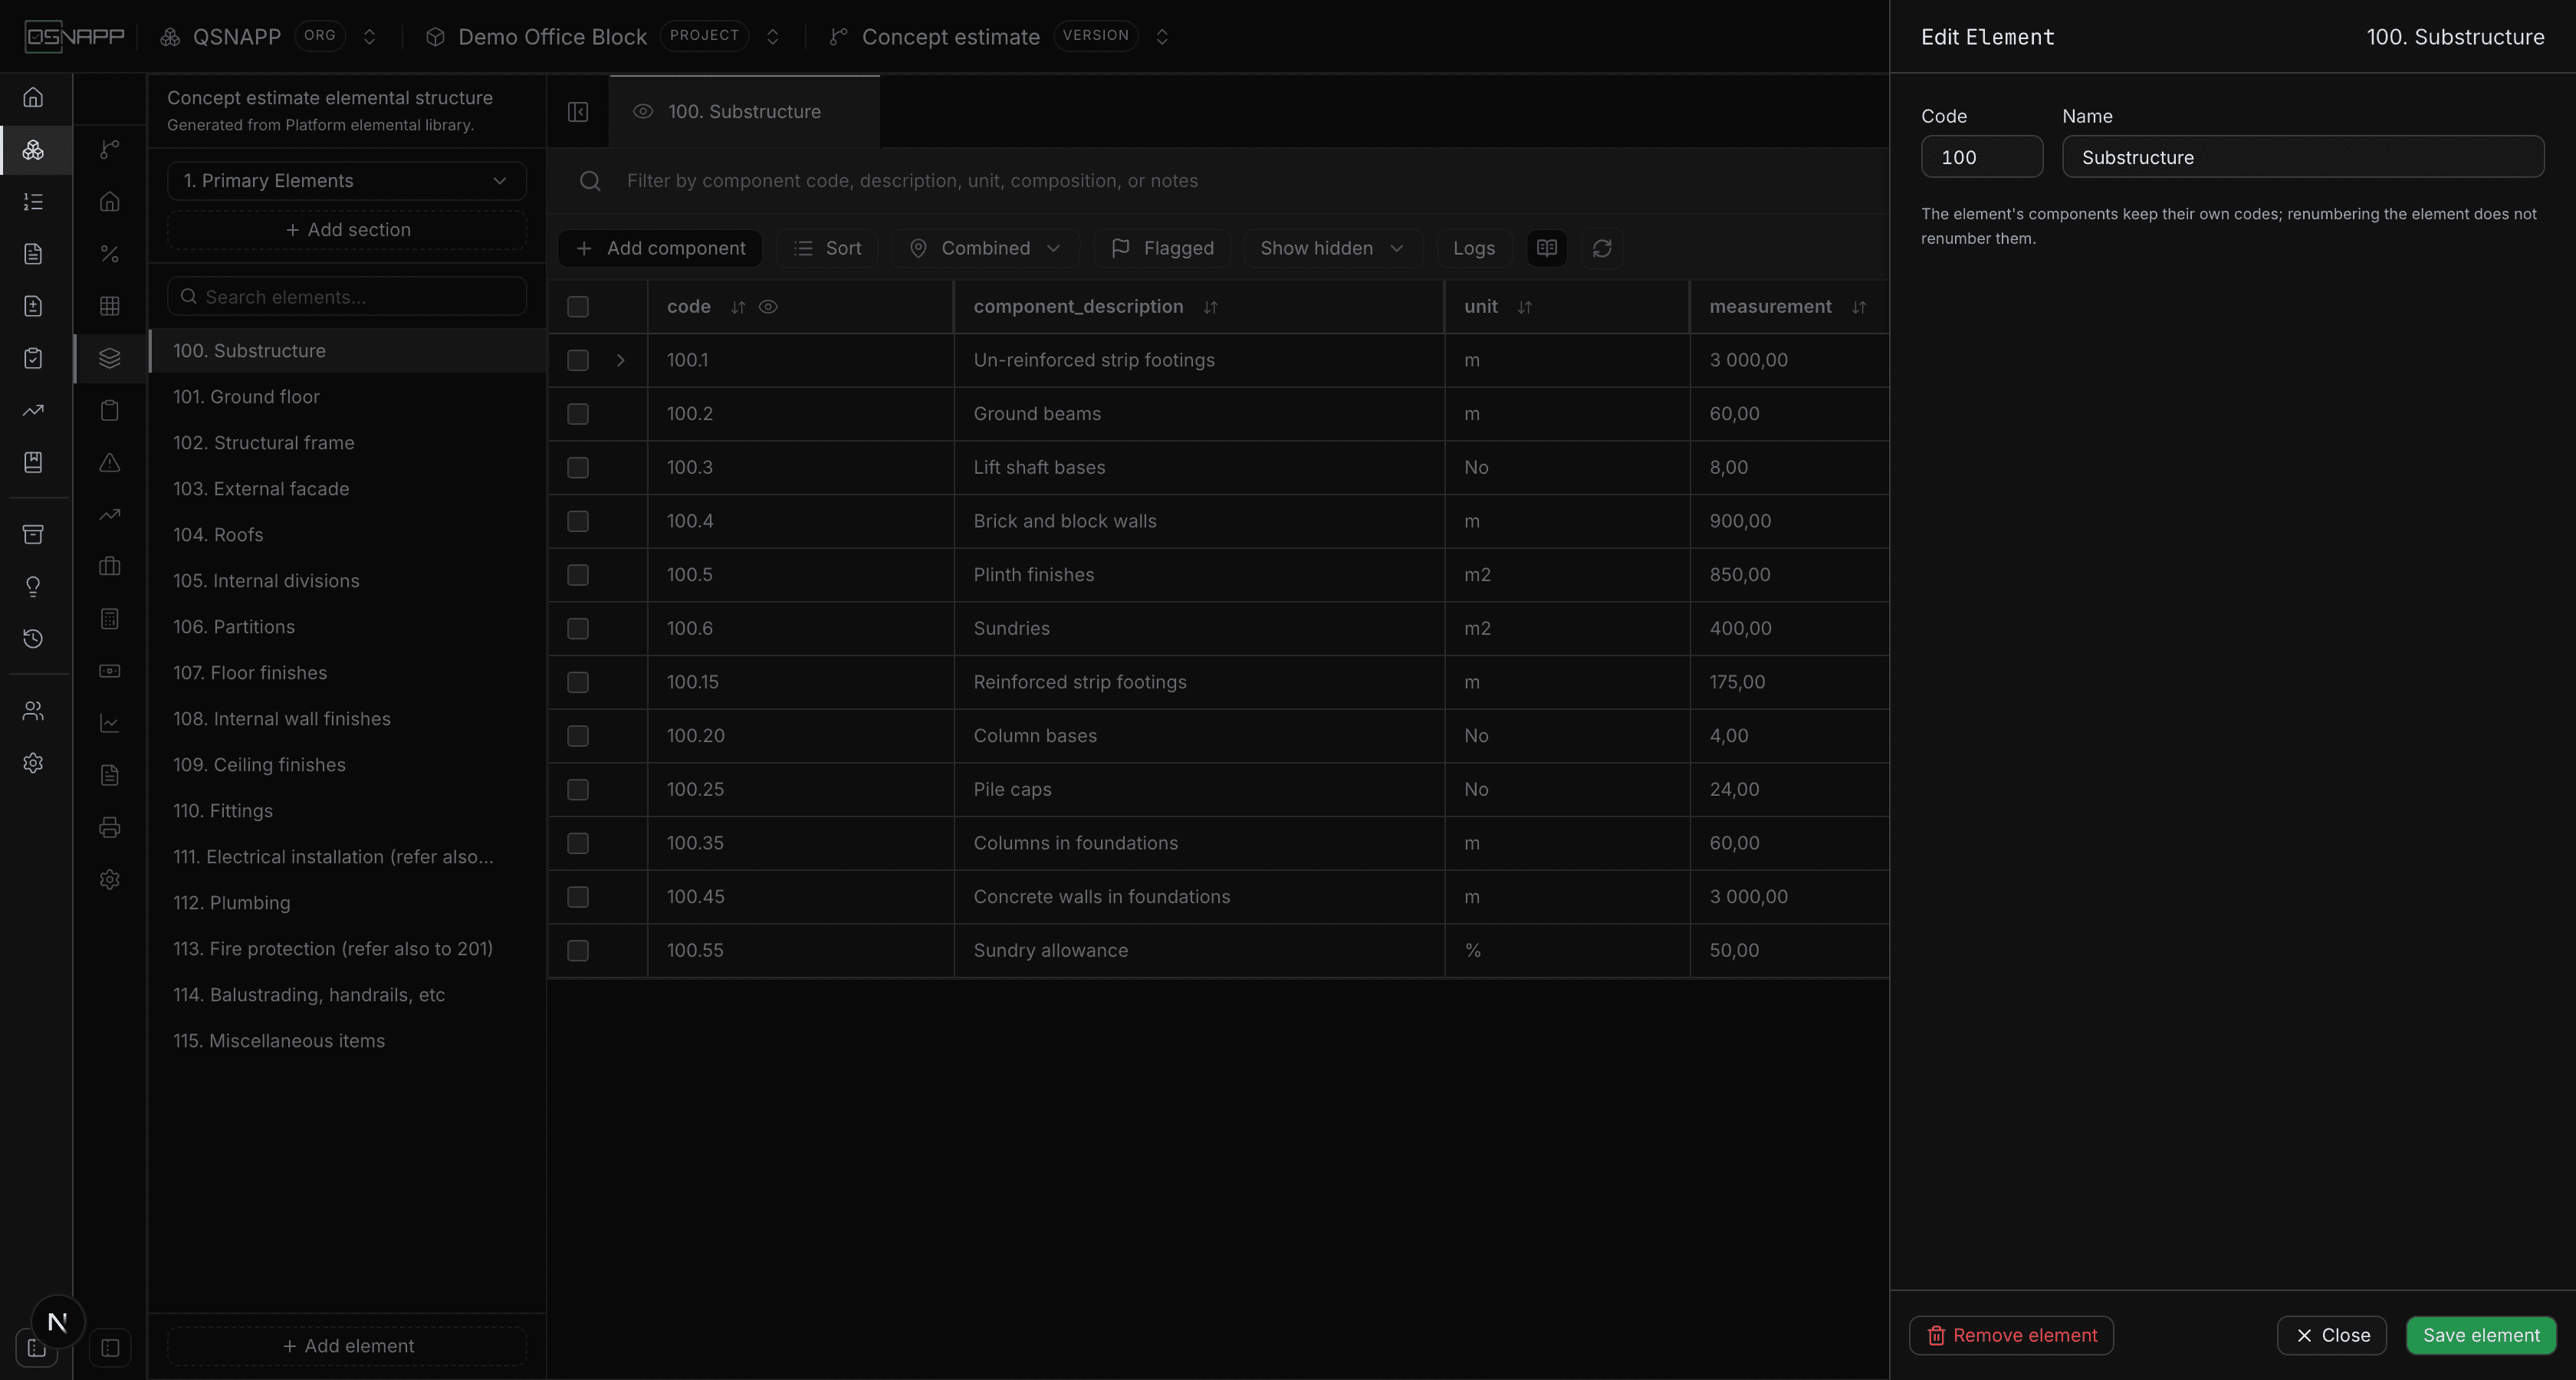
The pencil beside an element in the rail, and the edit action on a section, open a drawer with the code and the name. A code already used beside it is refused by name. Renumbering an element leaves its components' codes alone — they are theirs, not derived from the element's.
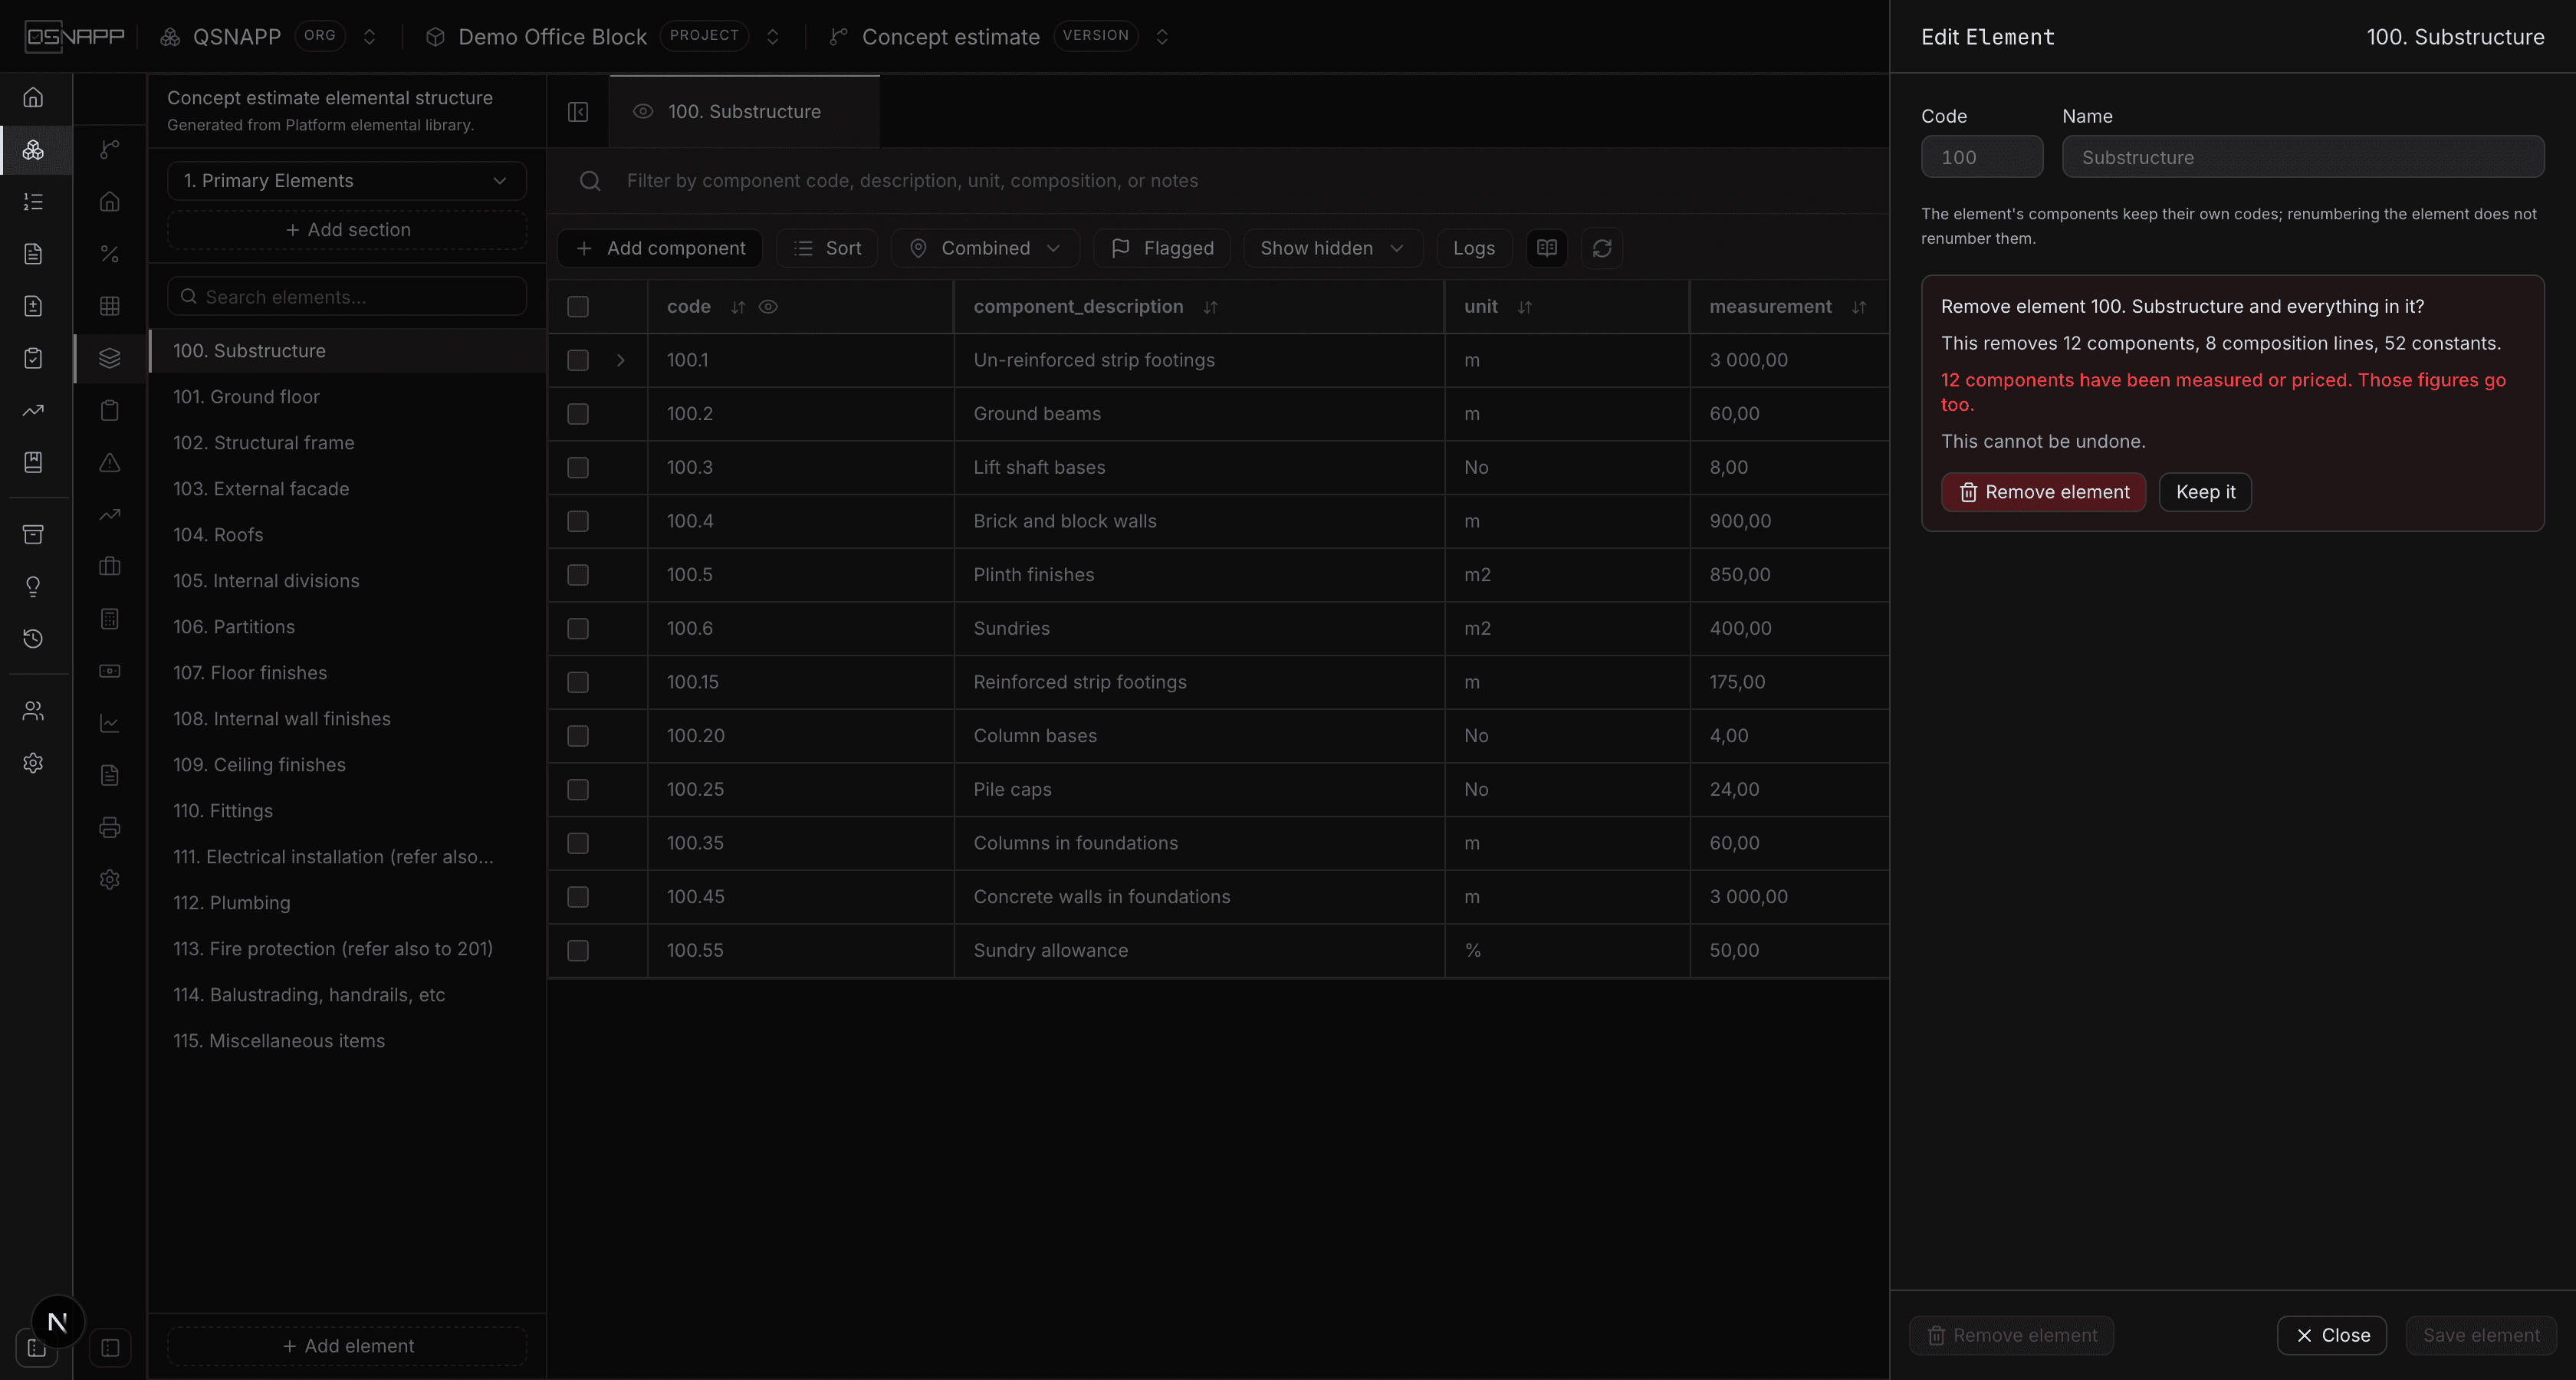
Remove sits bottom-left, away from Save. Pressing it counts, from the database rather than from what happens to be on screen, what would go with the element or section: the elements, components, composition lines, constants and links to the bill of quantities under it — and, on its own line, how many of those components have been measured or priced. Then Remove or Keep it. Links to the bill go first, because a component that has gone must not leave a bill item taking a quantity from nothing; the rest follows.
Reading the grid
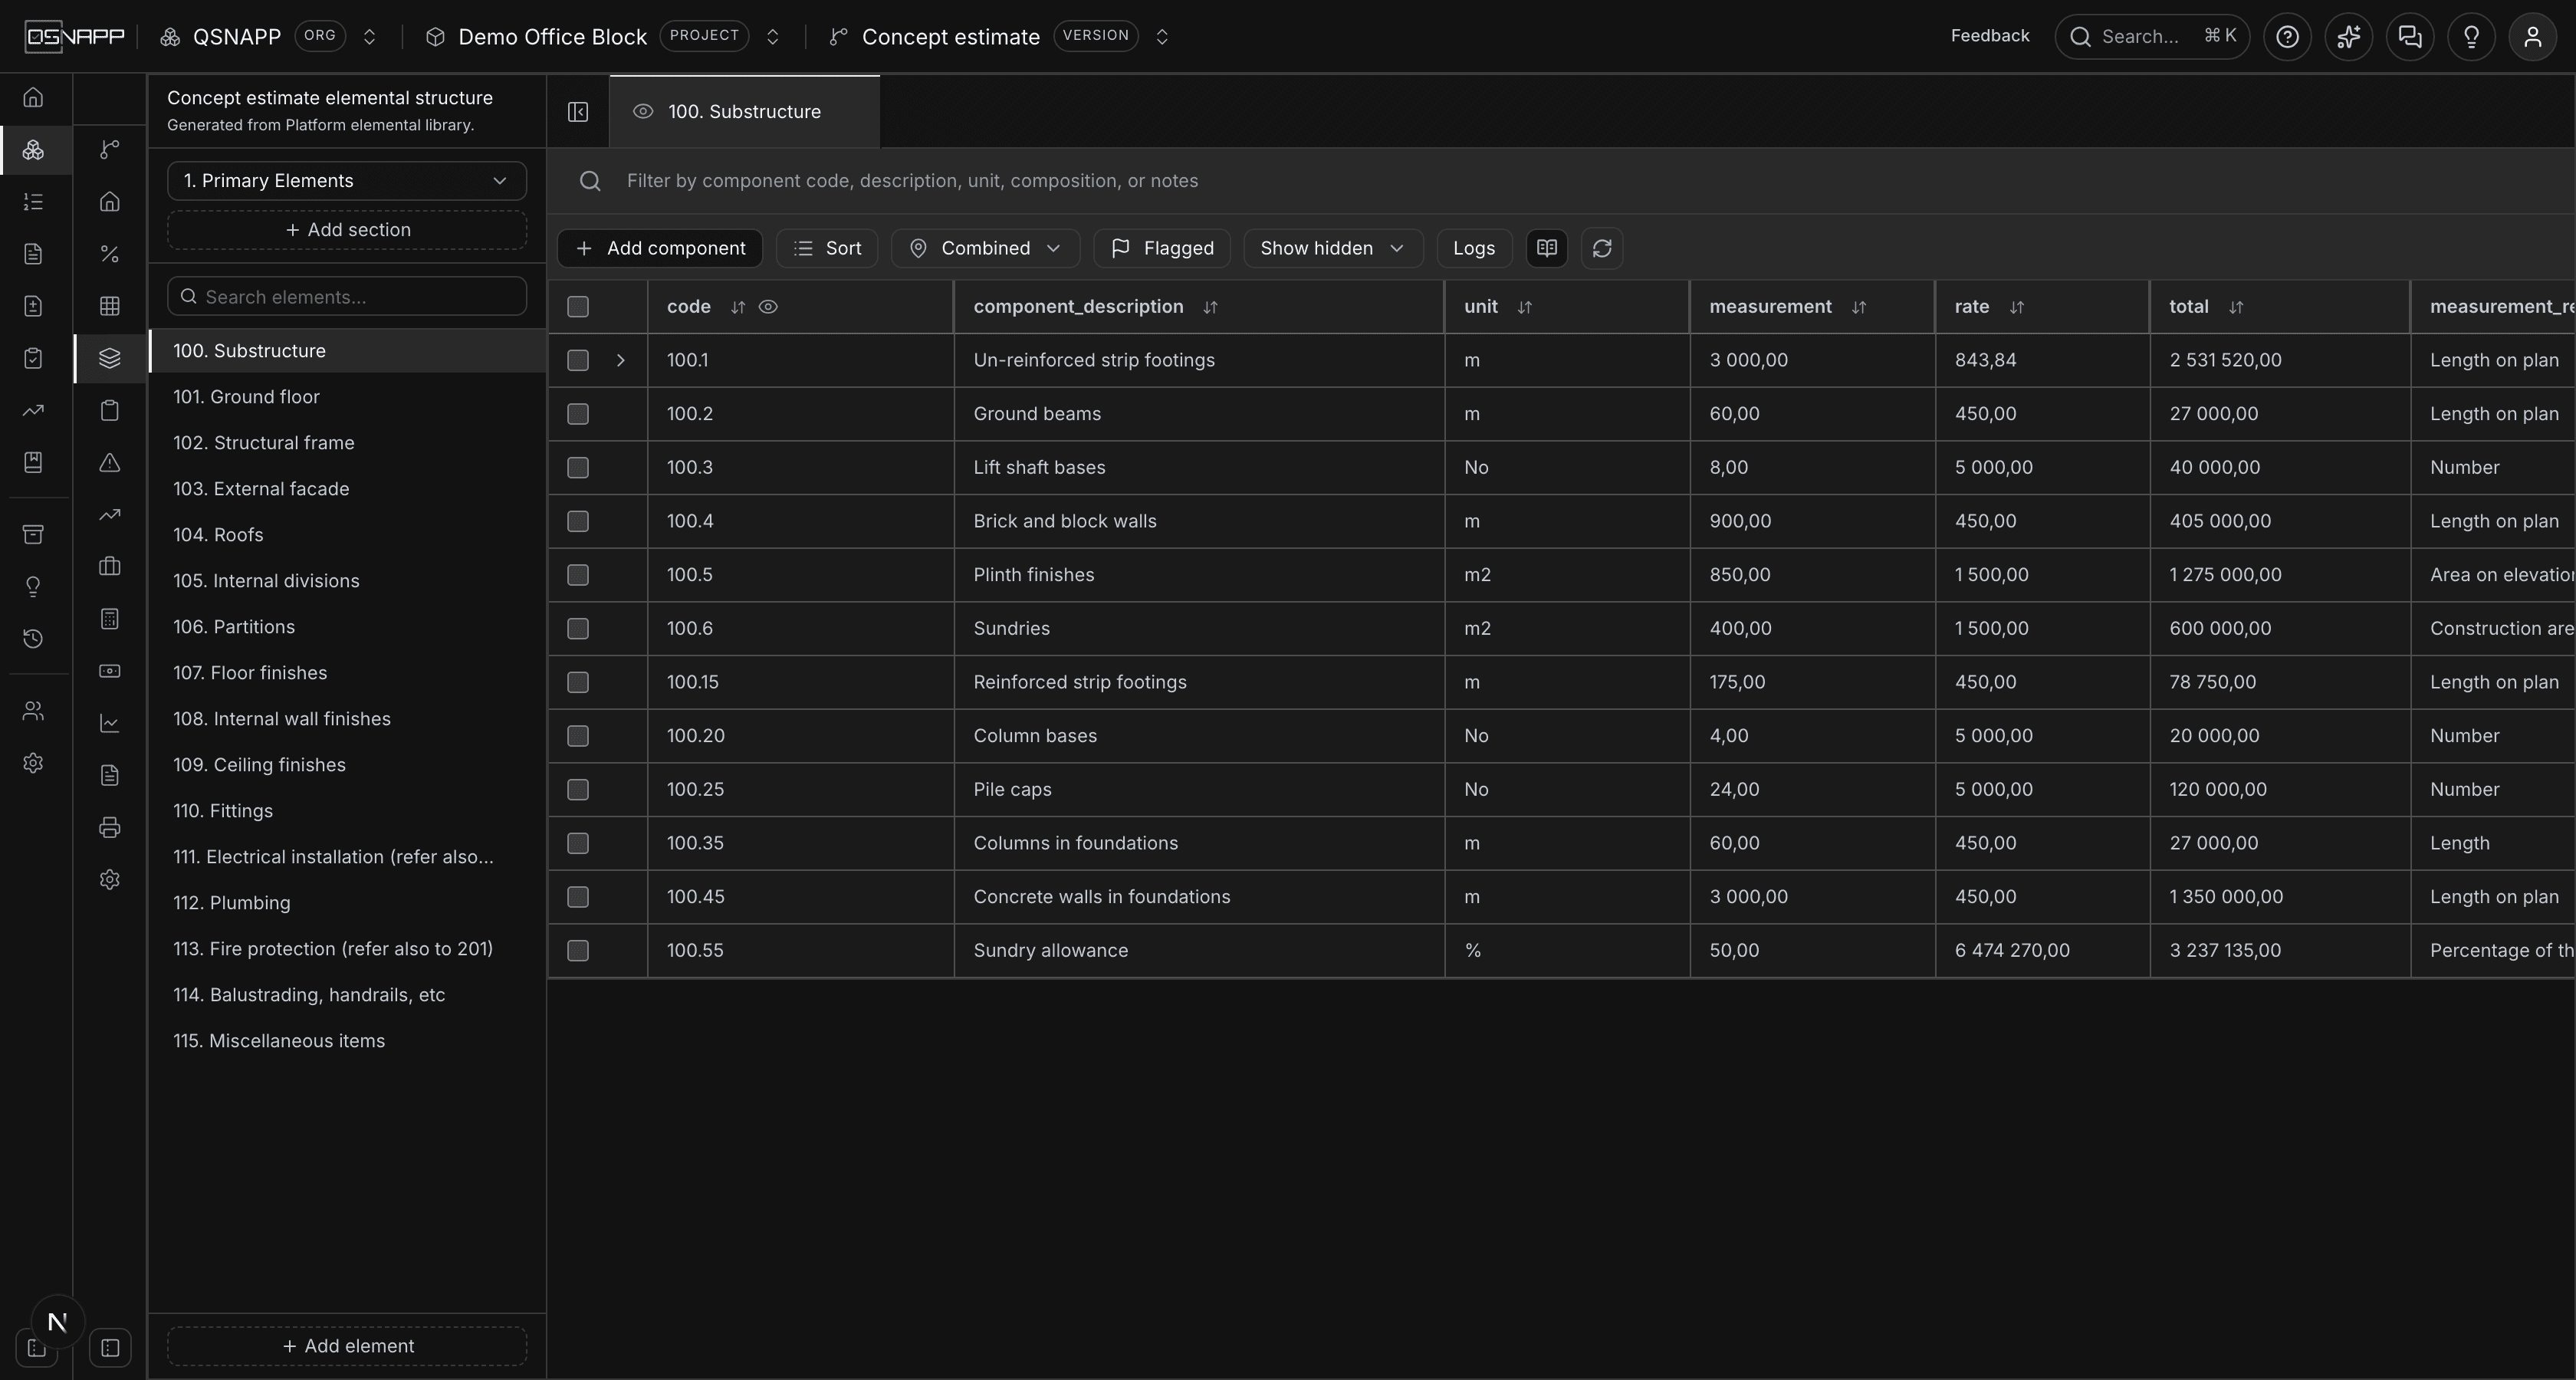
Each row is one component. The columns are:
| Column | What it holds |
|---|---|
code | The component's number in the elemental structure. |
component_description | What is being priced. |
unit | How it is measured — m, m², m³, No, Item, kg. |
measurement | The quantity you have taken off — typed, or worked out by a formula over the component's constants (see Formulas in the measurement cell). |
rate | The price per unit. Typed, or worked out by the composition. |
total | Measurement × rate. Not editable — it is the product of the two beside it. |
measurement_required | What the standard says has to be measured for this component. |
composition | What the component is built from, and how many lines that build-up has. |
Double-click a cell to edit it. A changed cell is tinted until it is saved, so unsaved work is visible rather than remembered.
Choosing the columns
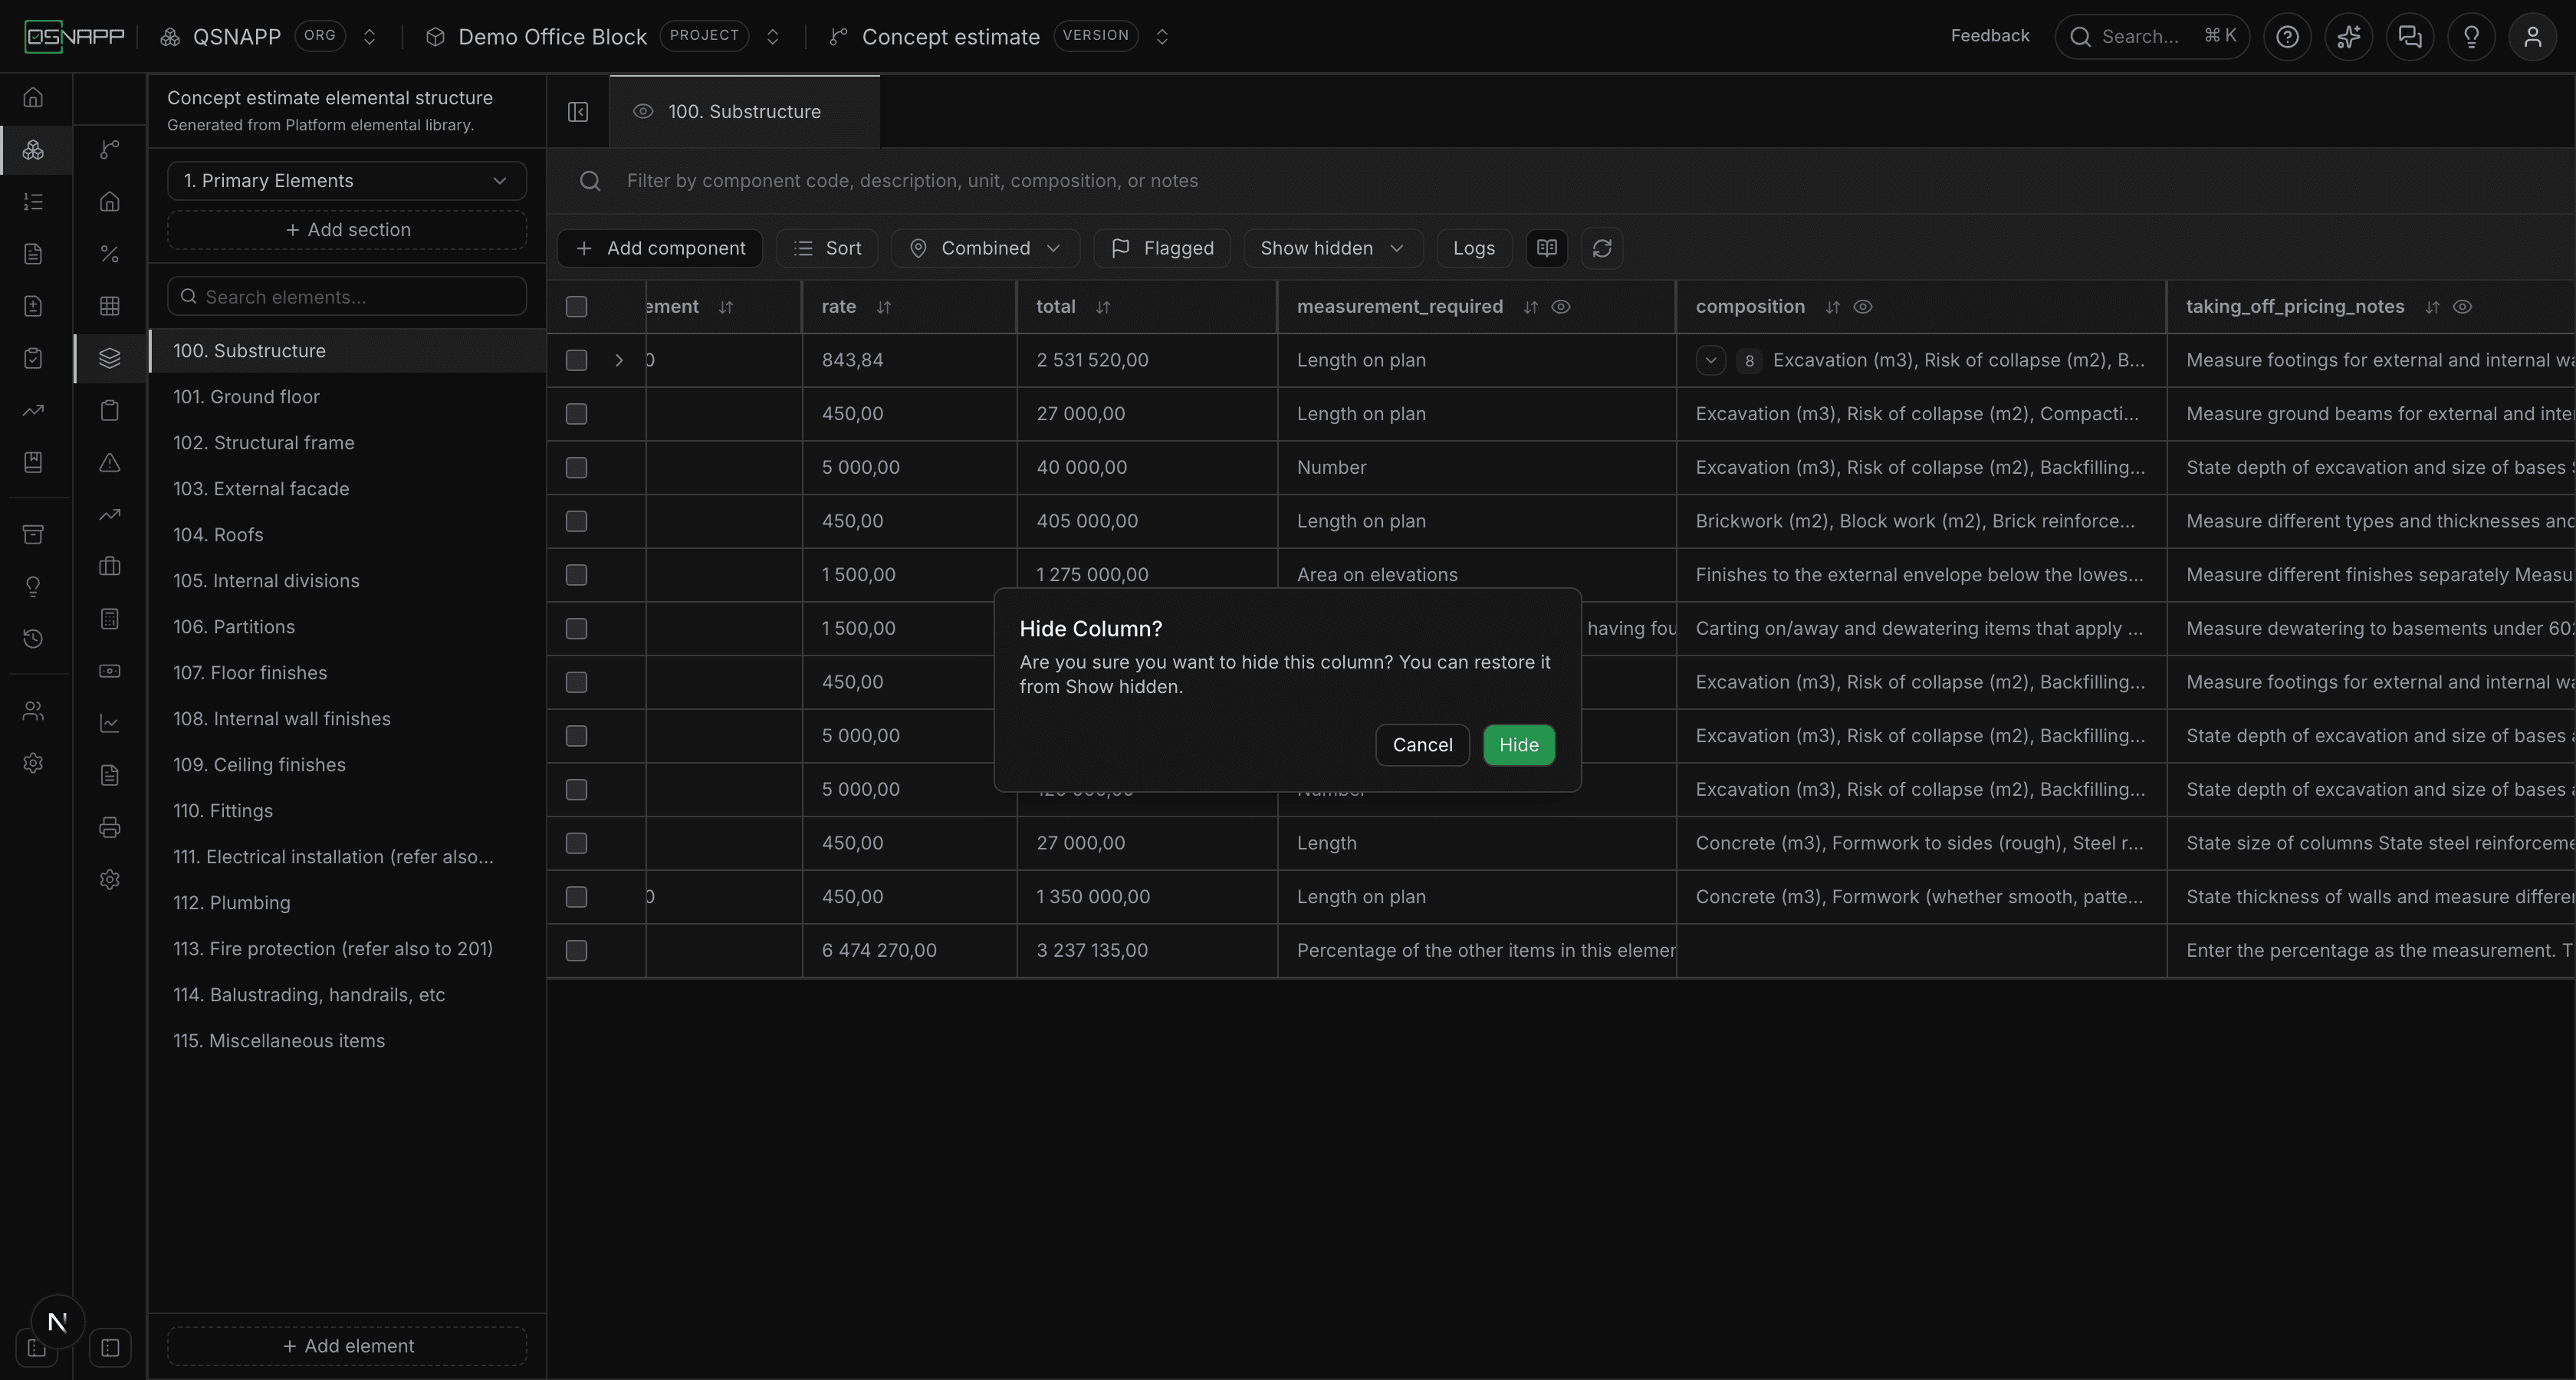
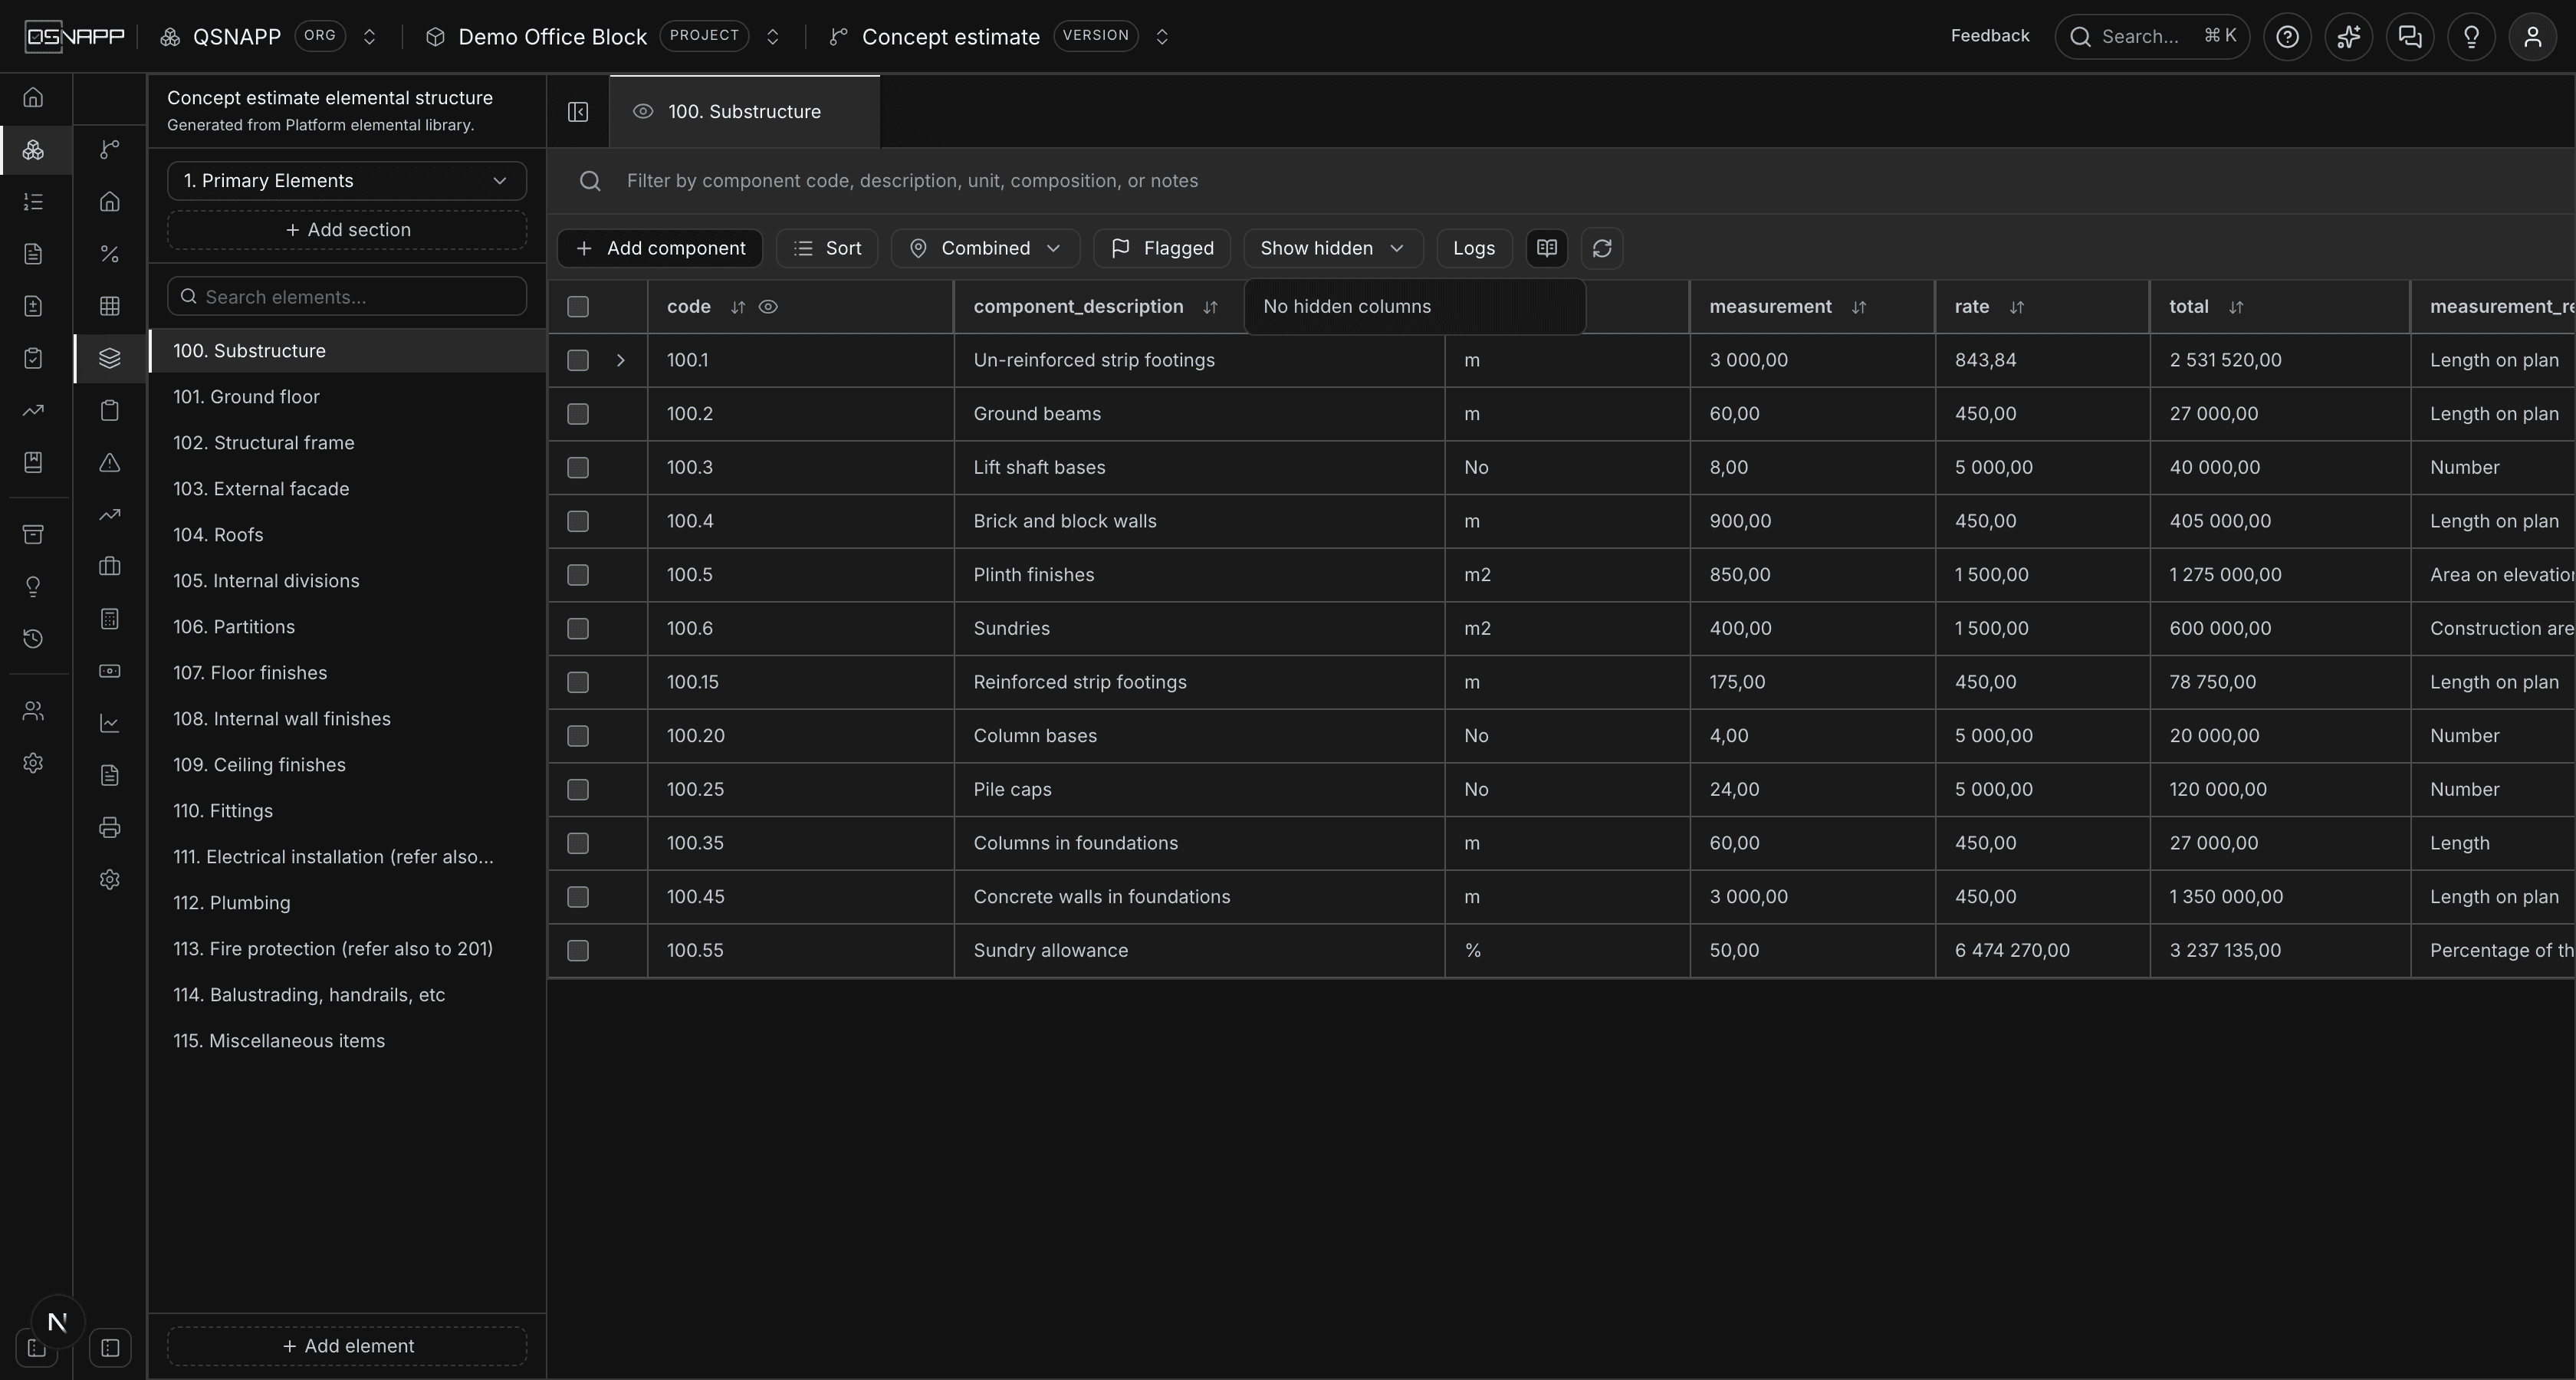
Headings carrying an eye can be put away — code, measurement_required, composition and taking_off_pricing_notes. Hidden columns come back from Show hidden in the toolbar. The choice is remembered per browser, so a grid you have narrowed stays narrowed next time.
Sorting
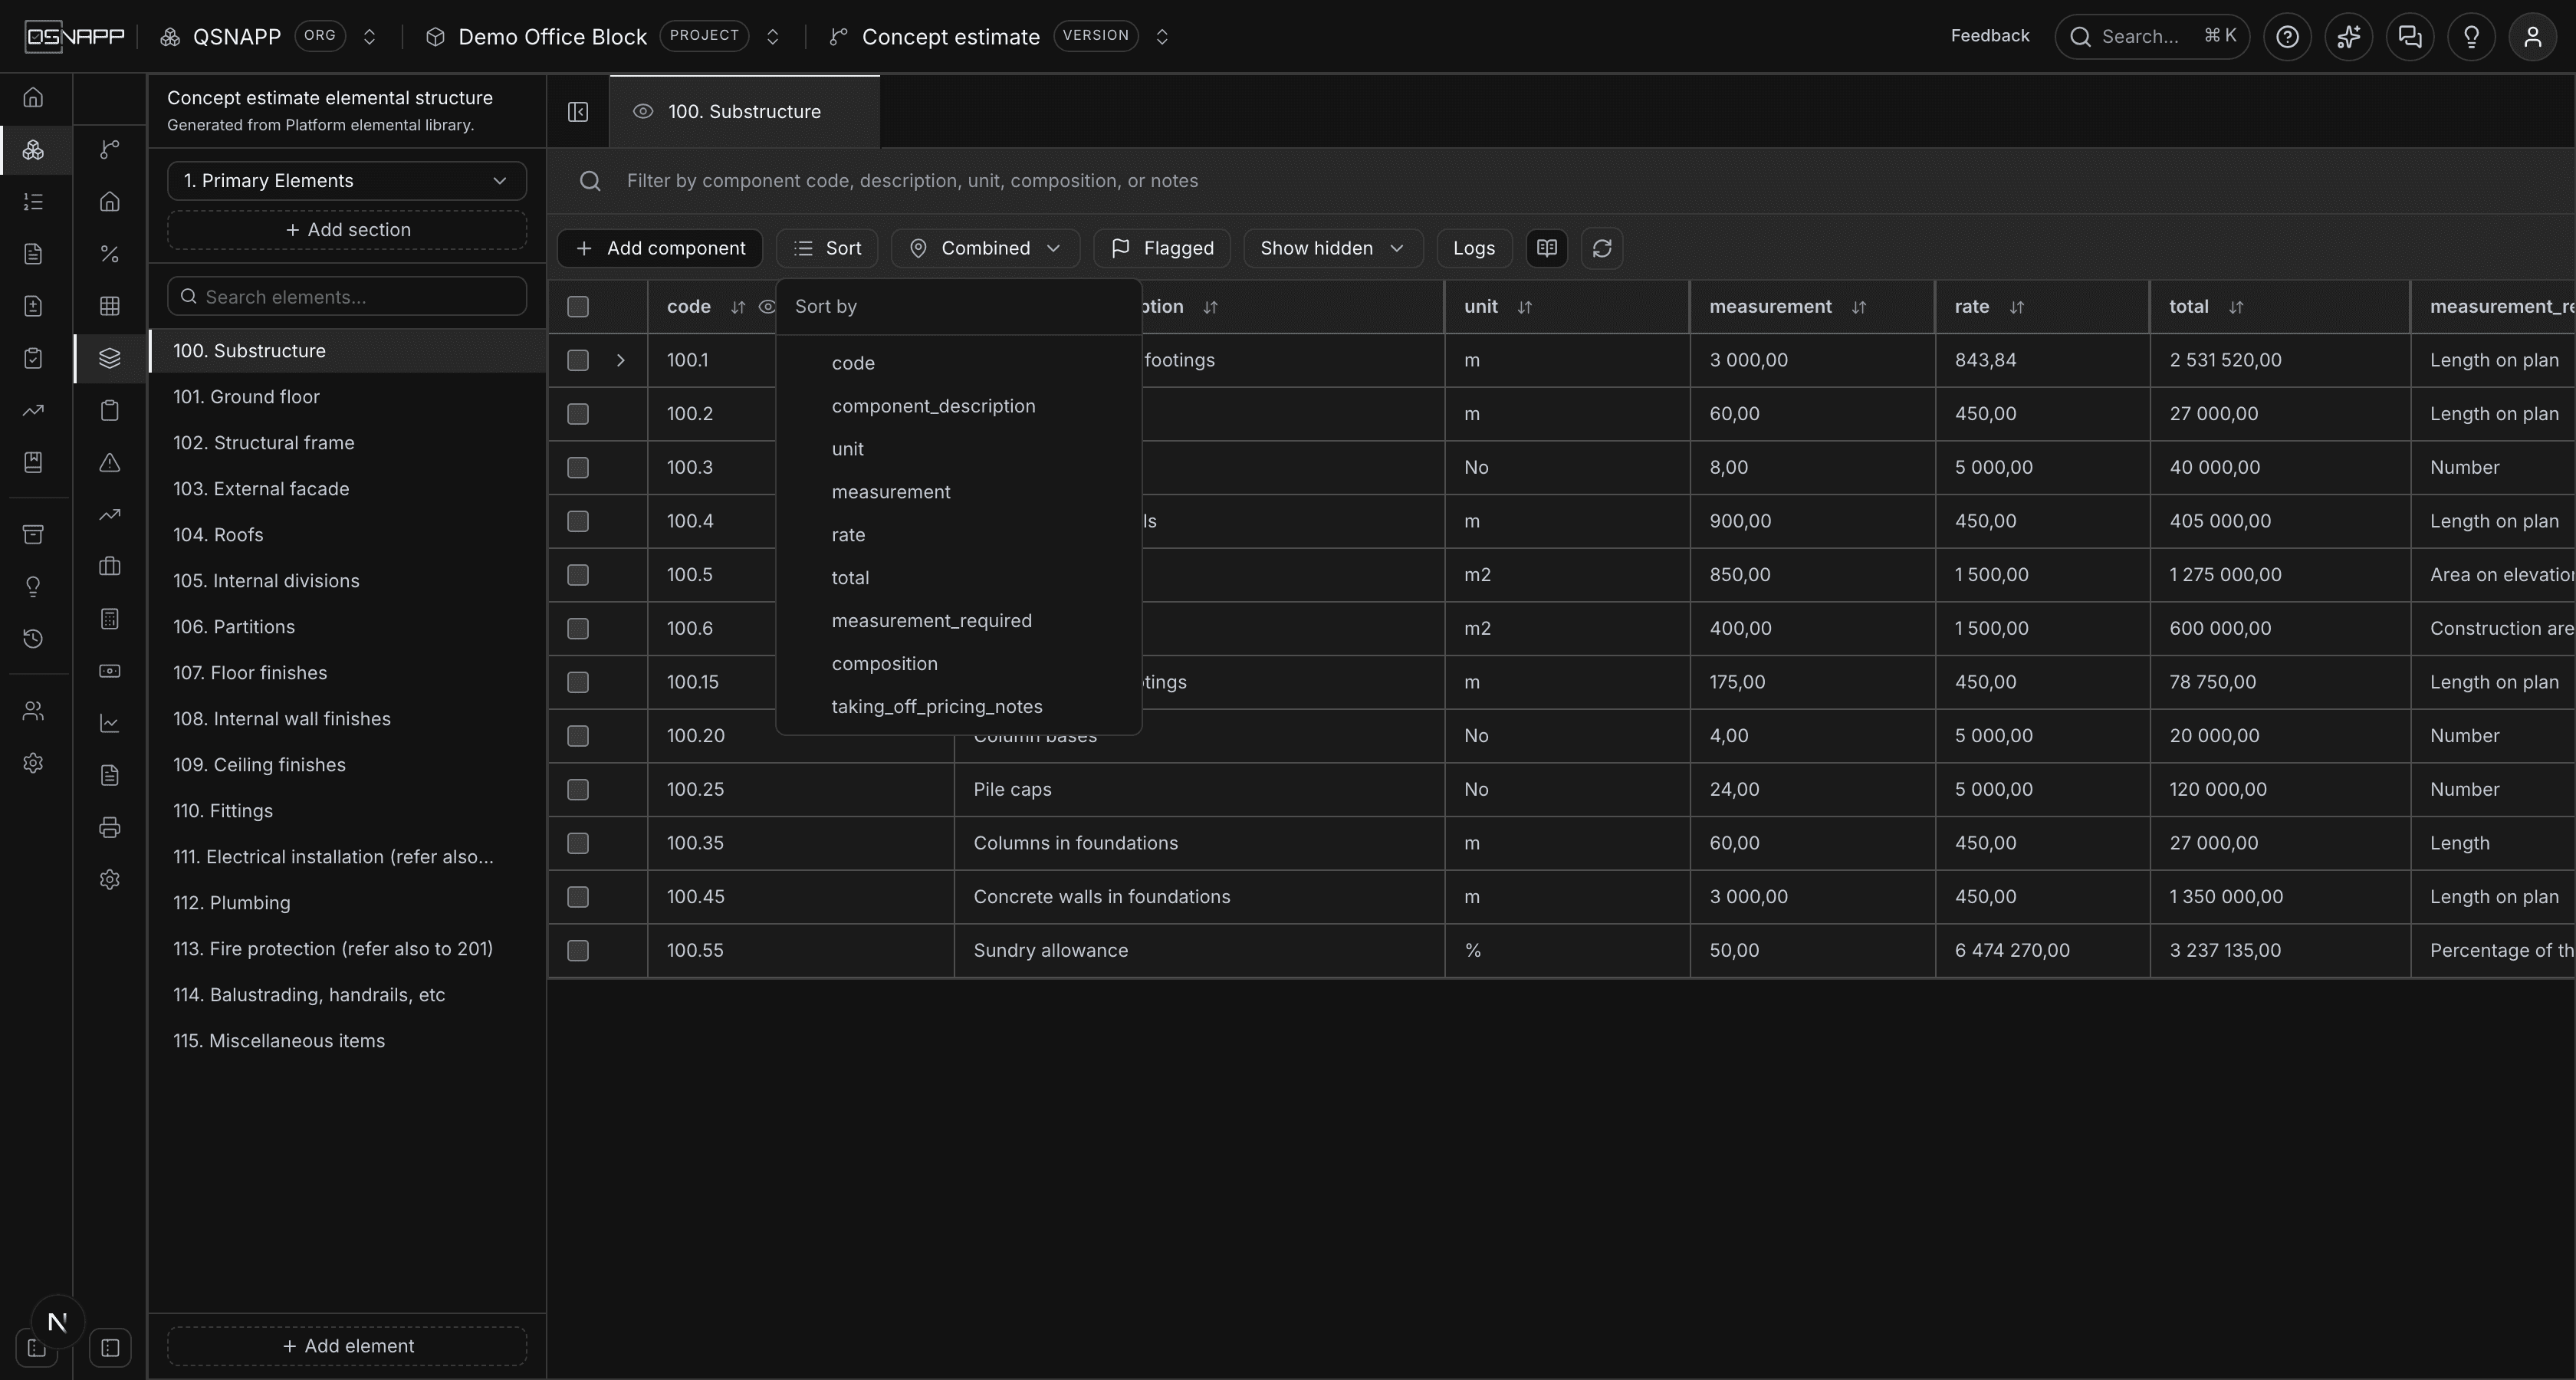
Sort in the toolbar lists the columns on screen, with ascending or descending and a way to clear it. The arrows on the column headings do the same thing. Sorting is held per element, and hiding the column you sorted by clears the sort rather than leaving the grid in an order nothing on screen explains.
Flagging a component
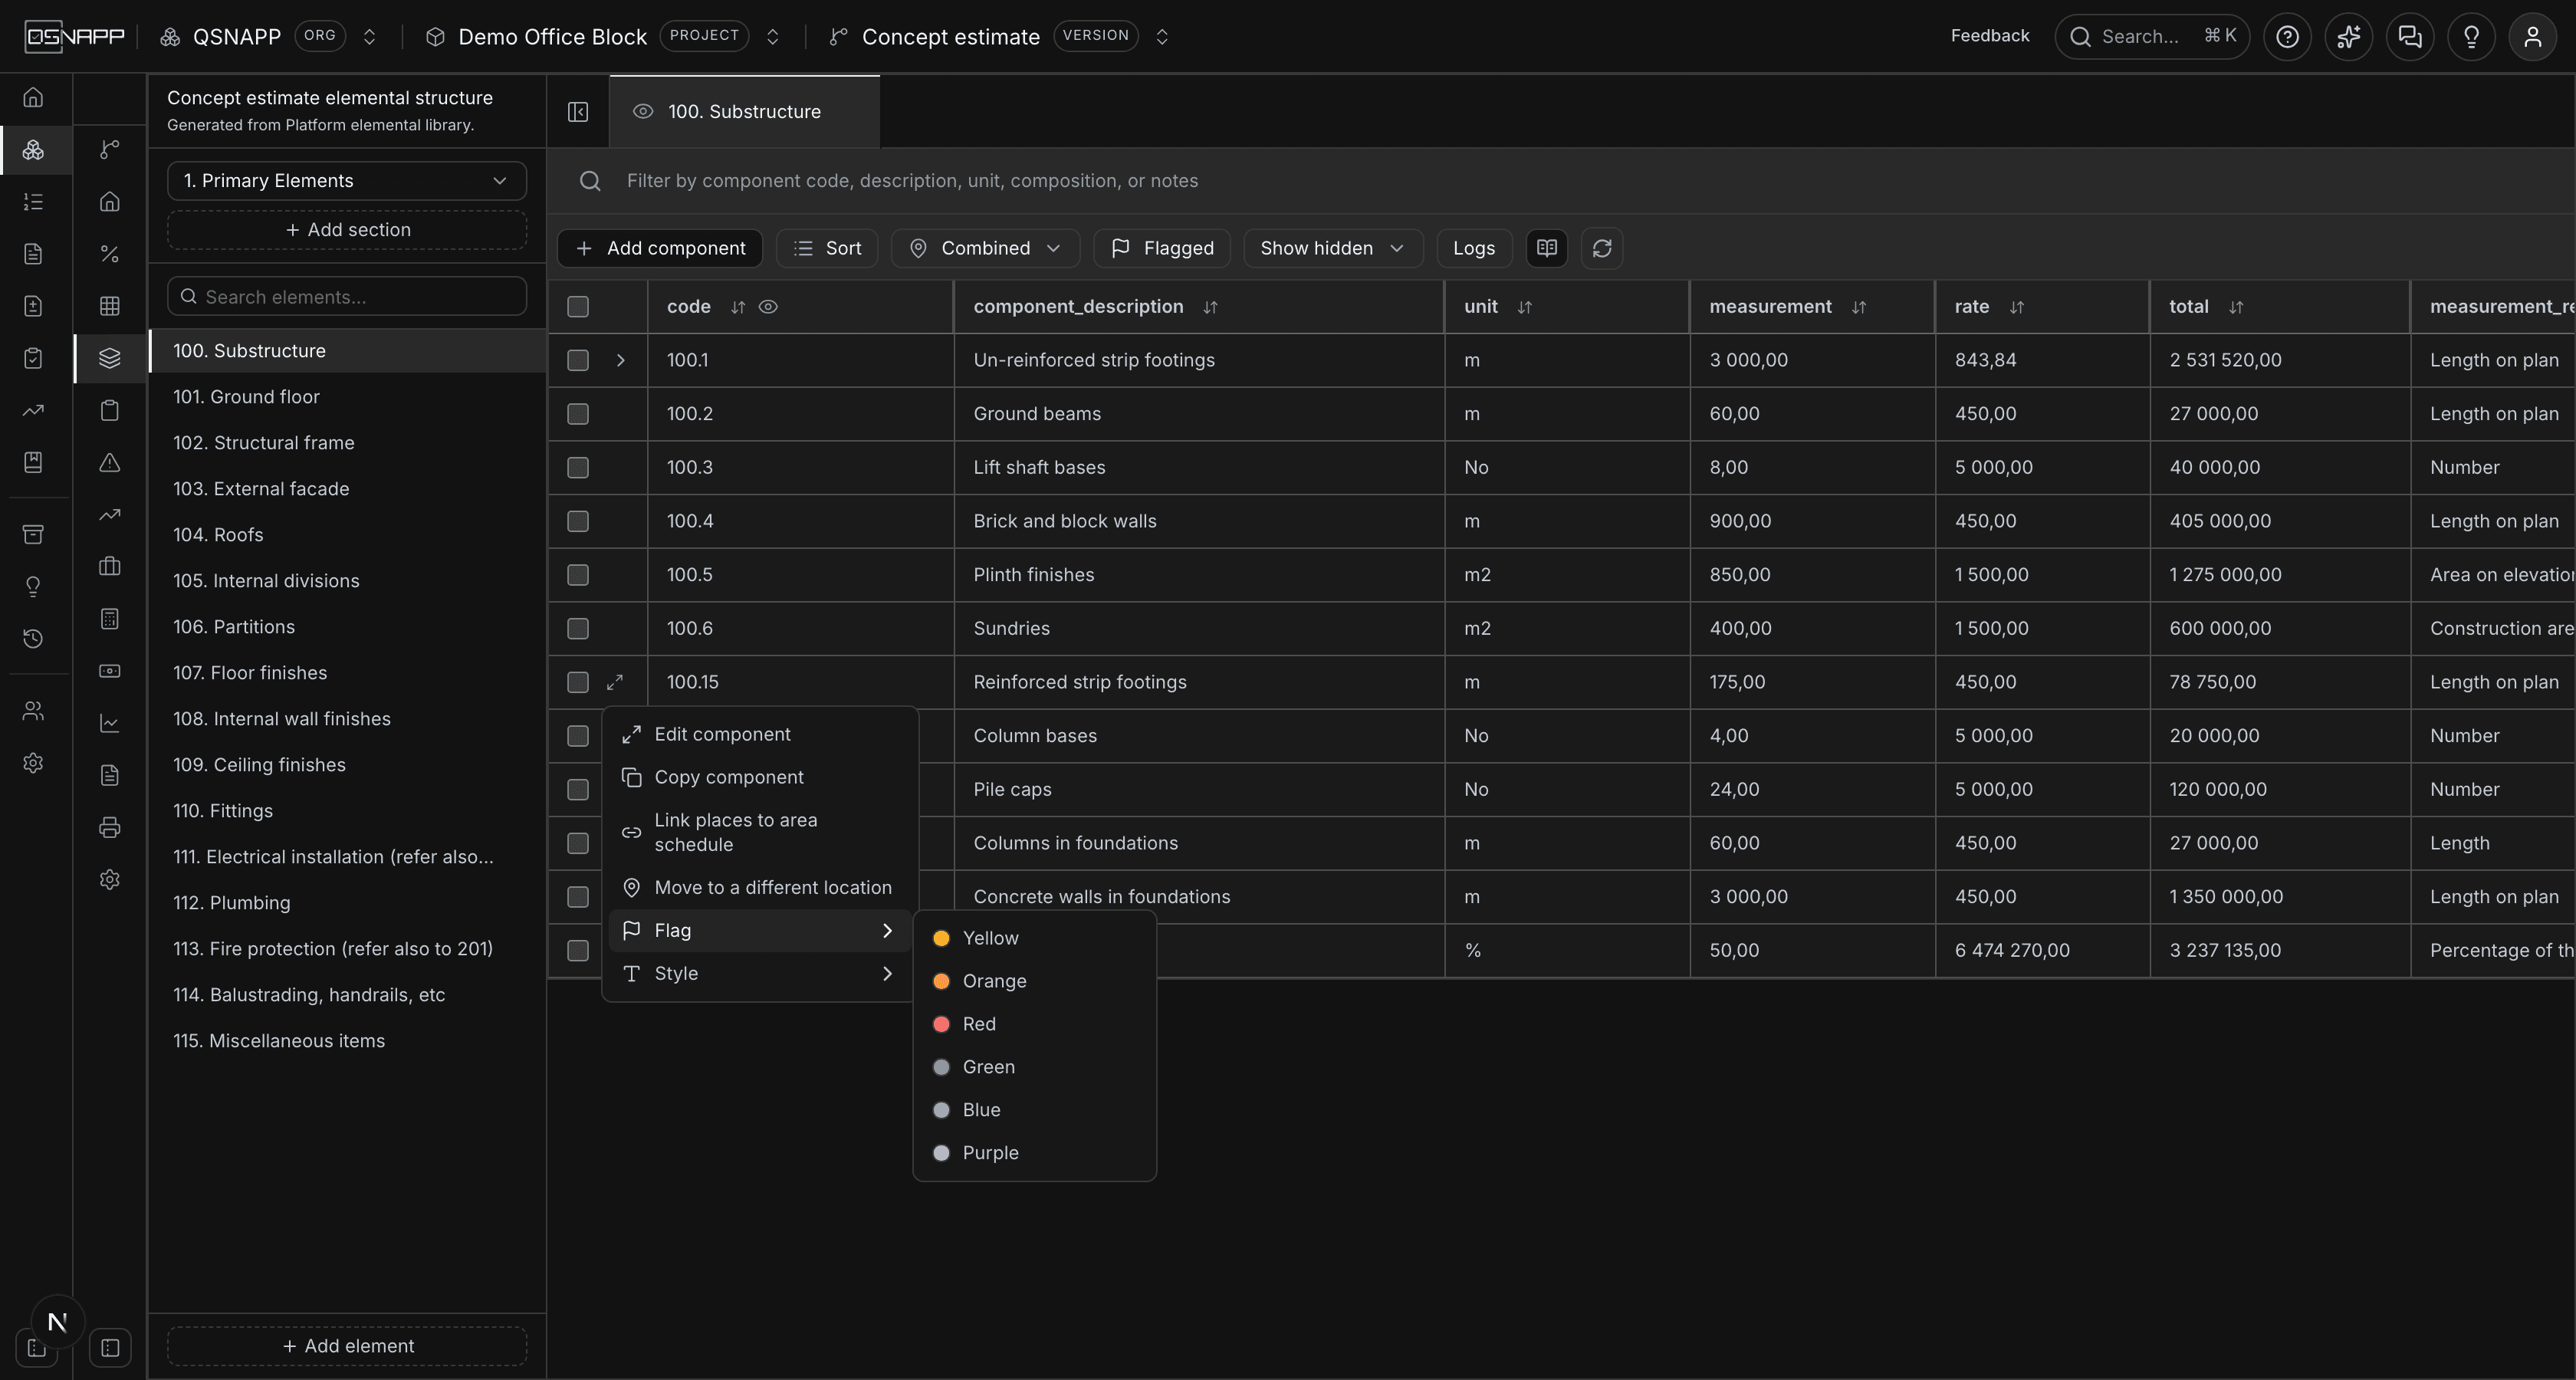
A component can be flagged to come back to — a rate to confirm, a quantity to re-measure, a query for the architect. Flag in the row menu offers a palette; yellow is the default, and there are five others so a colour can mean something to the person using it. A flagged row sits on a tint of its colour with a stripe down its left edge, so it reads from across the grid. Remove flag appears once there is one.
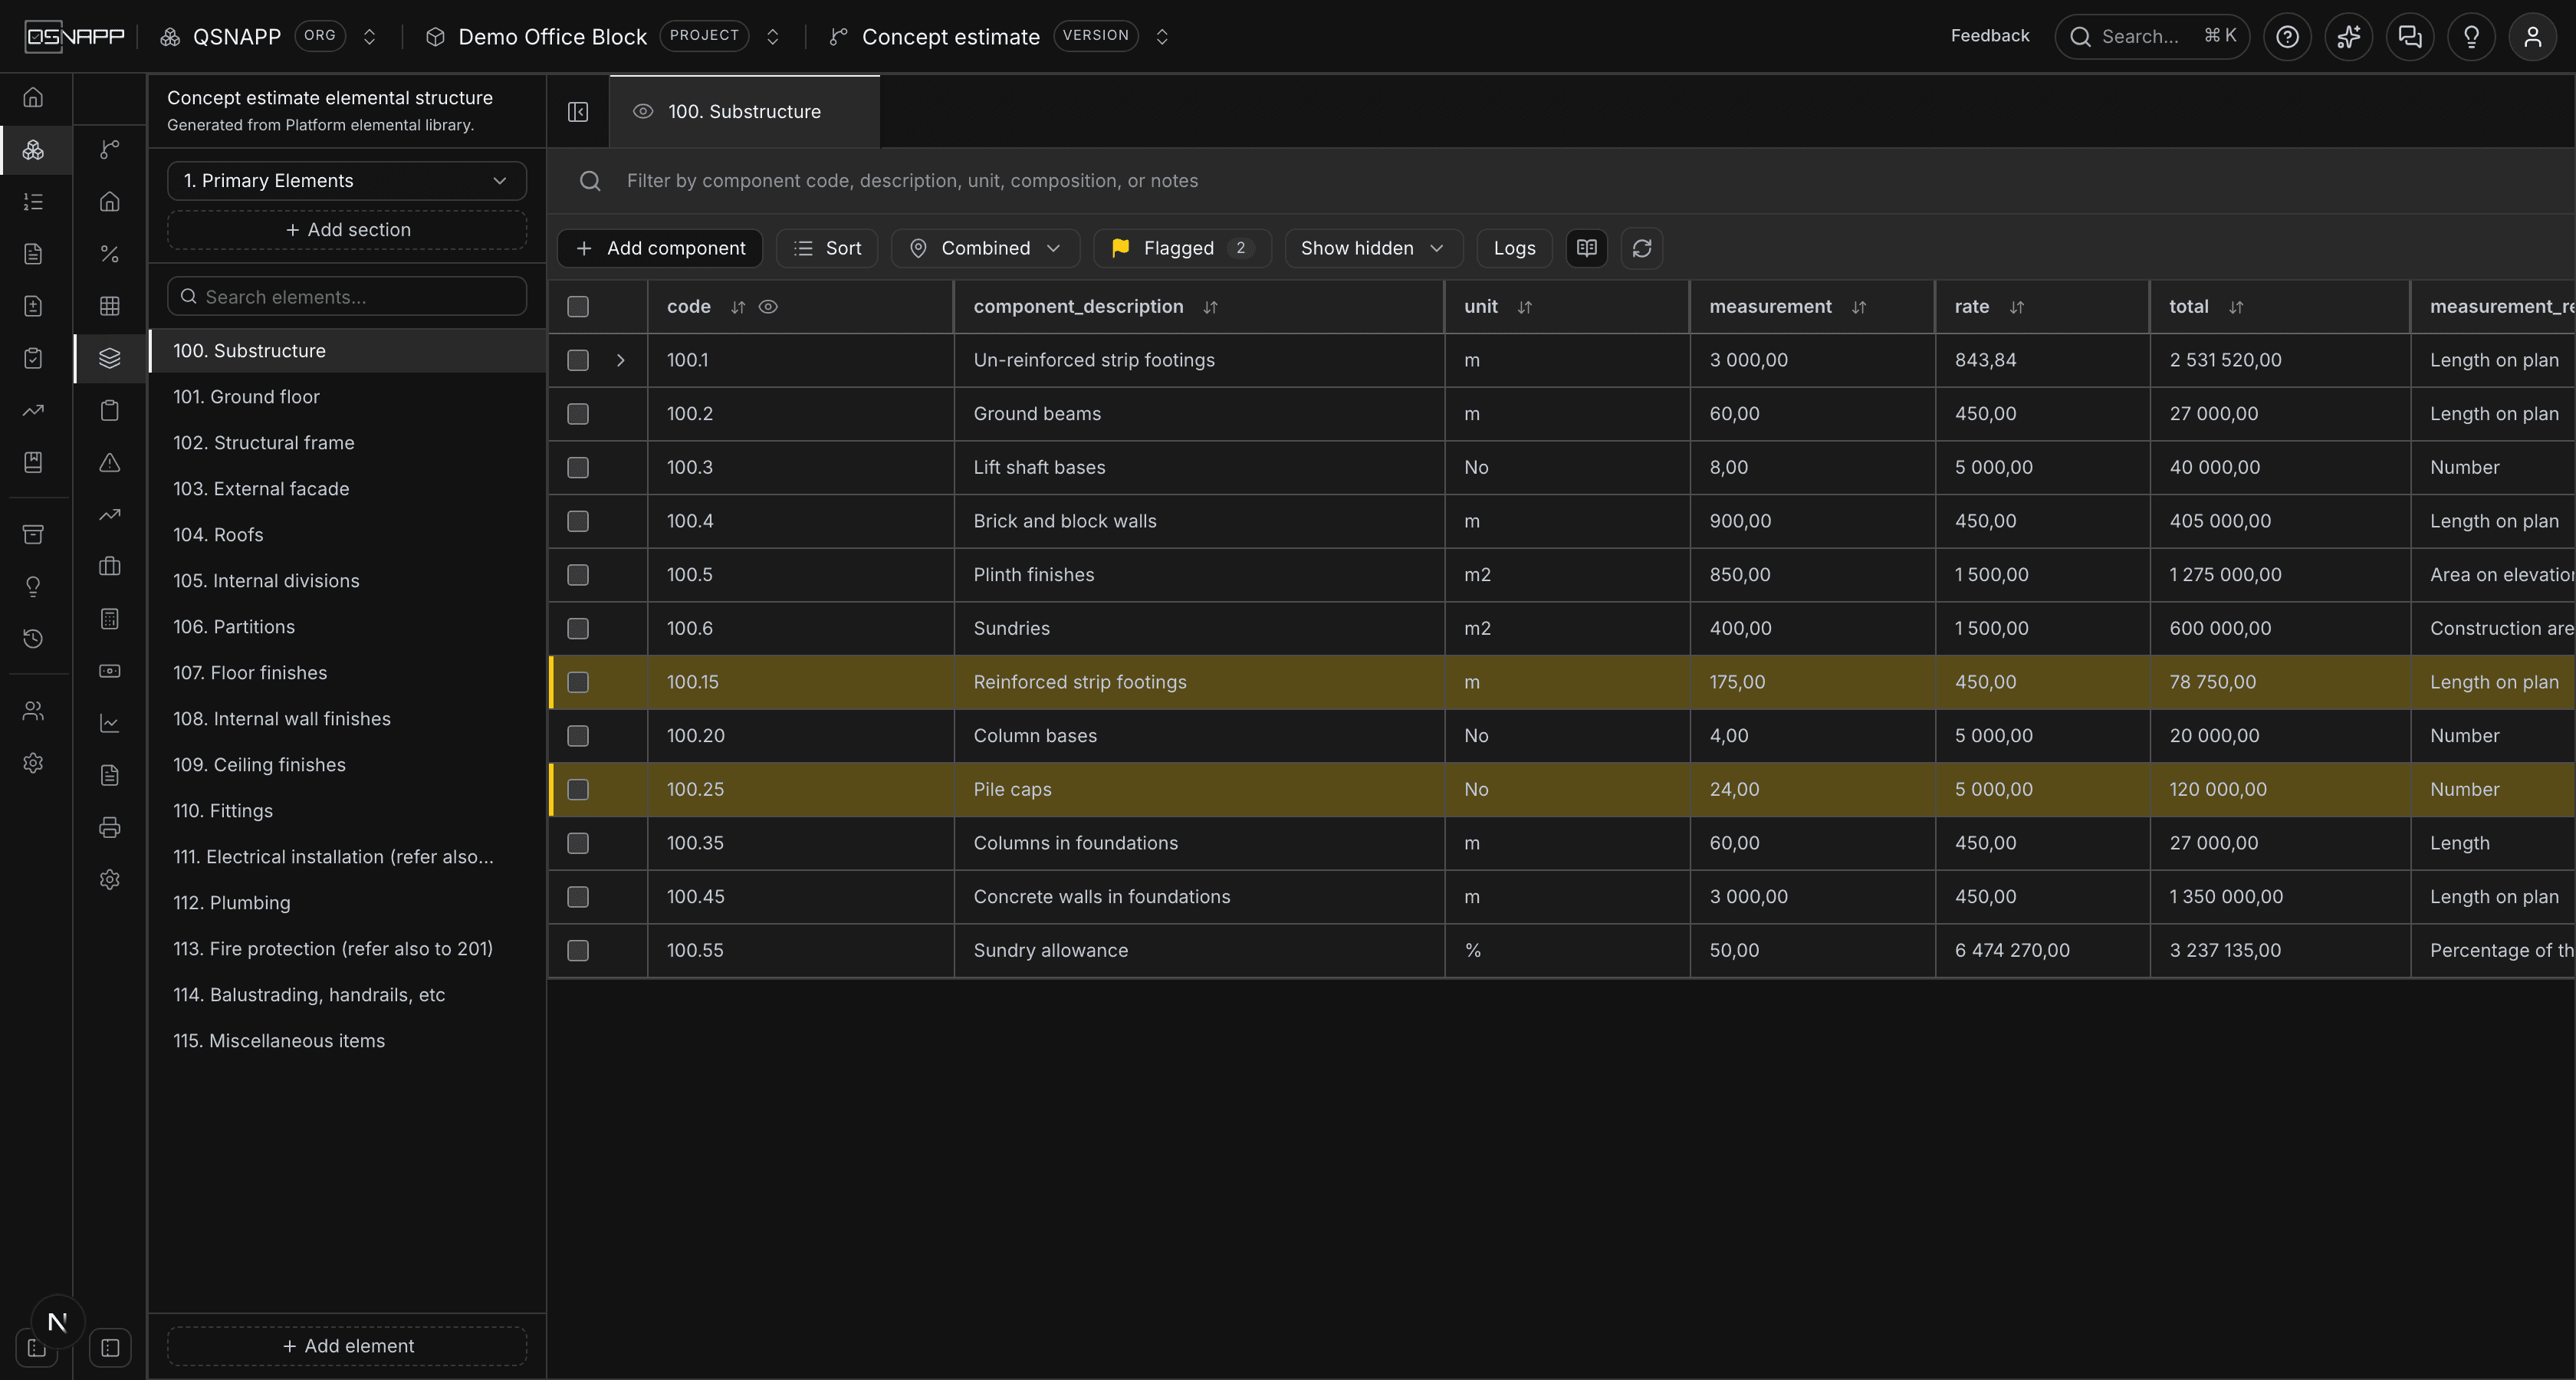
The flag is kept with the component, not in your browser, so it is there when you come back and there for whoever opens the estimate next. Flagged in the toolbar carries the count for the whole version; switch it on and the grid shows only flagged rows, while the element list narrows to the elements that hold any — a list of the places to go rather than the whole structure with most of it empty.
The composition behind a rate
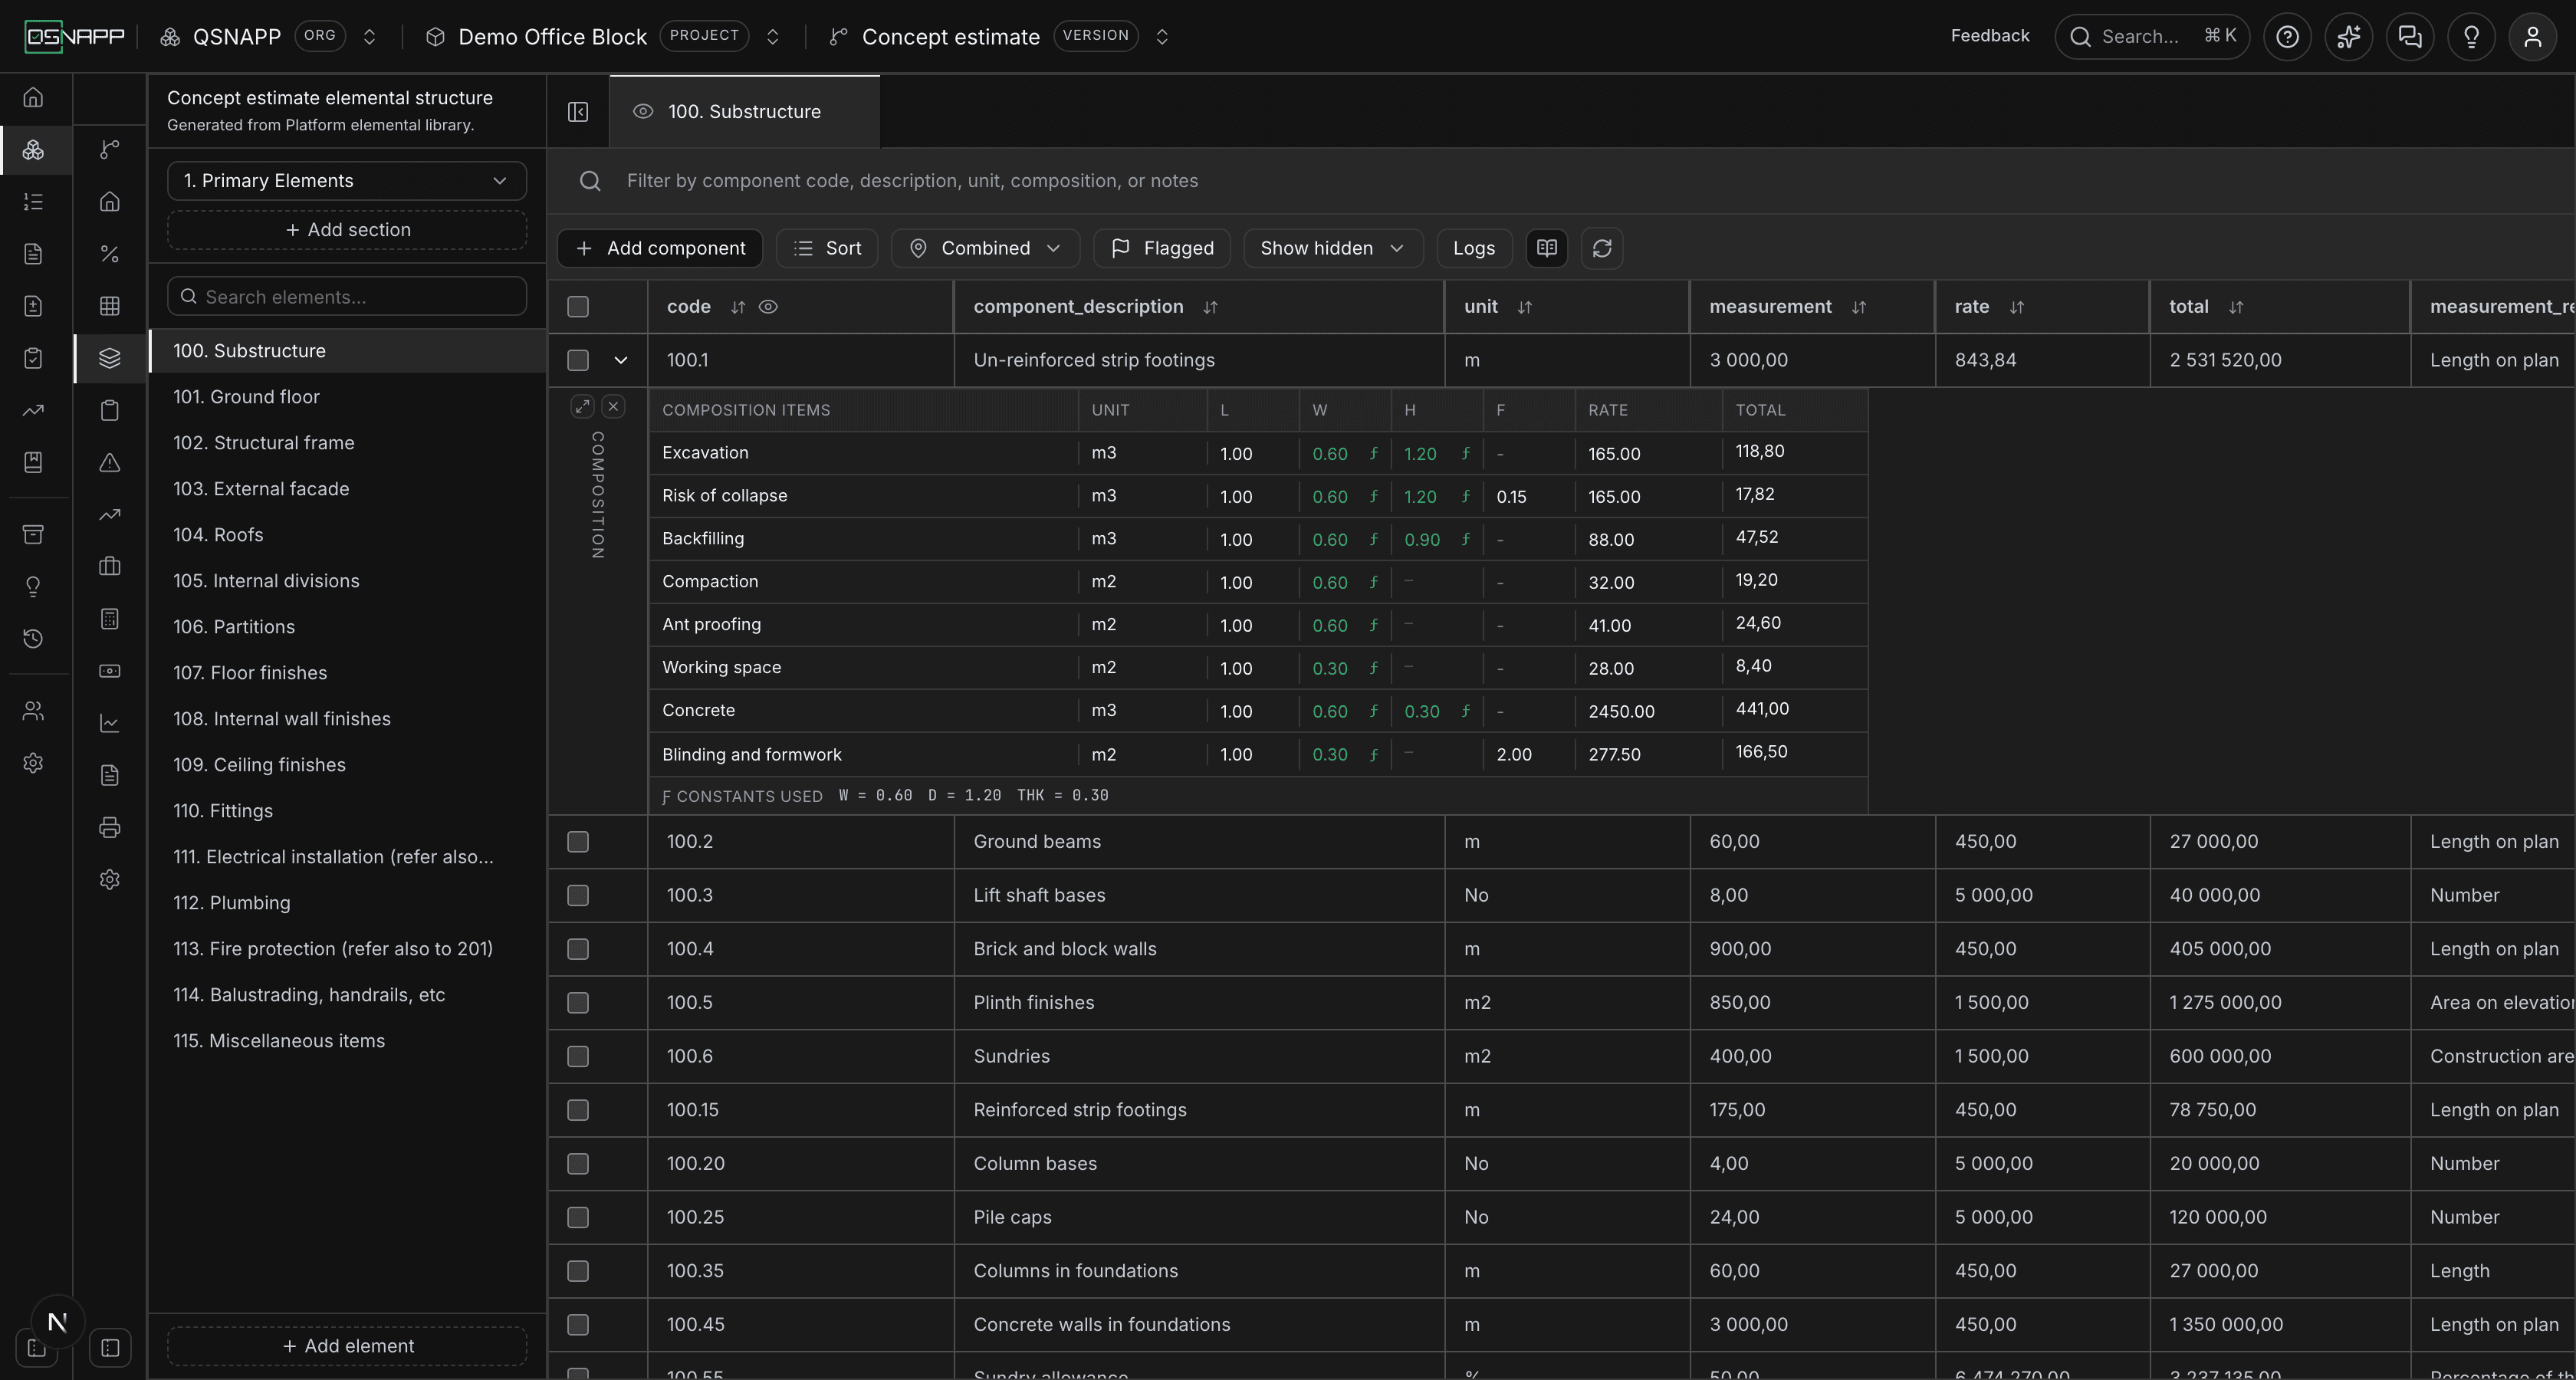
A rate can be typed straight into the rate column. More often it is built up: concrete, formwork and reinforcement each measured and priced, adding to the rate for the wall.
Rows with a build-up carry a chevron in the left gutter. Opening it shows the composition underneath the row — one line per item, with L, W, H, F, a rate and a total. The composition column shows how many lines there are before you open anything.
Composition cells show the figure they work out to, not the formula behind them. Click into a cell and the formula returns so it can be edited. A cell driven by a formula is marked ƒ, and hovering it says what the formula is and what it comes to.
In the schedule above, the width of every line reads 0.60 rather than W, and the depth reads 1.20 rather than D — the measured figures the estimator is checking, not the names they are stored under. The ƒ beside each is what says a constant is doing the work, so restating the footing width reprices all eight lines at once. Backfilling's 0.90 is D - THK worked out: the excavation depth less the thickness of the footing that fills part of it.
Constants
A constant is a figure named once and used across the composition — Wfor a wall's thickness, H for its height, R for the reinforcement allowed per m³. They live in Component constants in the component drawer.
Naming a figure once means changing it once. Correct H from 5,95 to 6,10 and every composition line that multiplies by it reprices.
A constant can be declared but not stated — it shows as Not stated rather than as zero. That distinction matters: a rate of zero prices work at nothing and reads as a decision, where Not stated reads as a figure still to be measured. Cells referring to an unstated constant say so instead of quietly costing nothing.
Under the lines of an open composition, a Constants used strip lists every constant its formulas refer to, with its value — W = 0,60, THK = 0,30 — so the figures behind the lines can be read without opening the component. A constant a formula names but the component does not define is shown in warning colour as not defined.
Formulas in a composition cell
Any of the L, W, H, F or rate cells can hold arithmetic over the component's constants:
w              the wall thickness
h * 2          twice the height
200 / 1000     kilograms expressed as tons
Operators are + - * / with brackets. A formula naming a constant that does not exist is flagged on the cell and named in the message, rather than being treated as zero.
Formulas in the measurement cell
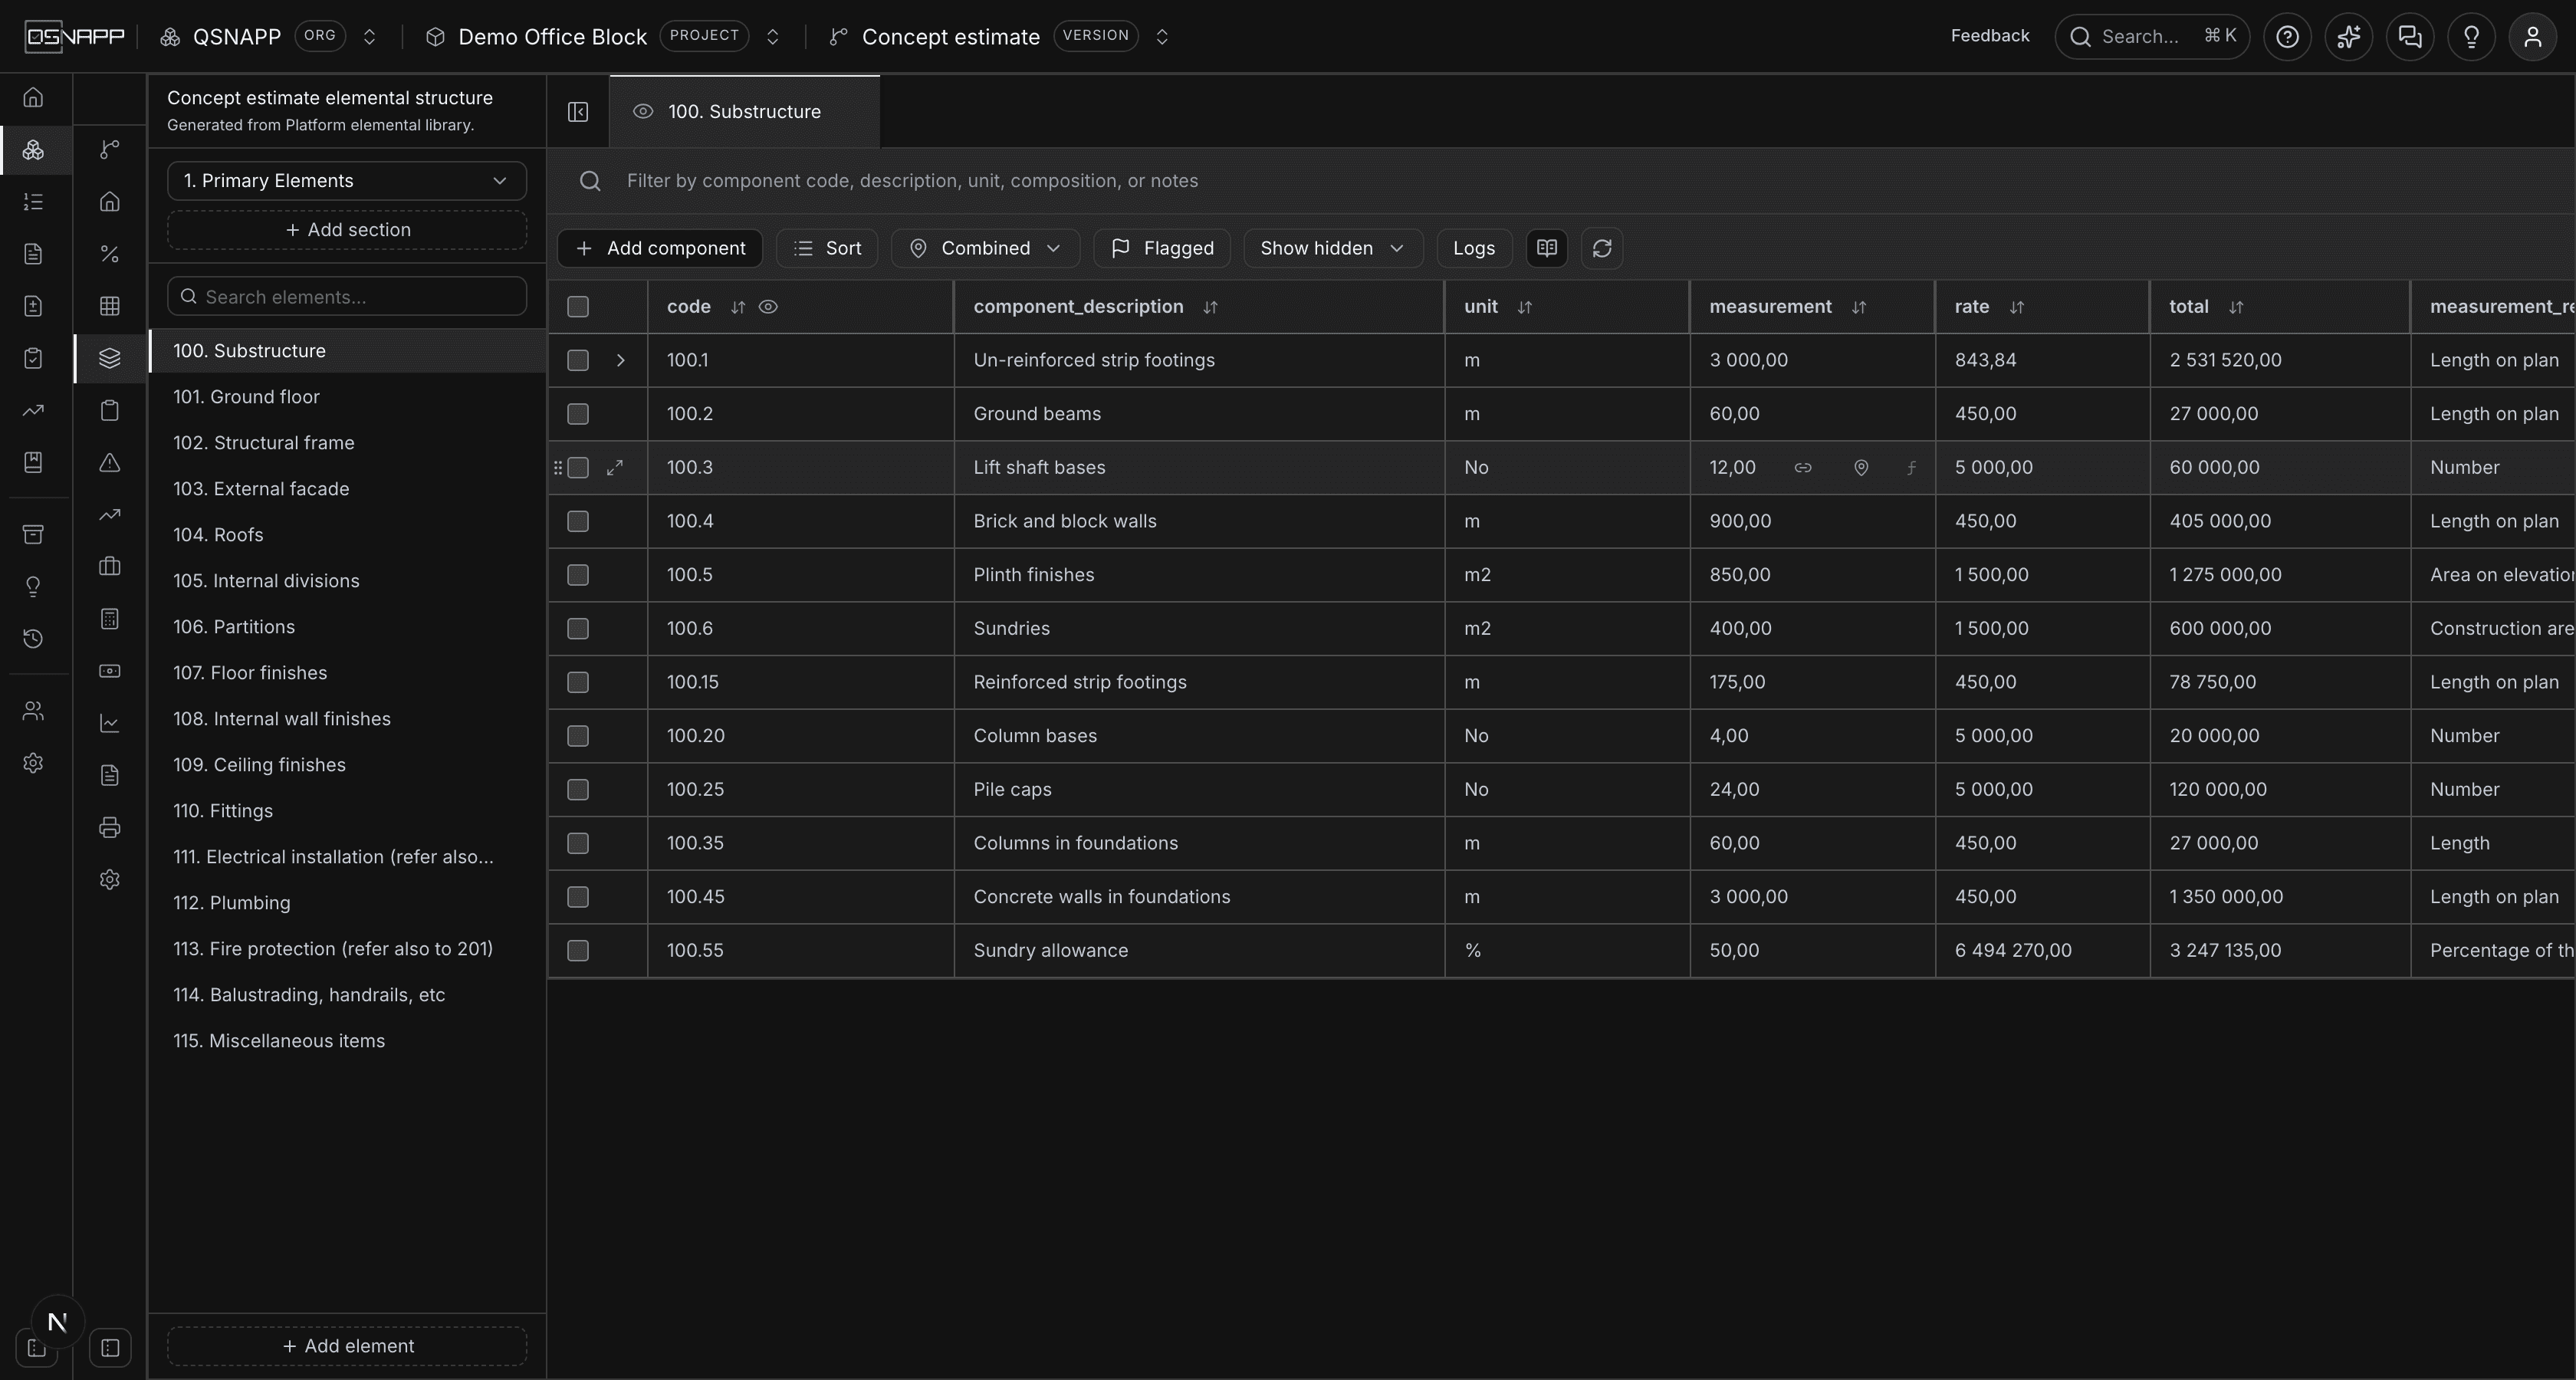
The measurement column takes the same arithmetic as a composition cell: numbers, the component's constants, + - * / and brackets. WW * H for a wall area from its constants, L * 2 + 3.5 for a length with a return, (A + B) / 2 for an average. Double-click the cell and the formula comes back as written, not as the number it came to.
The formula is kept beside the figure, and it follows the constants it names: change H and the measurement moves with the composition; rename a constant and the formula is rewritten to match. A constant the measurement names cannot be deleted from under it. A formula that does not work out — naming a constant the component does not have, say — is refused when you save, with the reason, rather than stored beside a stale number.
A component measured by place takes its measurement from its places, so a formula is refused there, and one already on the component is cleared the moment it gains its first place.
Taking-off notes
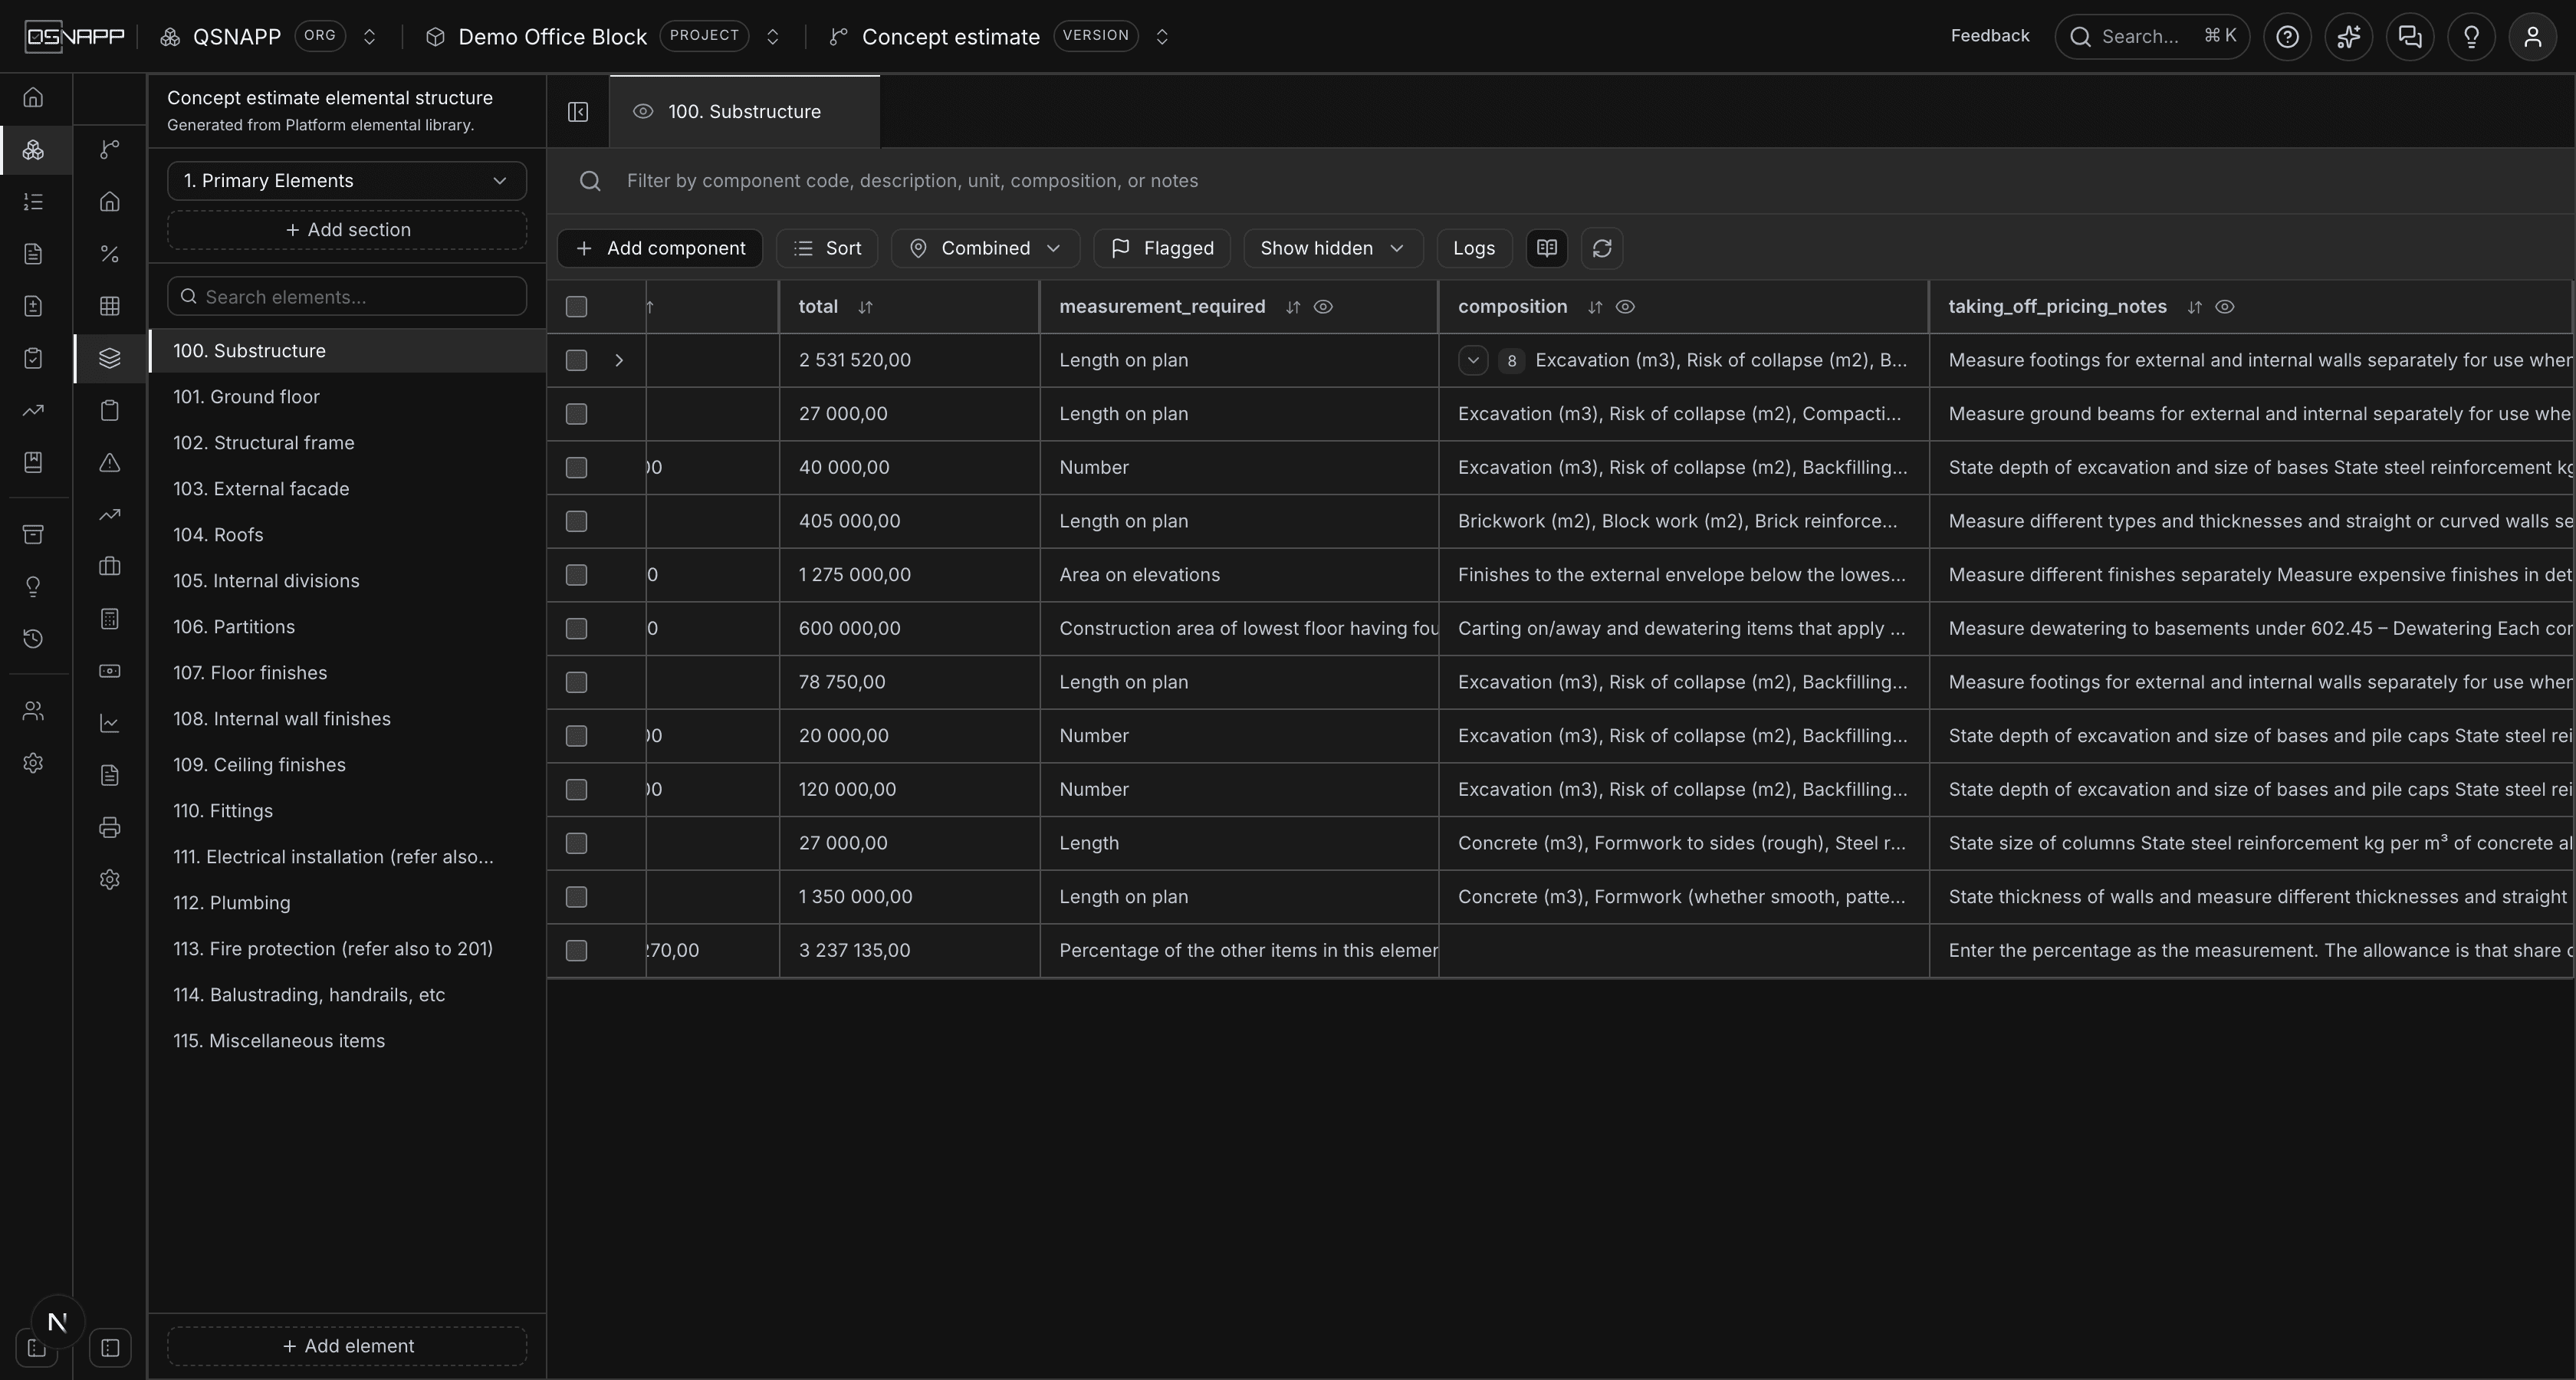
The library carries the standard's own instructions for each component — “State thickness of walls”, “State height of wall”. Where a note asks for a figure, the component arrives with a constant already declared for it, waiting to be stated. Components created before that existed can be given them from the constants panel.
Shares of an element
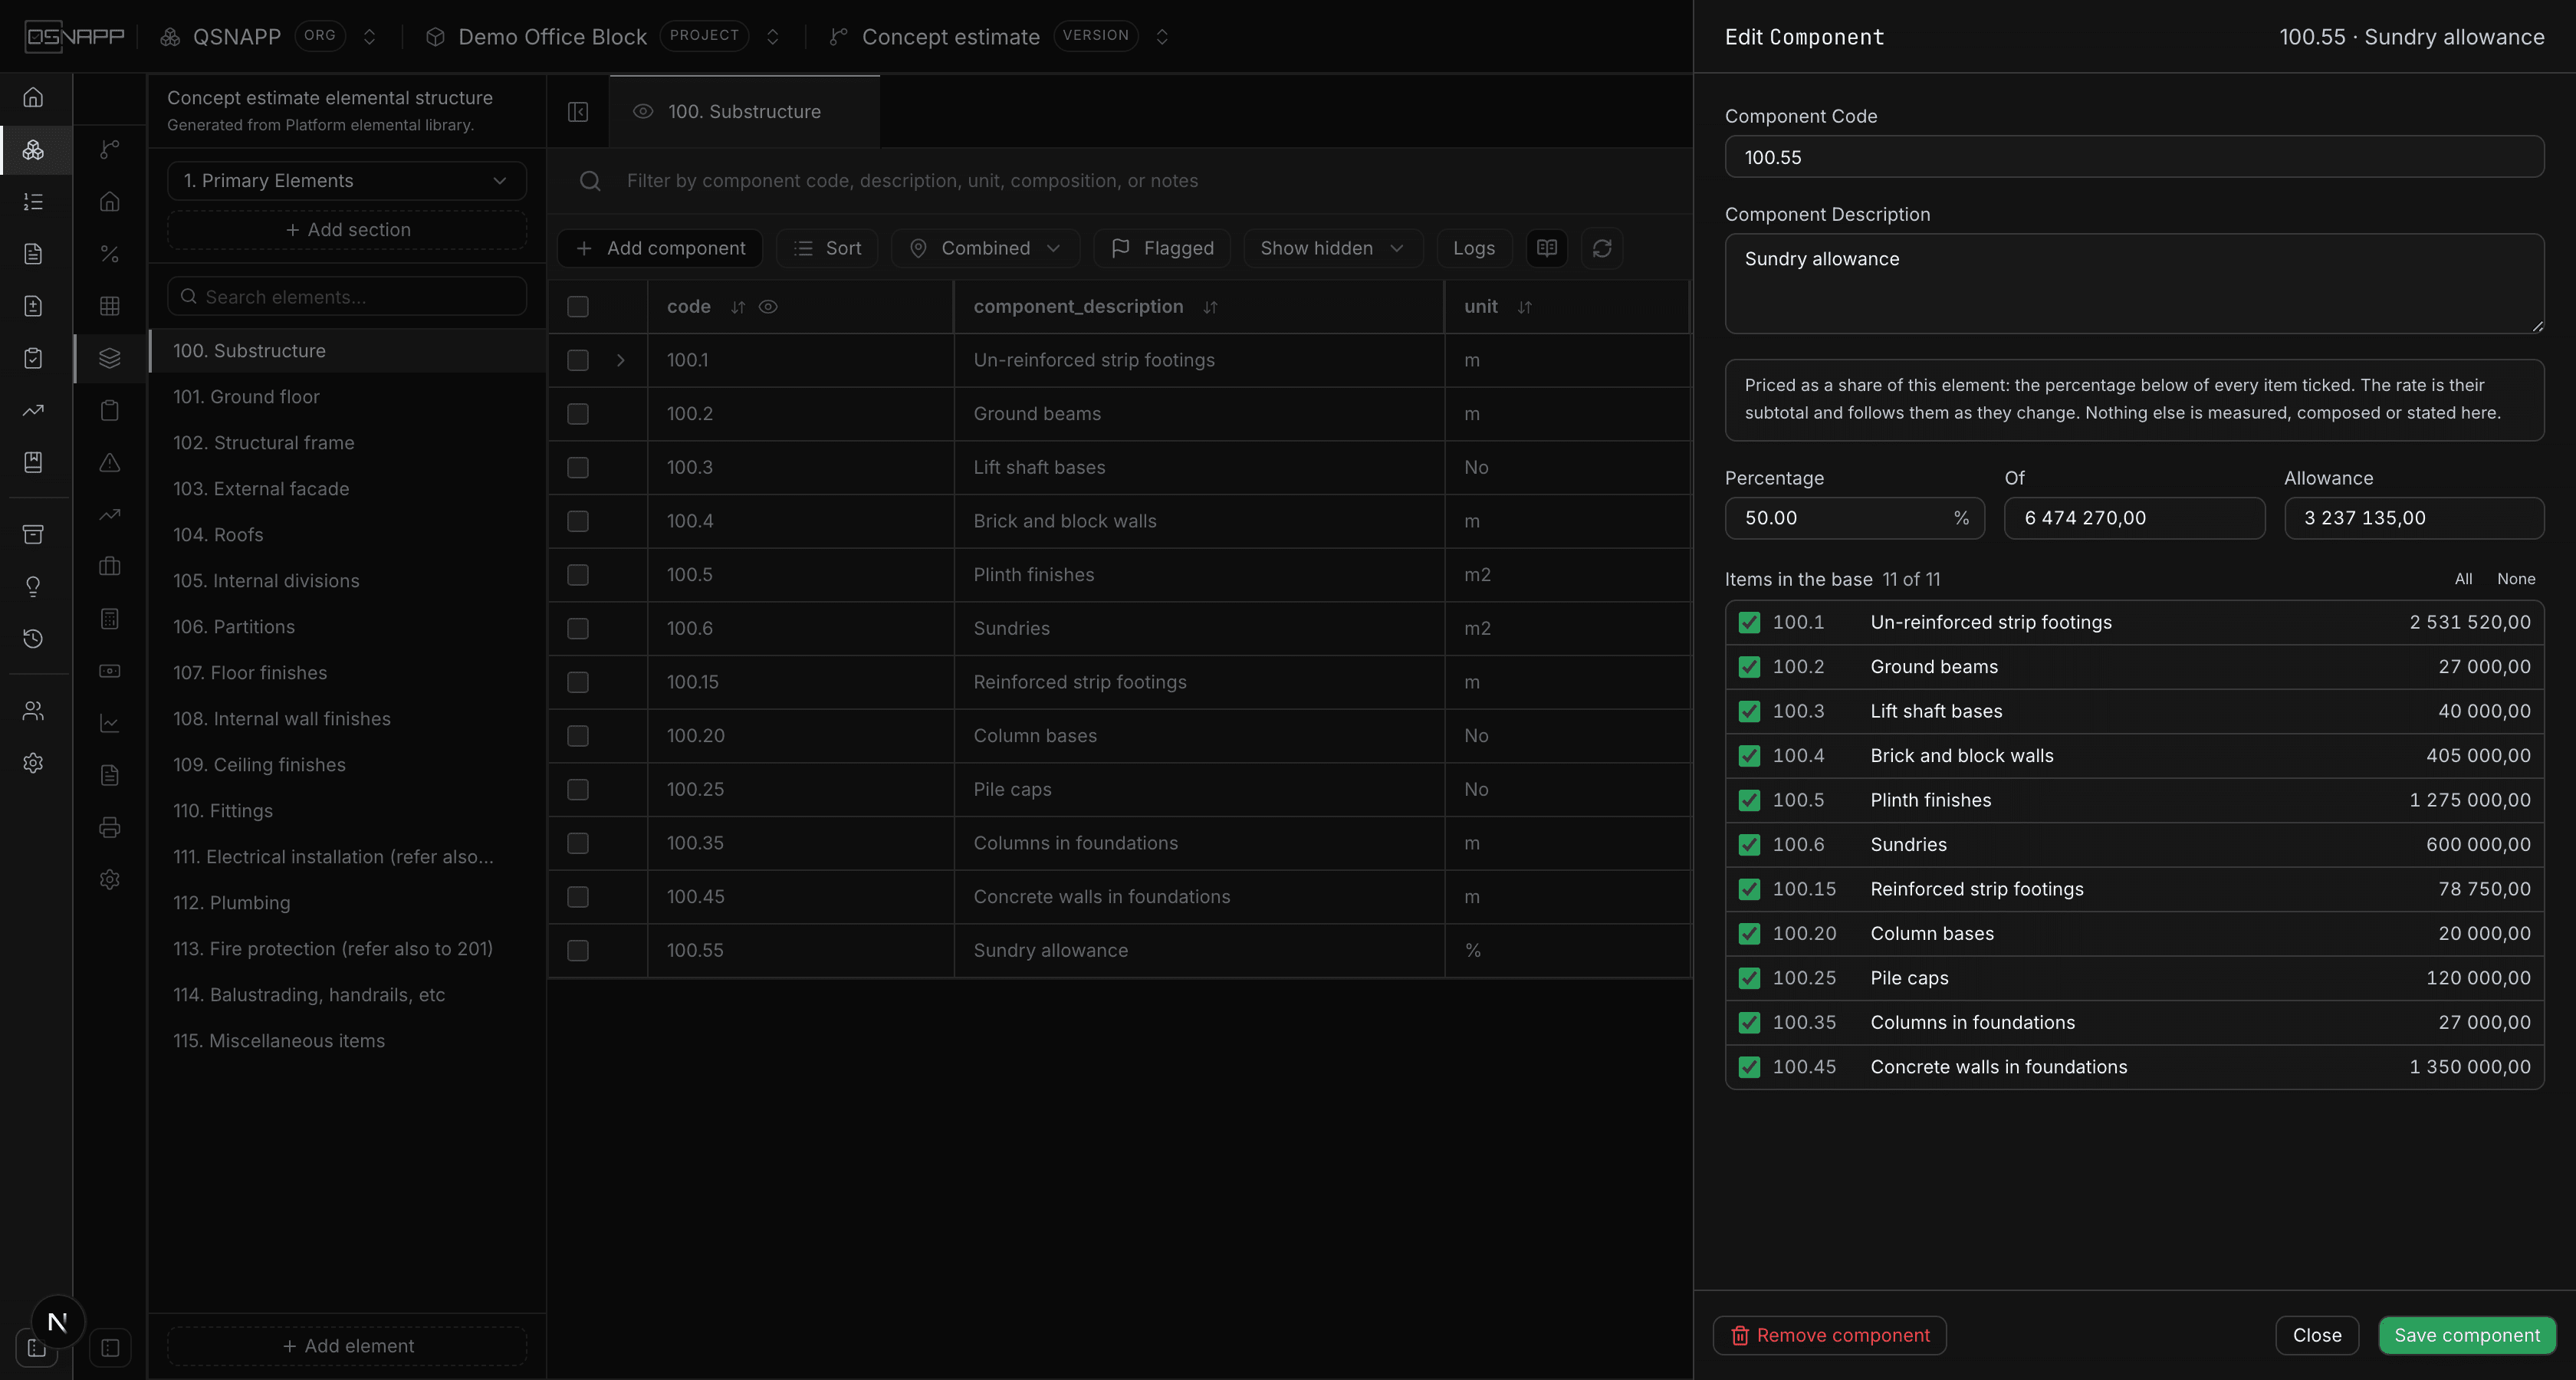
Some items are not measured at all — they are a share of the rest of their element, measured in %. Every element in the library closes with a Sundry allowance; Profit and attendance and Builder's work are shares too, as is the pair that closes 115. Miscellaneous items. They all work the same way.
Take the Sundry allowance. It is priced as a share of the element's other items: type the percentage in the measurement column, and the rate is held at the subtotal of those items, so the total is that share to the cent. The rate cell is read-only and says why when you hover it.
The share follows the element. Add an item, change a rate, remove a component, and the allowance is re-worked without anyone touching it. An allowance never prices itself. Where an element holds more than one share, each takes in the measured items plus the shares aboveit in code order, never one below — so Builder's work can be priced on the work and Profit and attendance on the work plus Builder's work, without the two ever chasing each other round. On screen it follows the figures as you type them, drafts included, and settles on the stored figures once you save.
Opening the allowance in the drawer shows the percentage, what it is a share of, the resulting allowance, and every item in the element with a tick against it. Untick a provisional sum or a prime-cost item and it leaves the base; an item added to the element later joins the base without anyone having to remember to tick it. A new allowance starts at 0 %, so it adds nothing until a figure is stated.
Measuring by location
A component can be measured once for the whole project, or by location: the same footing measured separately under Building A's ground floor, its first floor and its second. Its measurement is then the sum of its locations, and the rest of the estimate — the total, the report, cash flow — reads that sum exactly as it read a single figure. What changes is that the estimate can now say what each location costs.
The locations are the project's own — the same tree the area schedule builds — and the ones offered here are those marked as estimate locations there. Mark the places you price by (a building, a floor, a pod) and leave the grouping rows unmarked. A location something is already measured in stays offered whether or not it is marked.
A component is never measured in a place anda place inside it — Building A and Building A's ground floor — because the ground floor would then be counted twice. Wherever a location is chosen, one that would do that is shown greyed out with the reason, and the estimate refuses it regardless of how it was asked for.
Reading by location
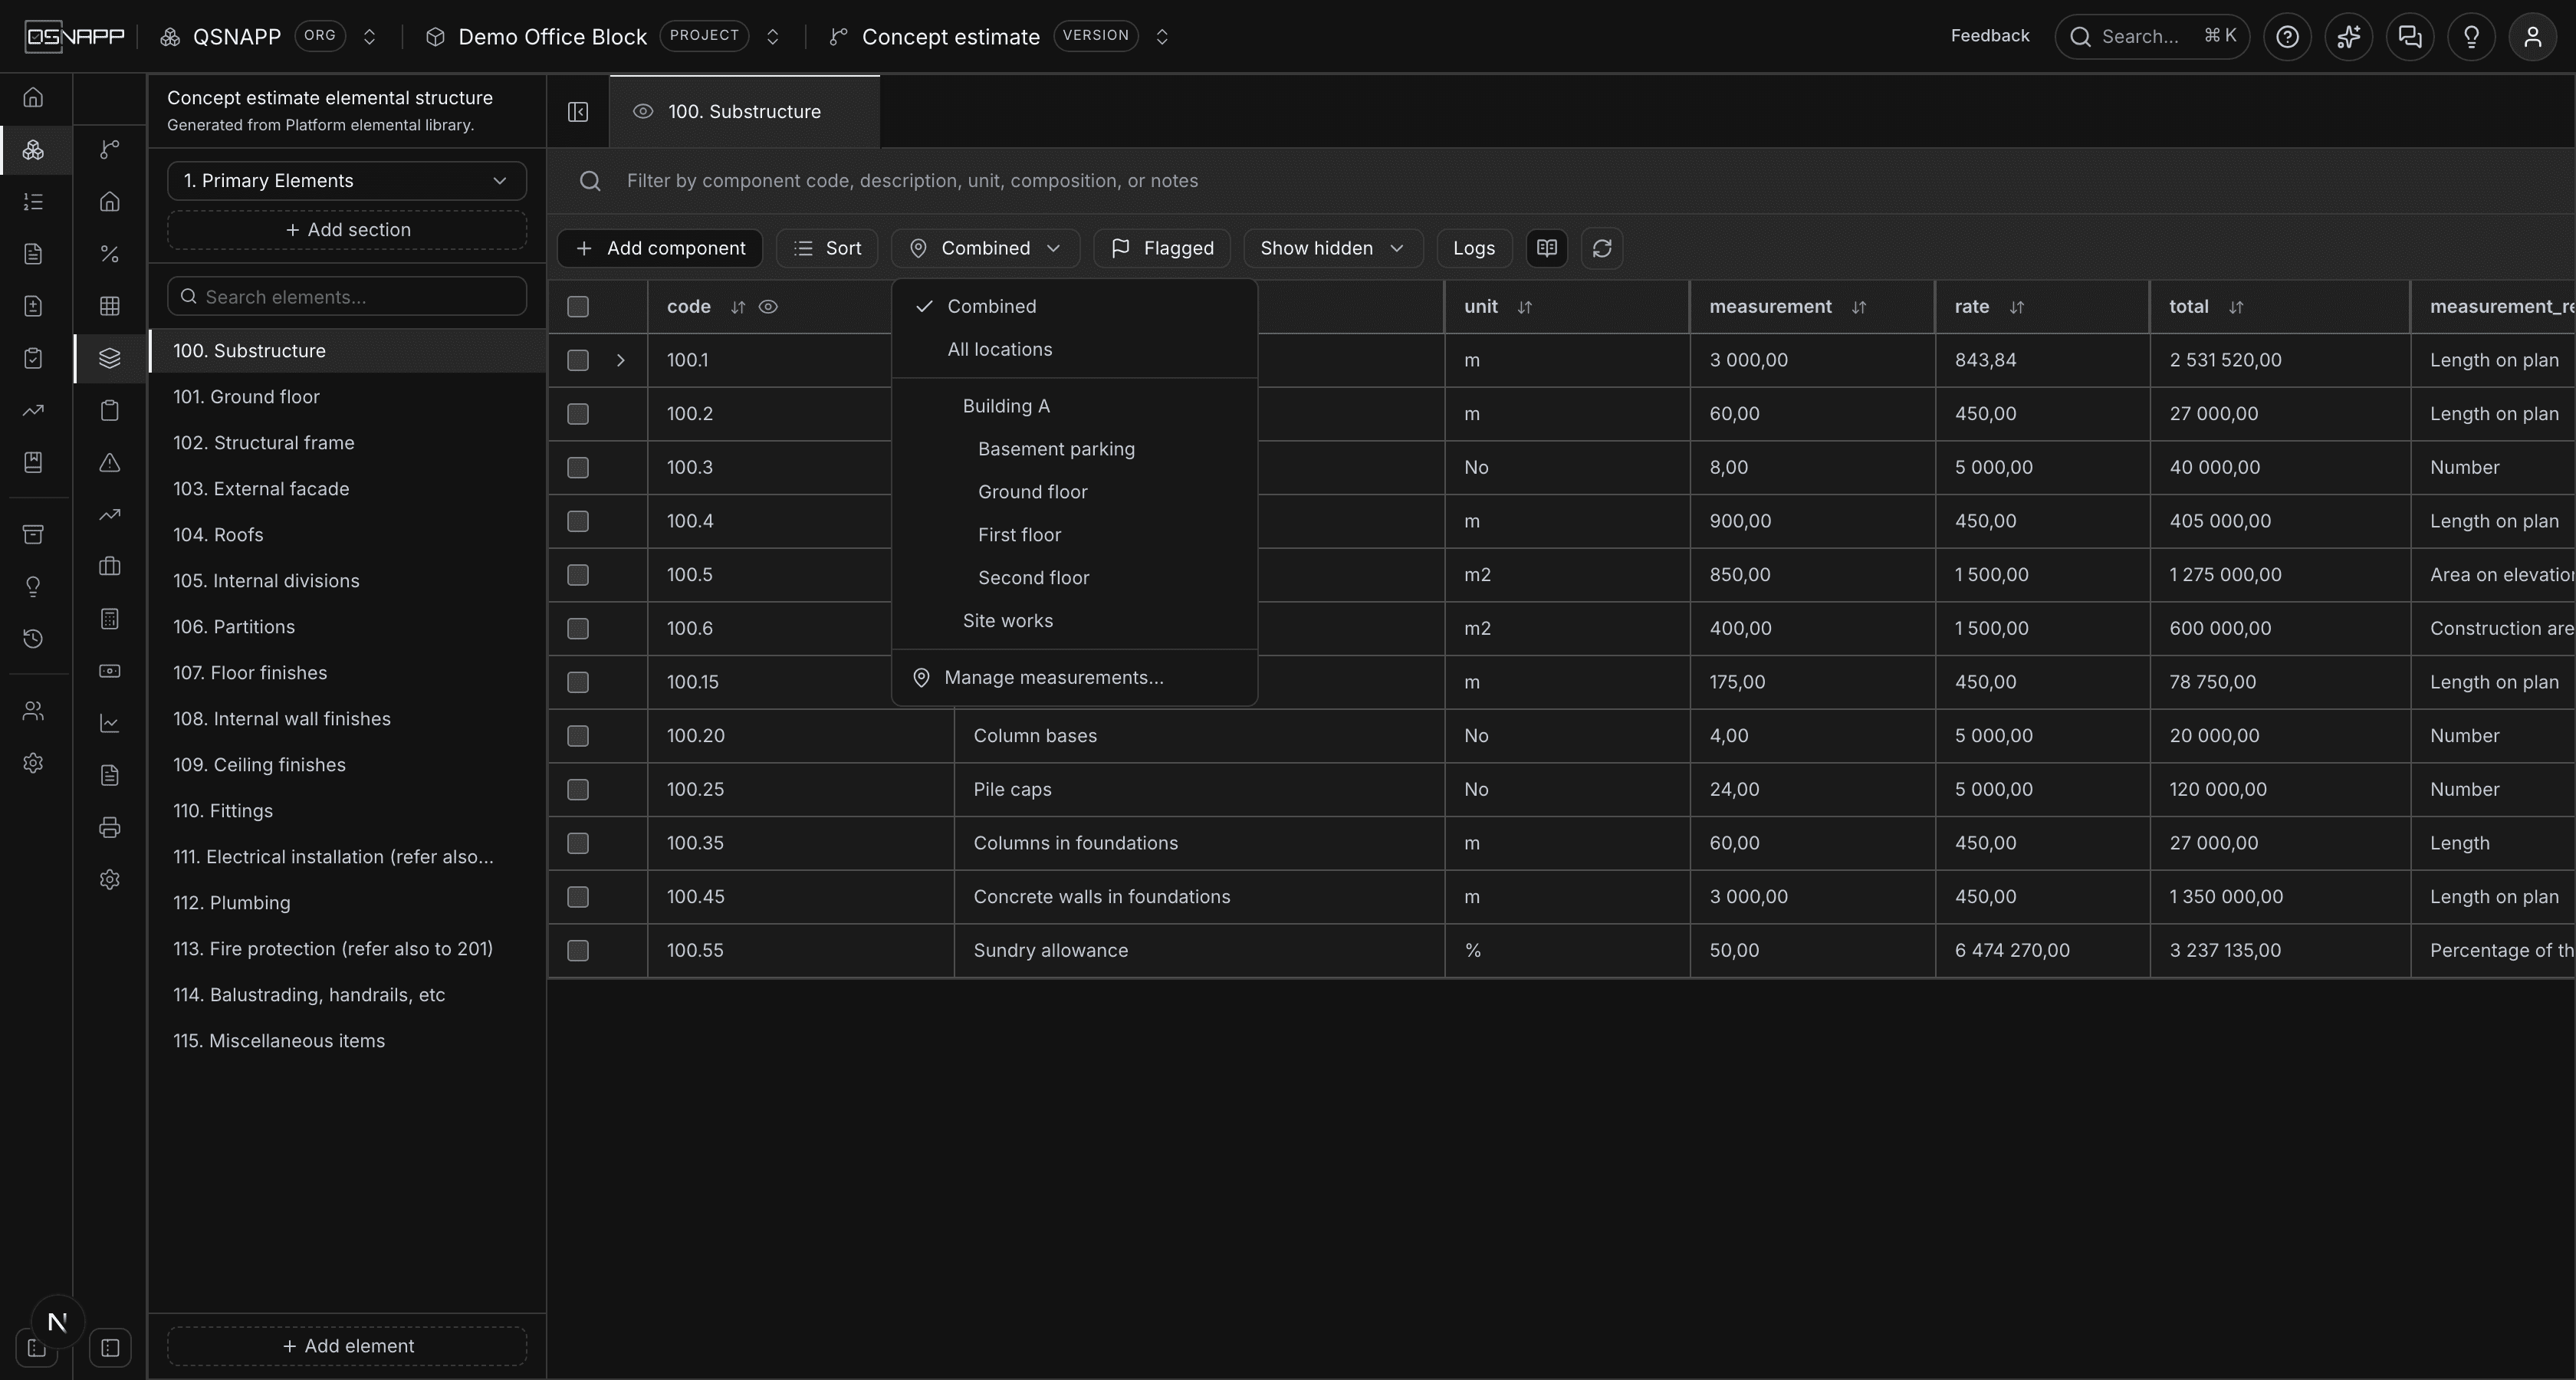
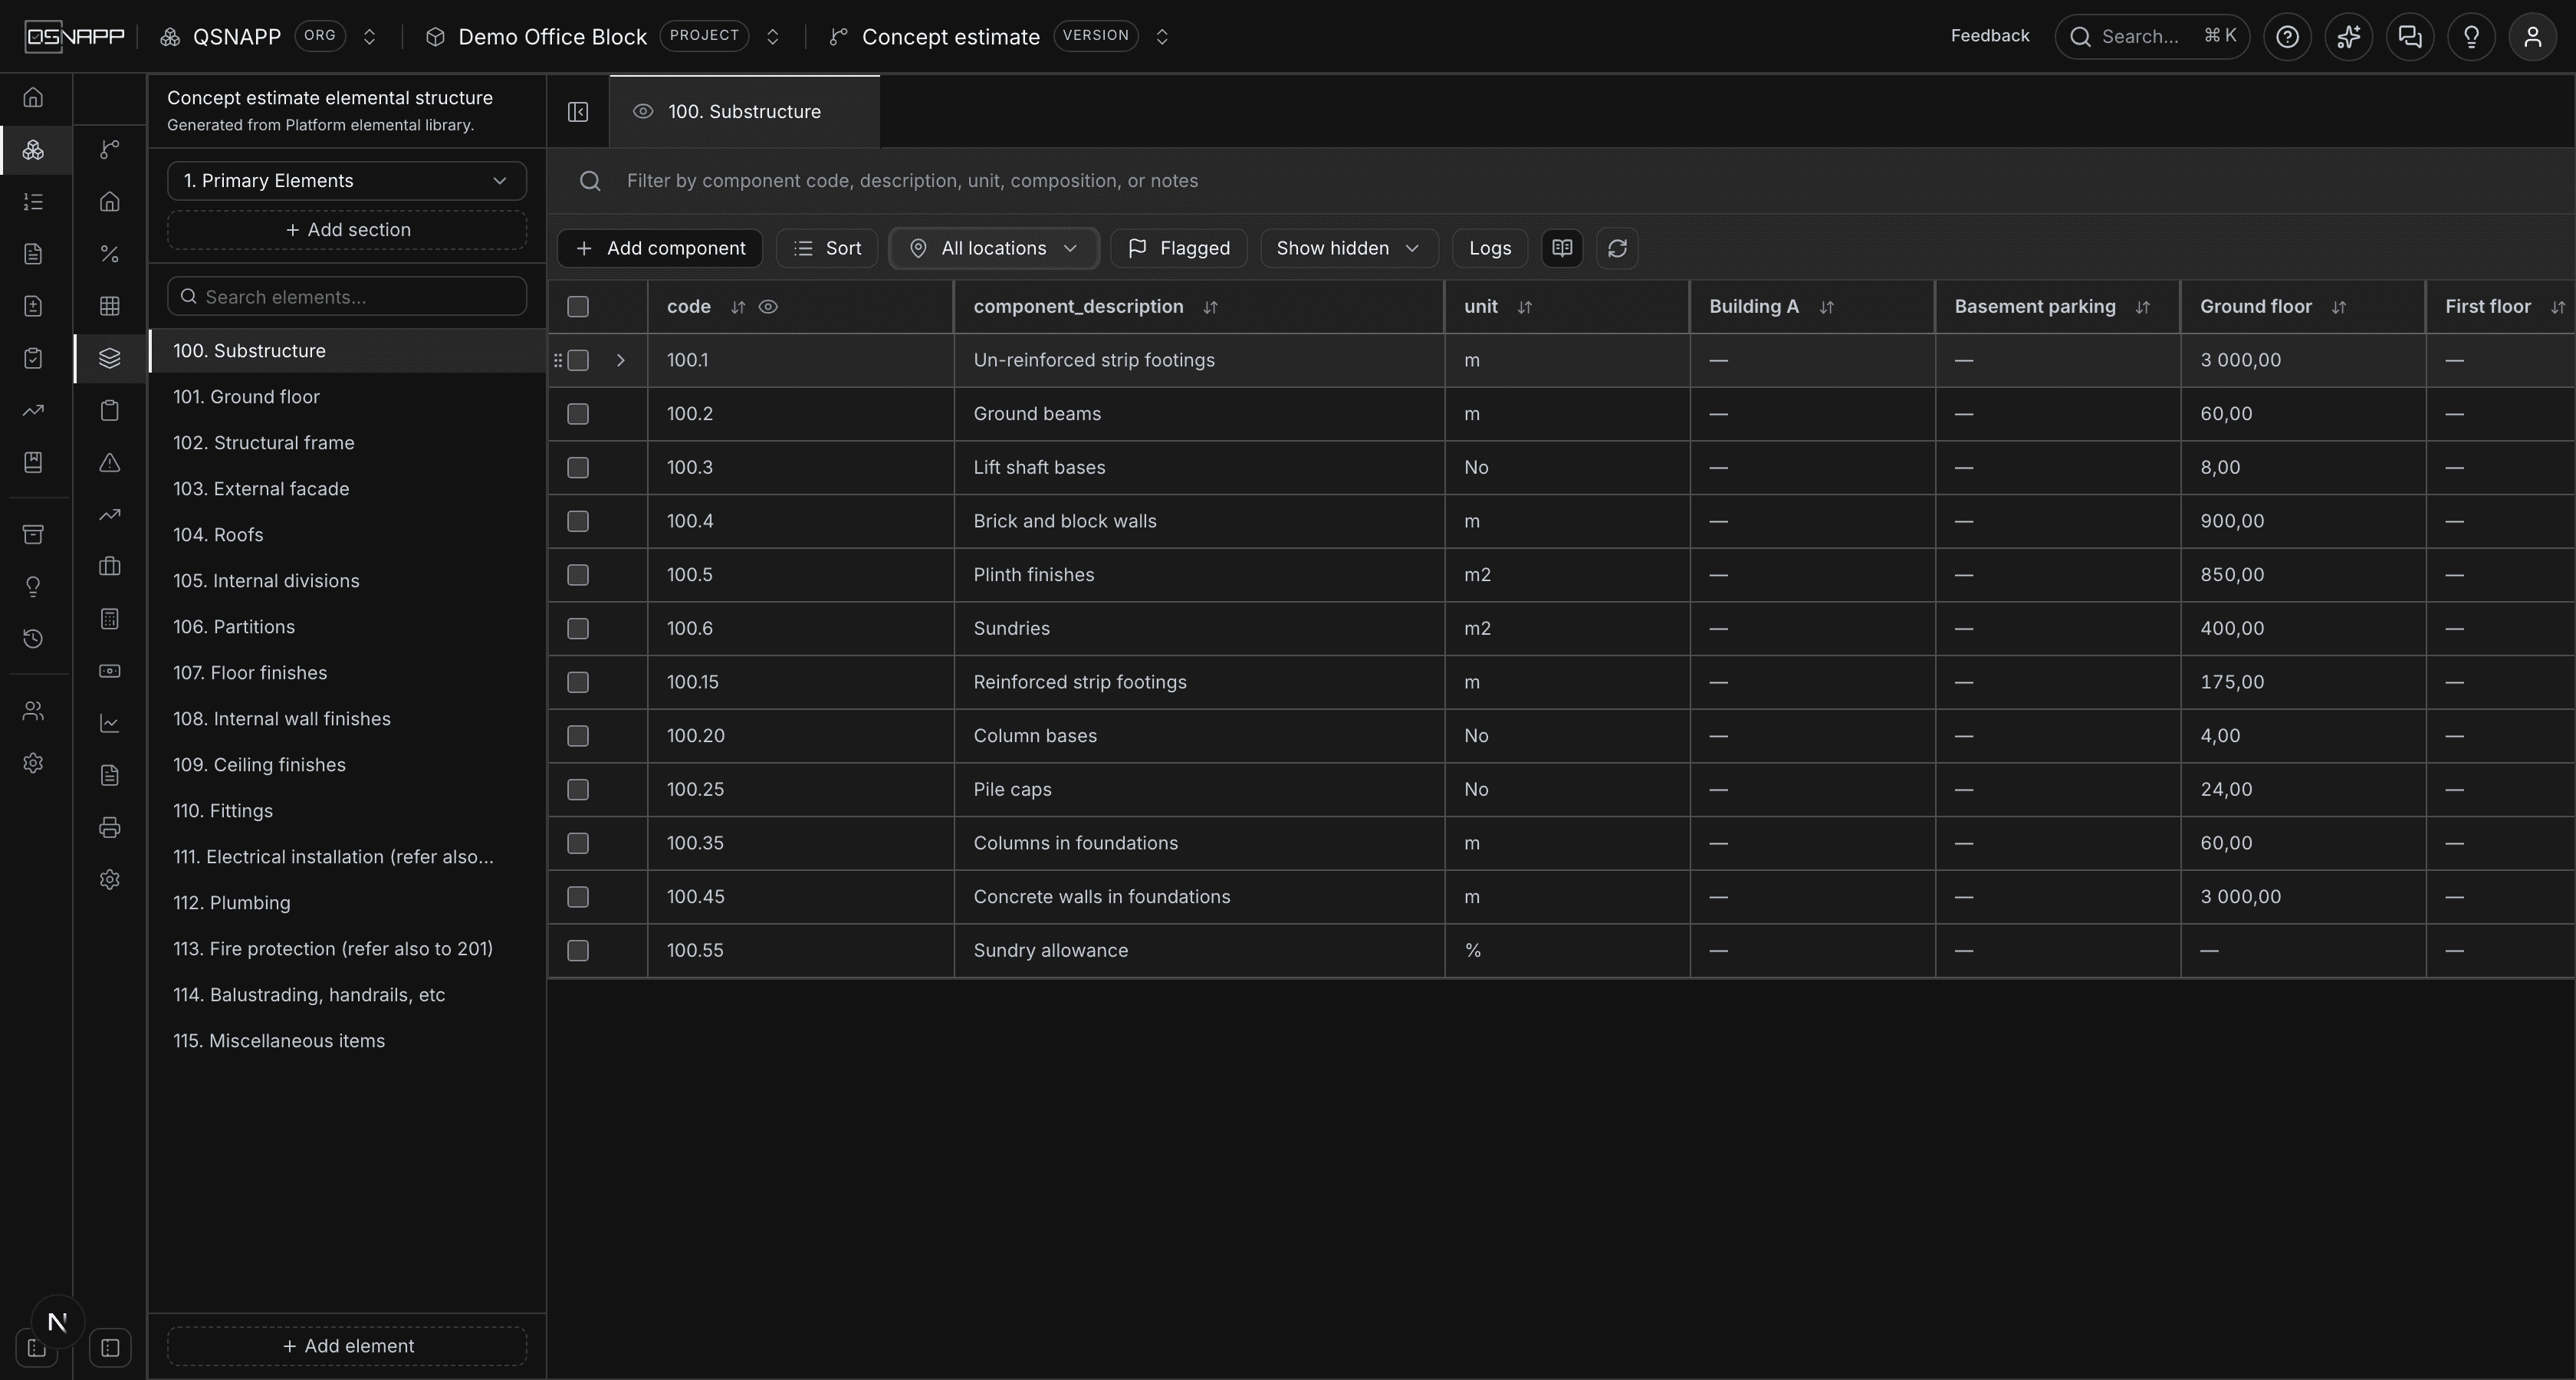
The location menu in the toolbar chooses how the quantity is read. Combined is the component's whole measurement — the sum of its locations — and is the view whenever no location is picked. Pick one location and the grid shows that location's quantity; pick several, or All locations, and each gets its own column, side by side. The view you leave the screen on is the one it opens on next time, for each estimate version.
Typing a quantity at a location
Read by location, a location's cell is typed into like any other: double-click it, enter the quantity — a number or a formula over the component's constants — and press Enter. Typing into a location the component is not measured at yet adds it there. Clearing a cell means not measured here, which is not the same as nought. A location whose quantity follows the area schedule is changed on the schedule, not typed over.
In Combined, a component measured by location cannot be typed into — its measurement is the sum of its locations, so a single figure there would be replaced the moment it was saved. Pick its locations from the menu and type into those.
Adding to a location, and moving
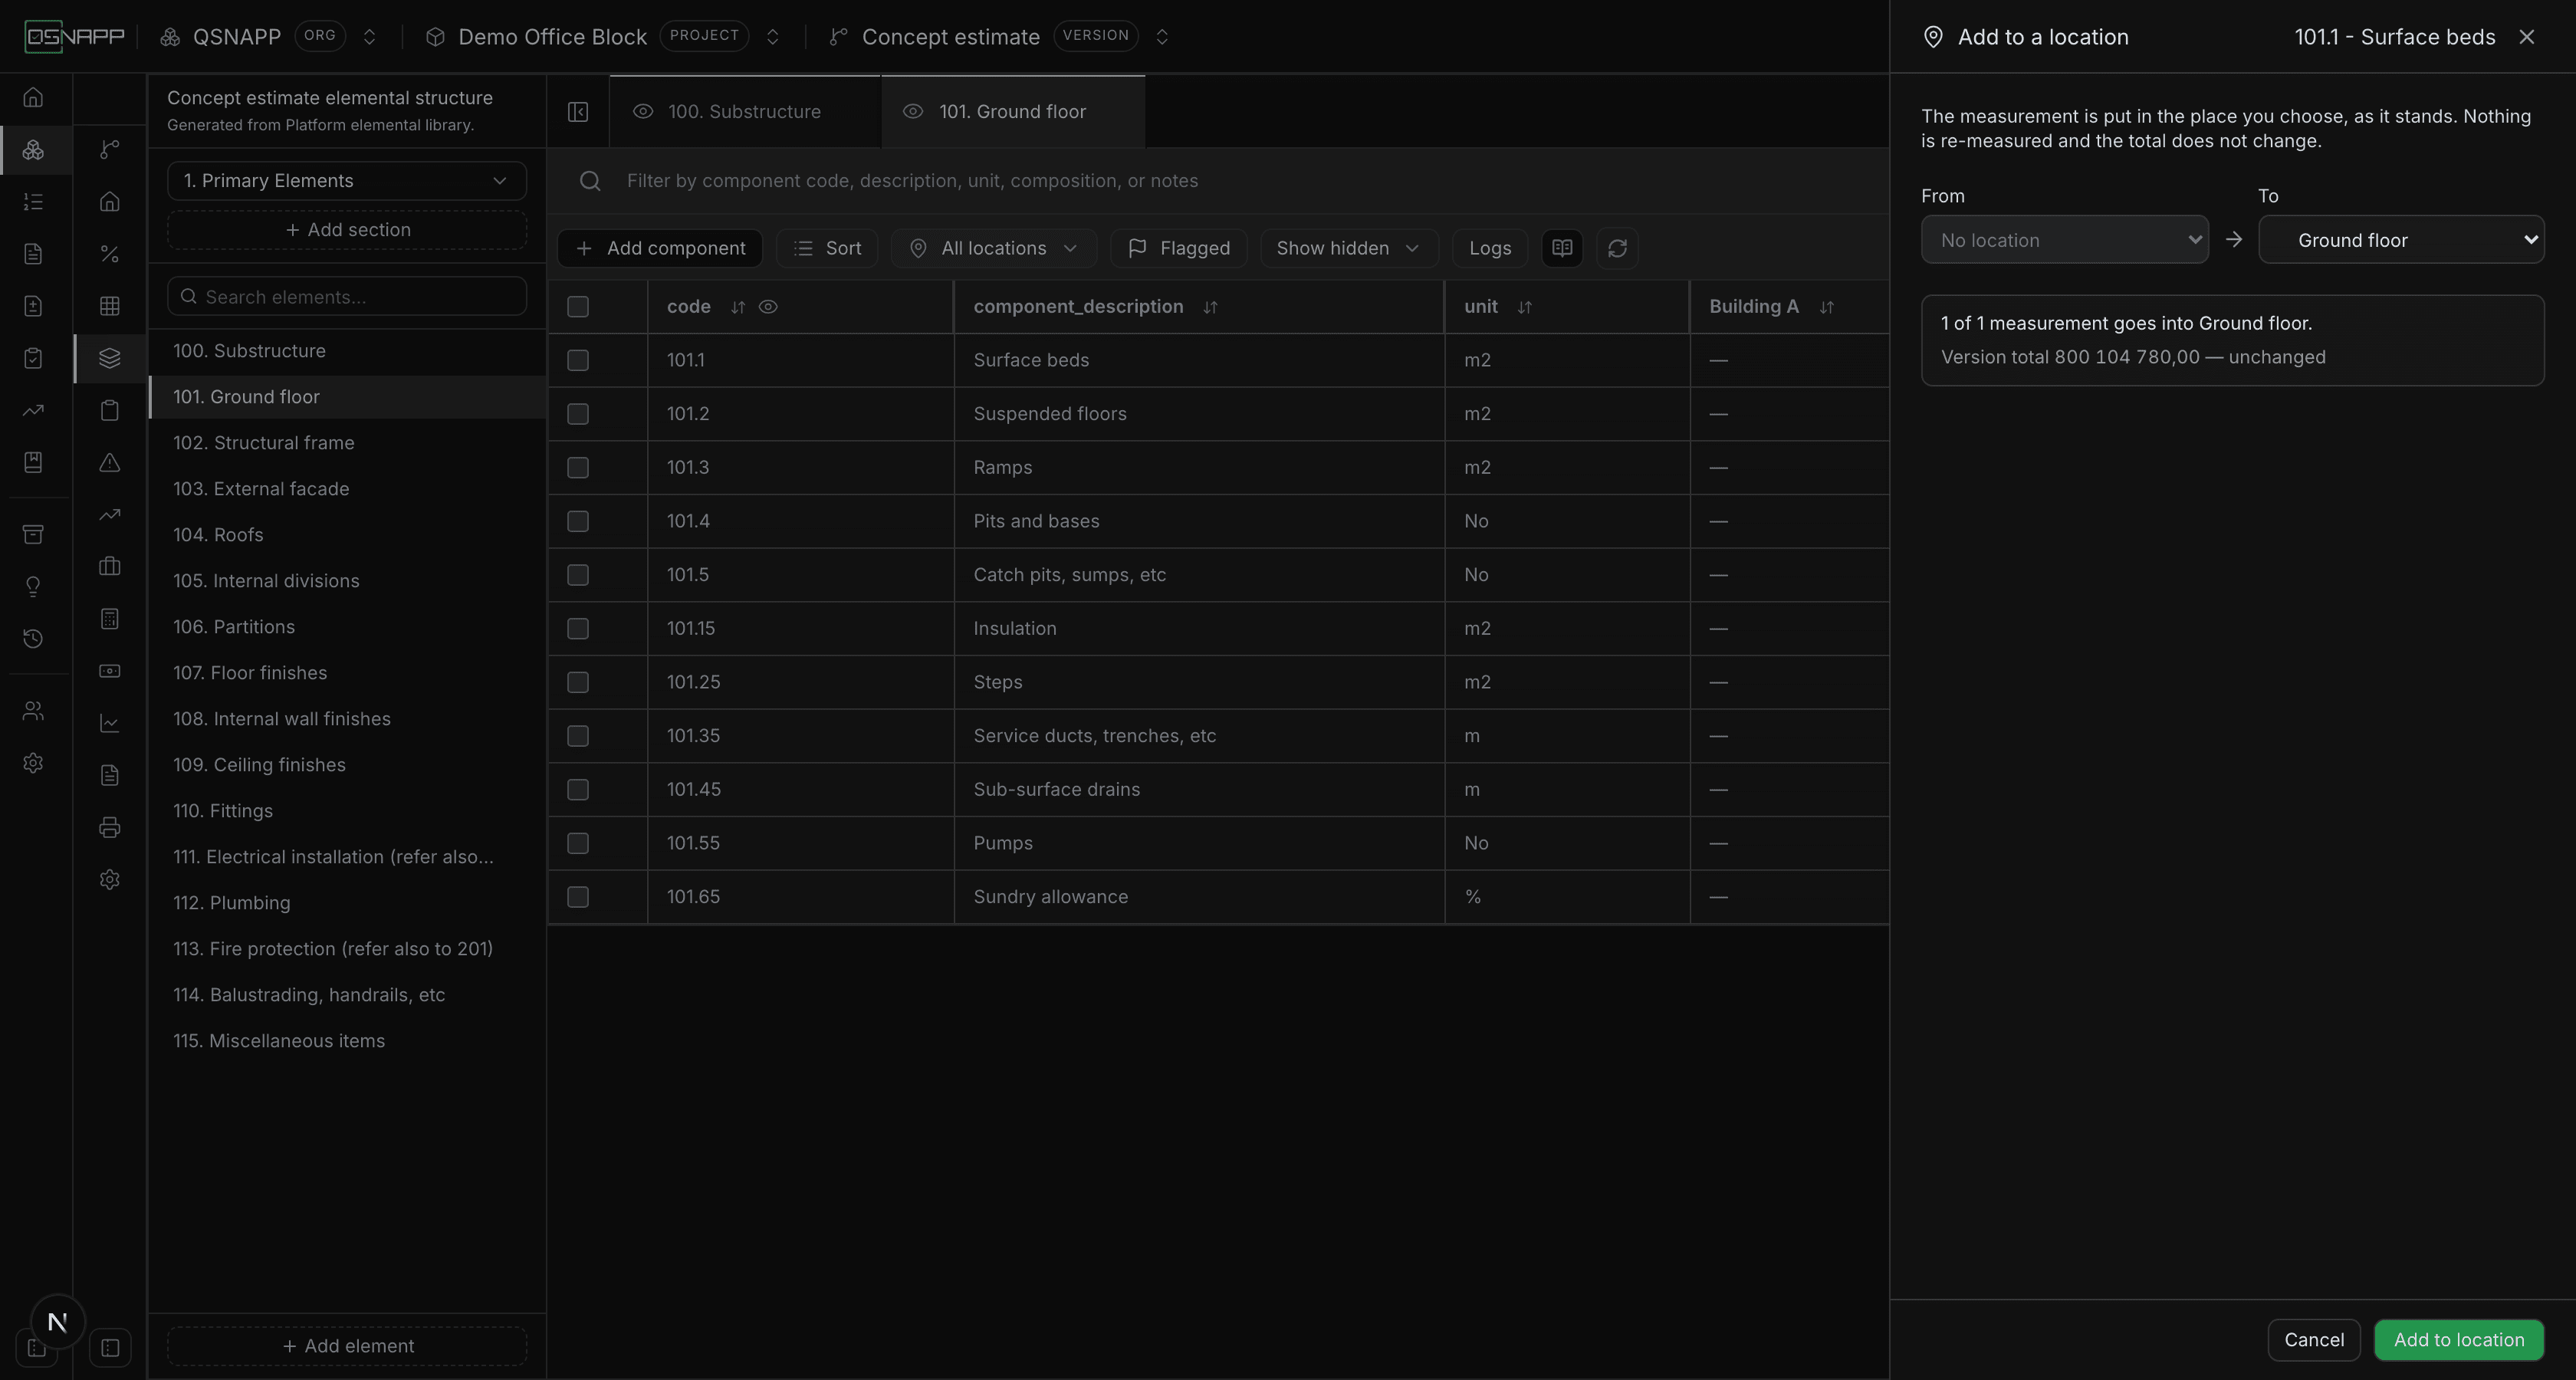
A measurement taken before any location was set up can be put in one afterwards. Hover the measurement cell and use the pin, or choose Add to a locationfrom the row's menu. The measurement goes into the location you choose as it stands, and any link it has to the area schedule goes with it.
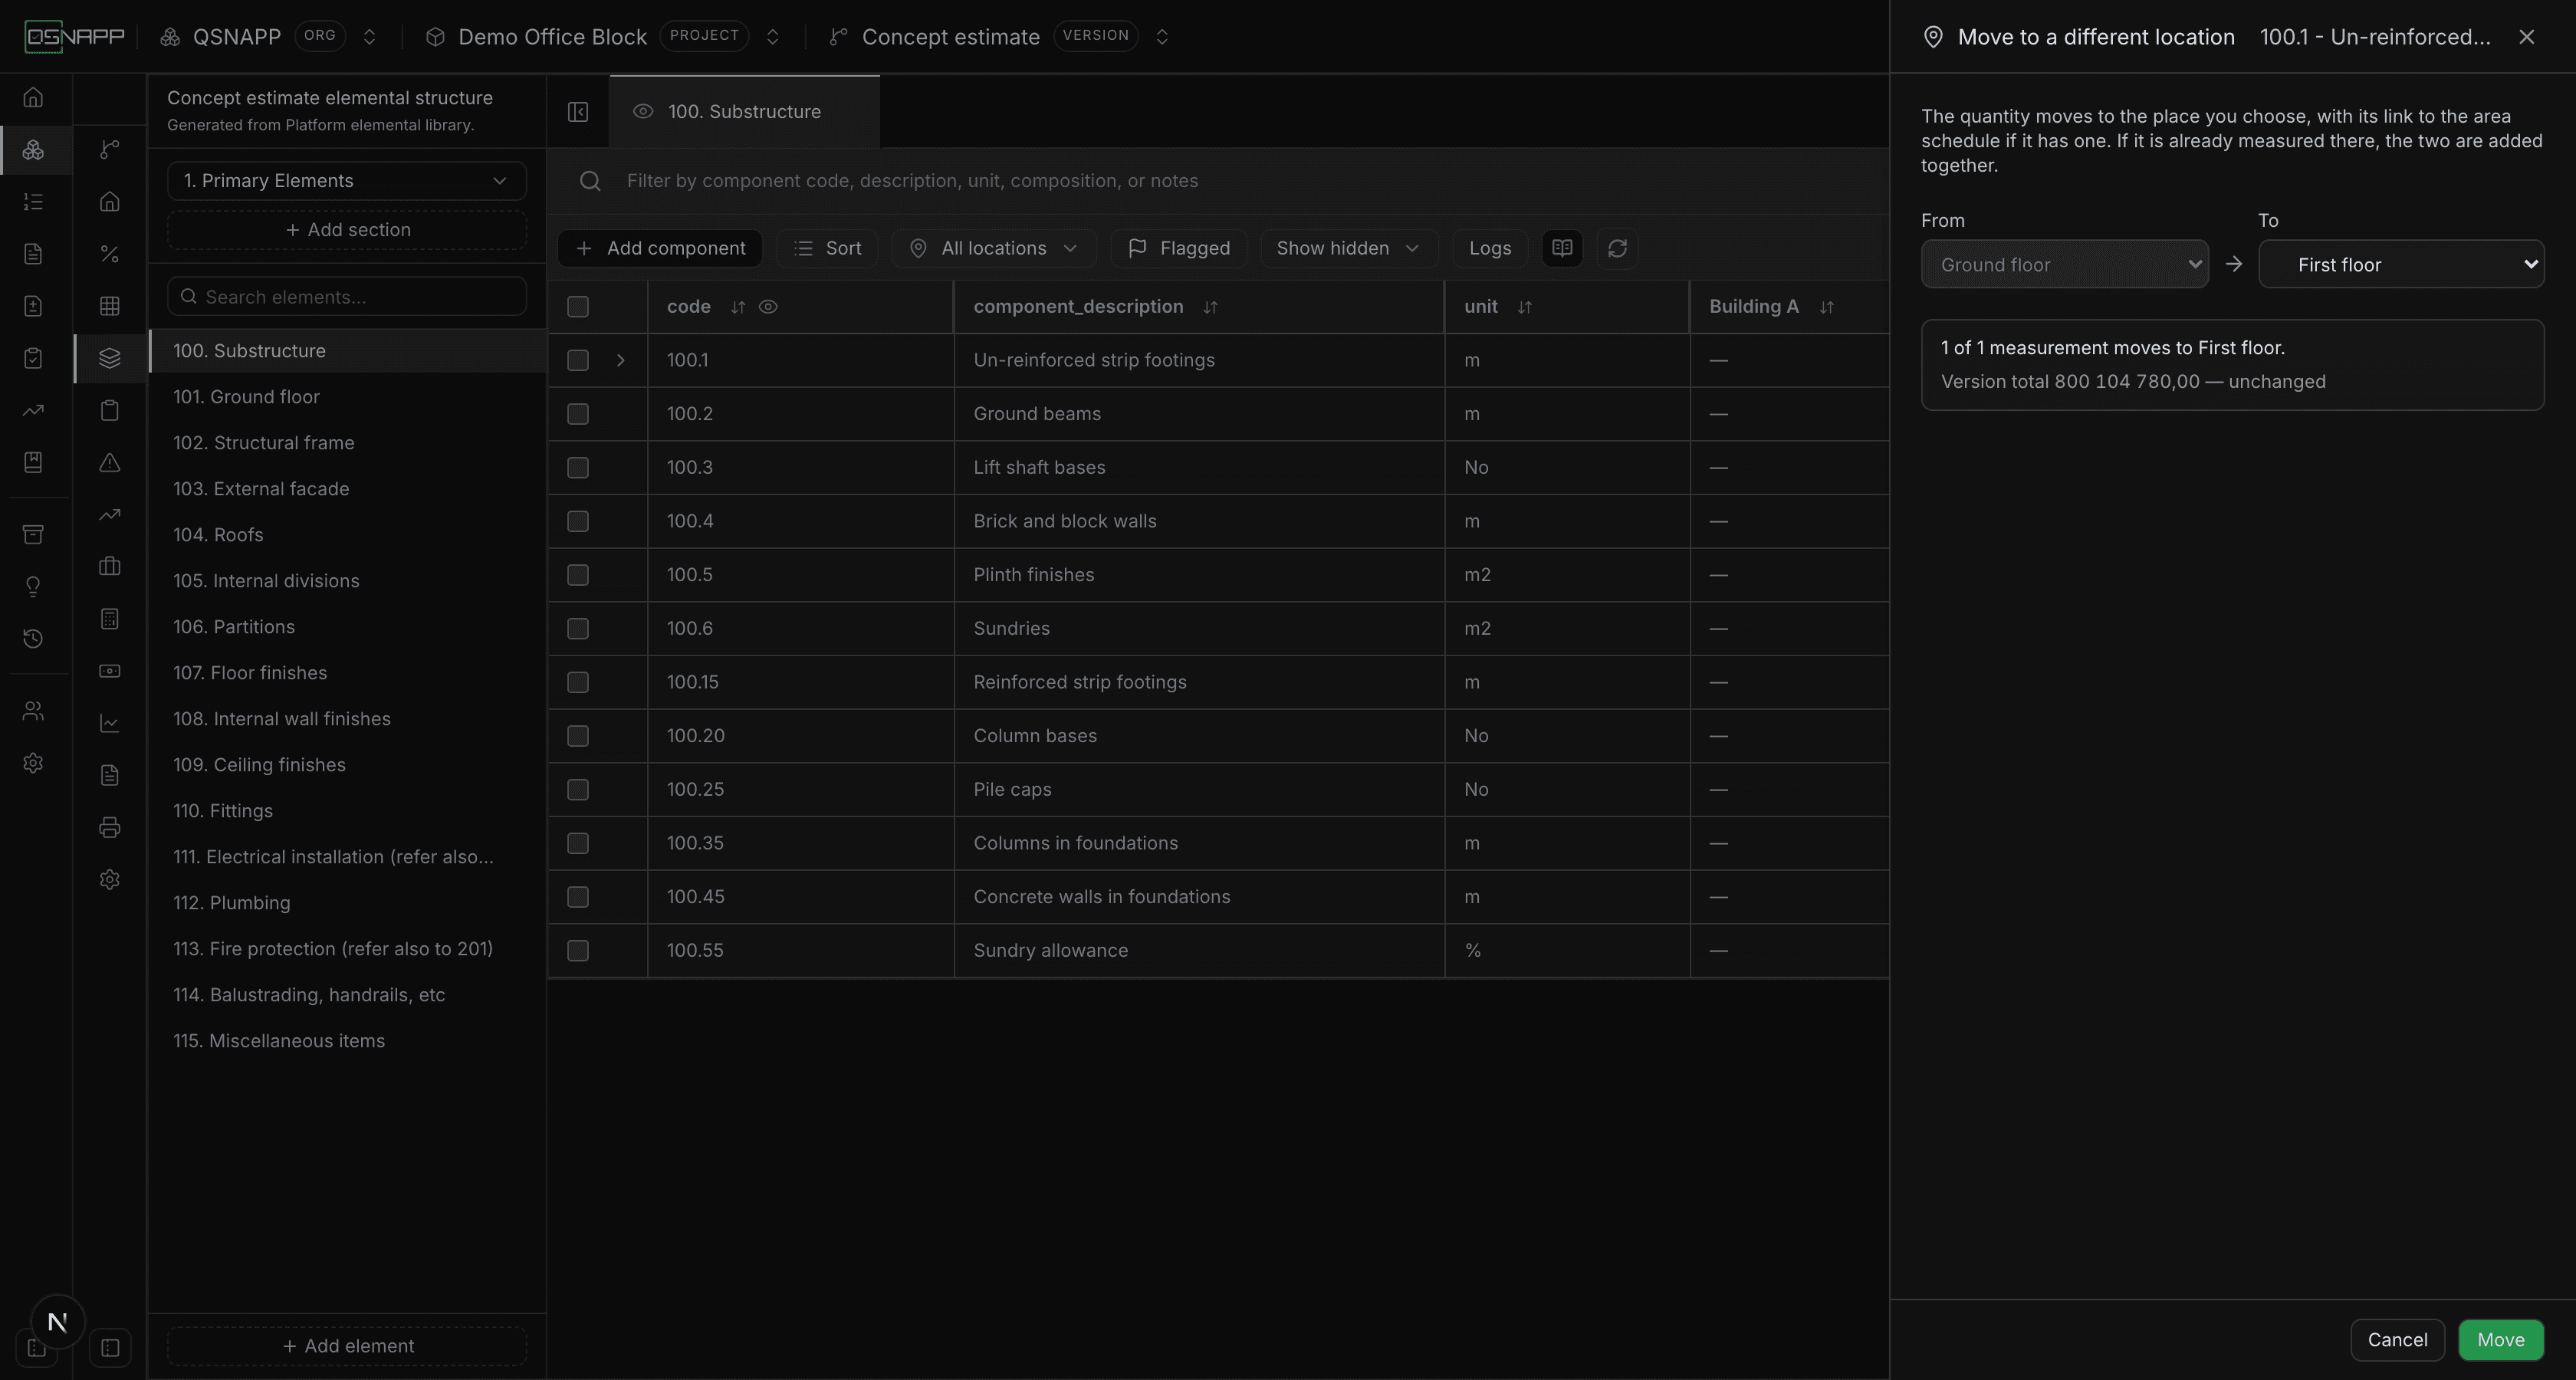
One already in a location is moved the same way: Move to a different location. Where the component is already measured at the destination, the two quantities are added together. A location linked to the area schedule keeps its link — Ground floor's link becomes First floor's. Before anything is written the drawer shows what would move, what would be left alone and why, and the version's total before and after — which a move should never change. Tick several rows first to move them together.
Three things are left where they are, and counted in the preview:
- adding a quantity to one already at the destination when either of them follows the area schedule — a linked figure cannot be added to another and stay one link;
- a move that would put a component in a place and a place inside it;
- adding together two locations priced at different rates, which would change the total.
Manage measurements
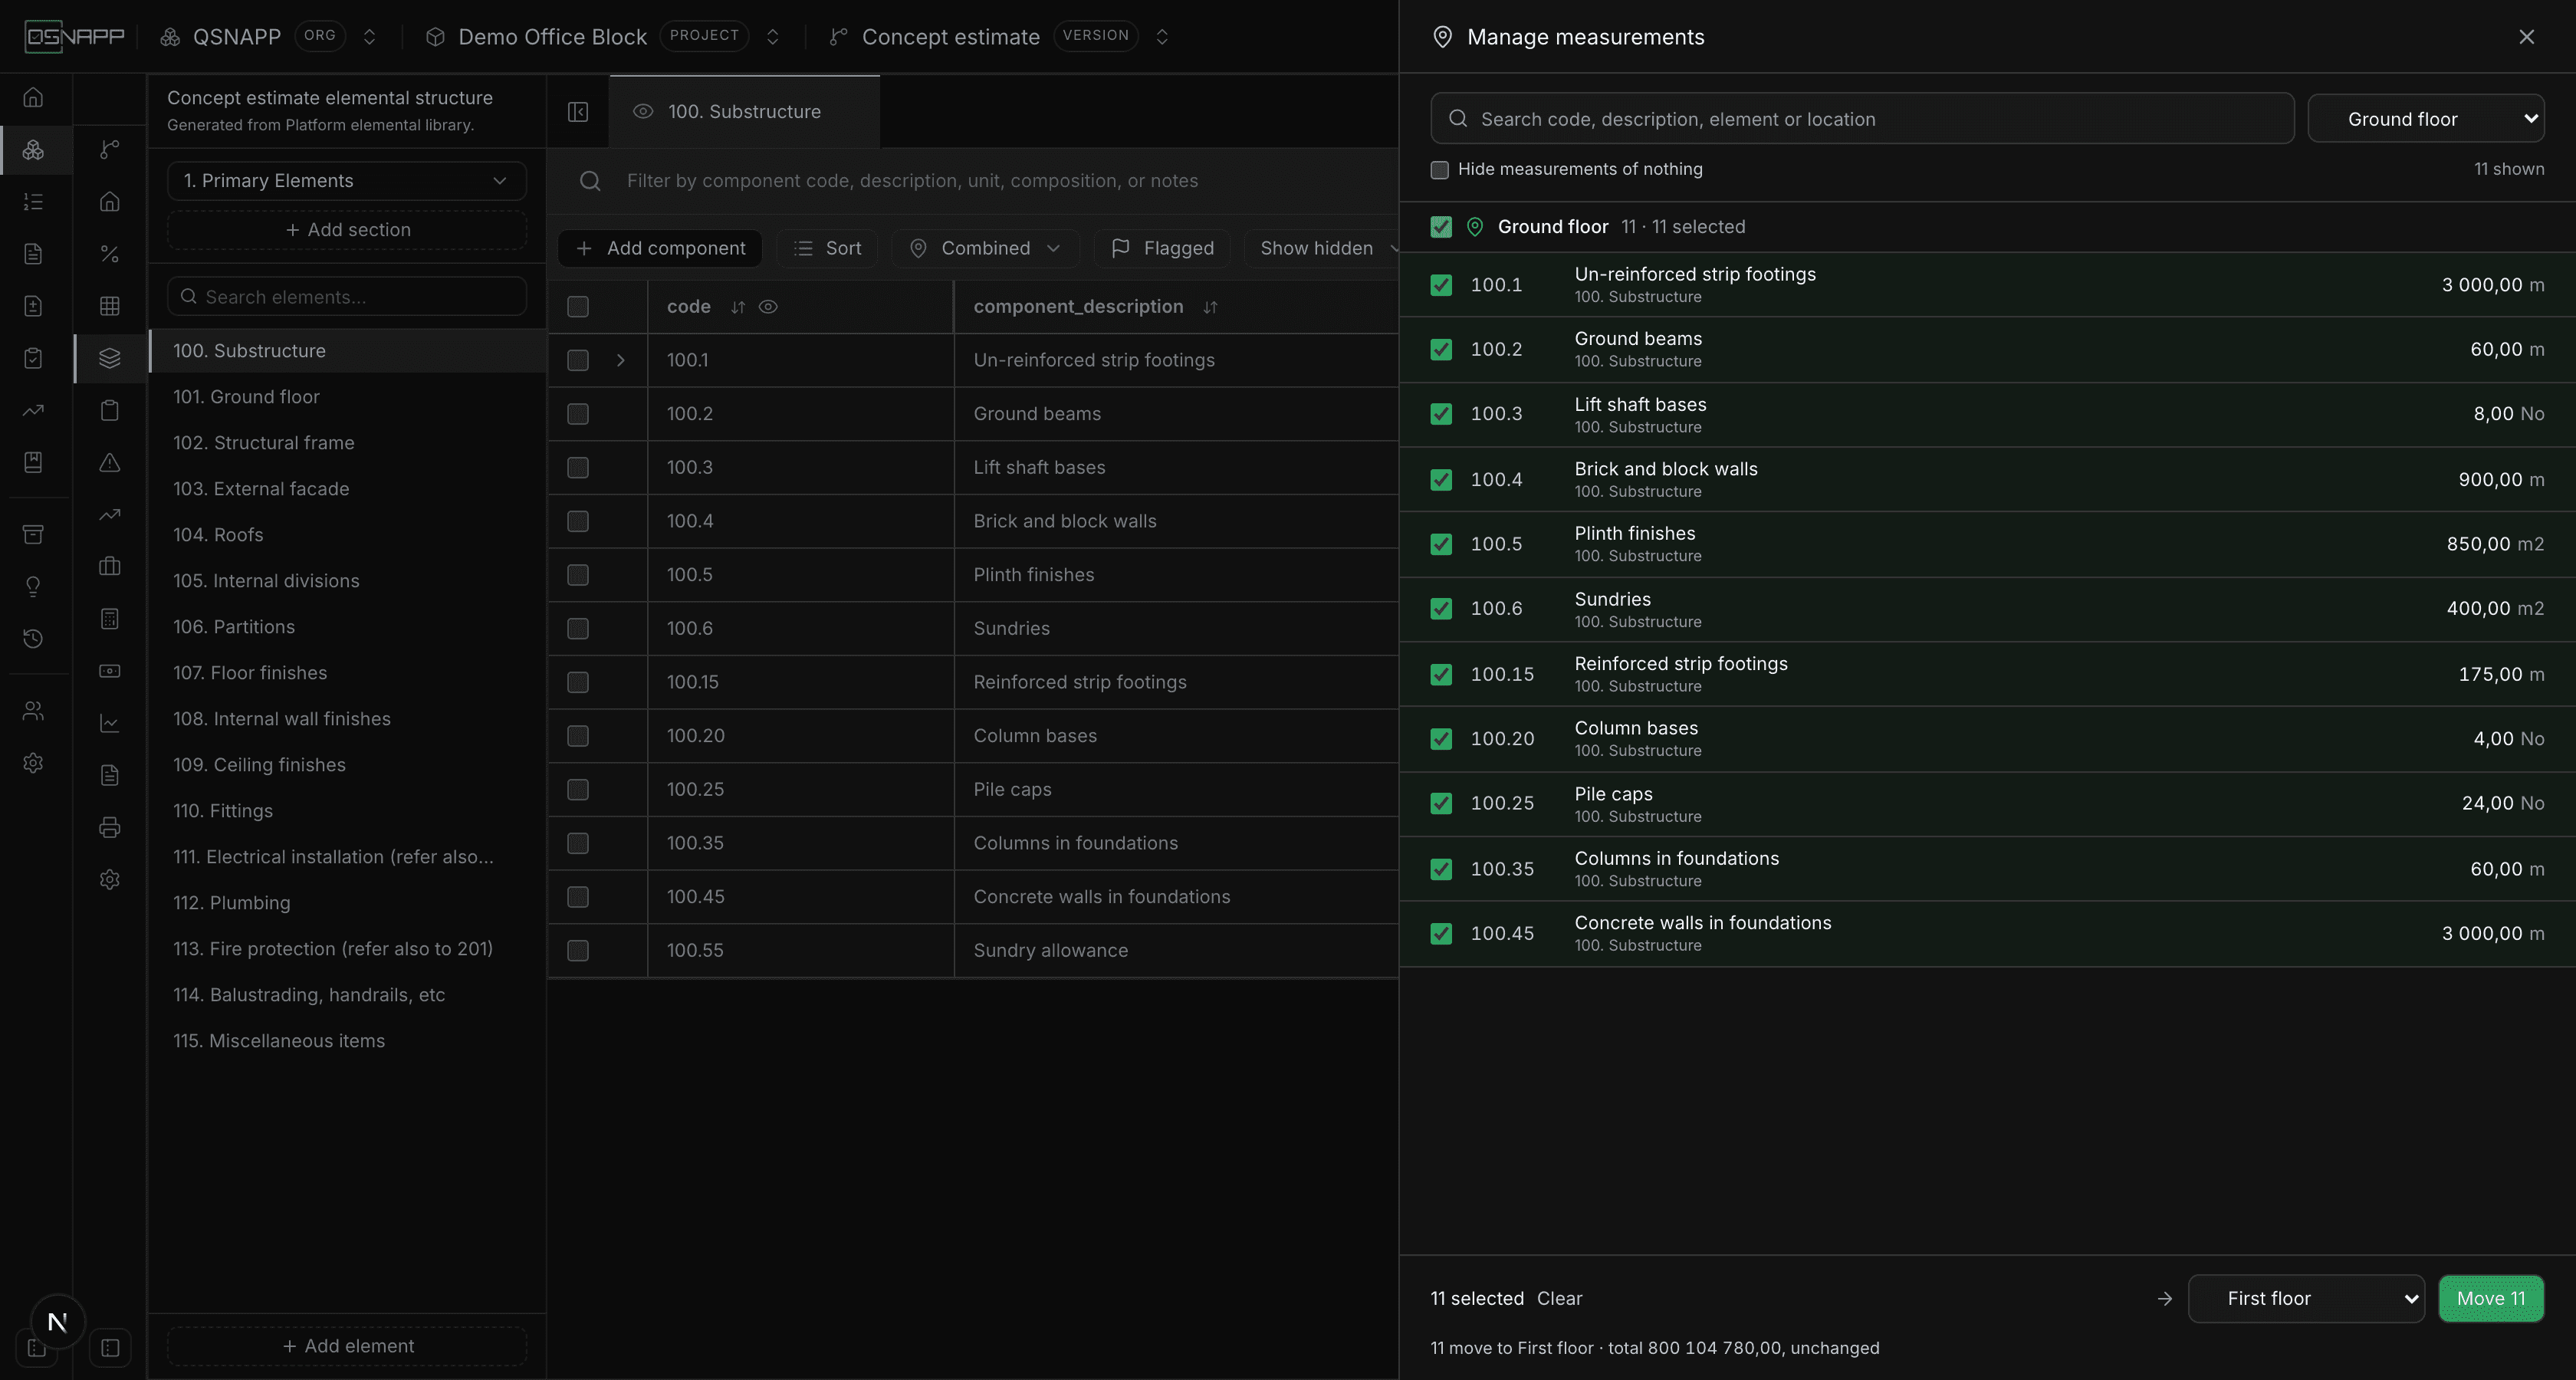
For more than a few rows, Manage measurements at the foot of the location menu opens every measurement in the version at once — each component under every location it is measured in, and under No locationwhen it has none. Search by code, description, element or location, narrow to one location, and tick rows, or a location's heading to tick everything in it. Any mixture can be moved together — all of one floor, a few rows of another, some that were never placed — to one location, with the same preview and the same rules as a single move. It happens as one change: all of it or none of it.
Following the area schedule
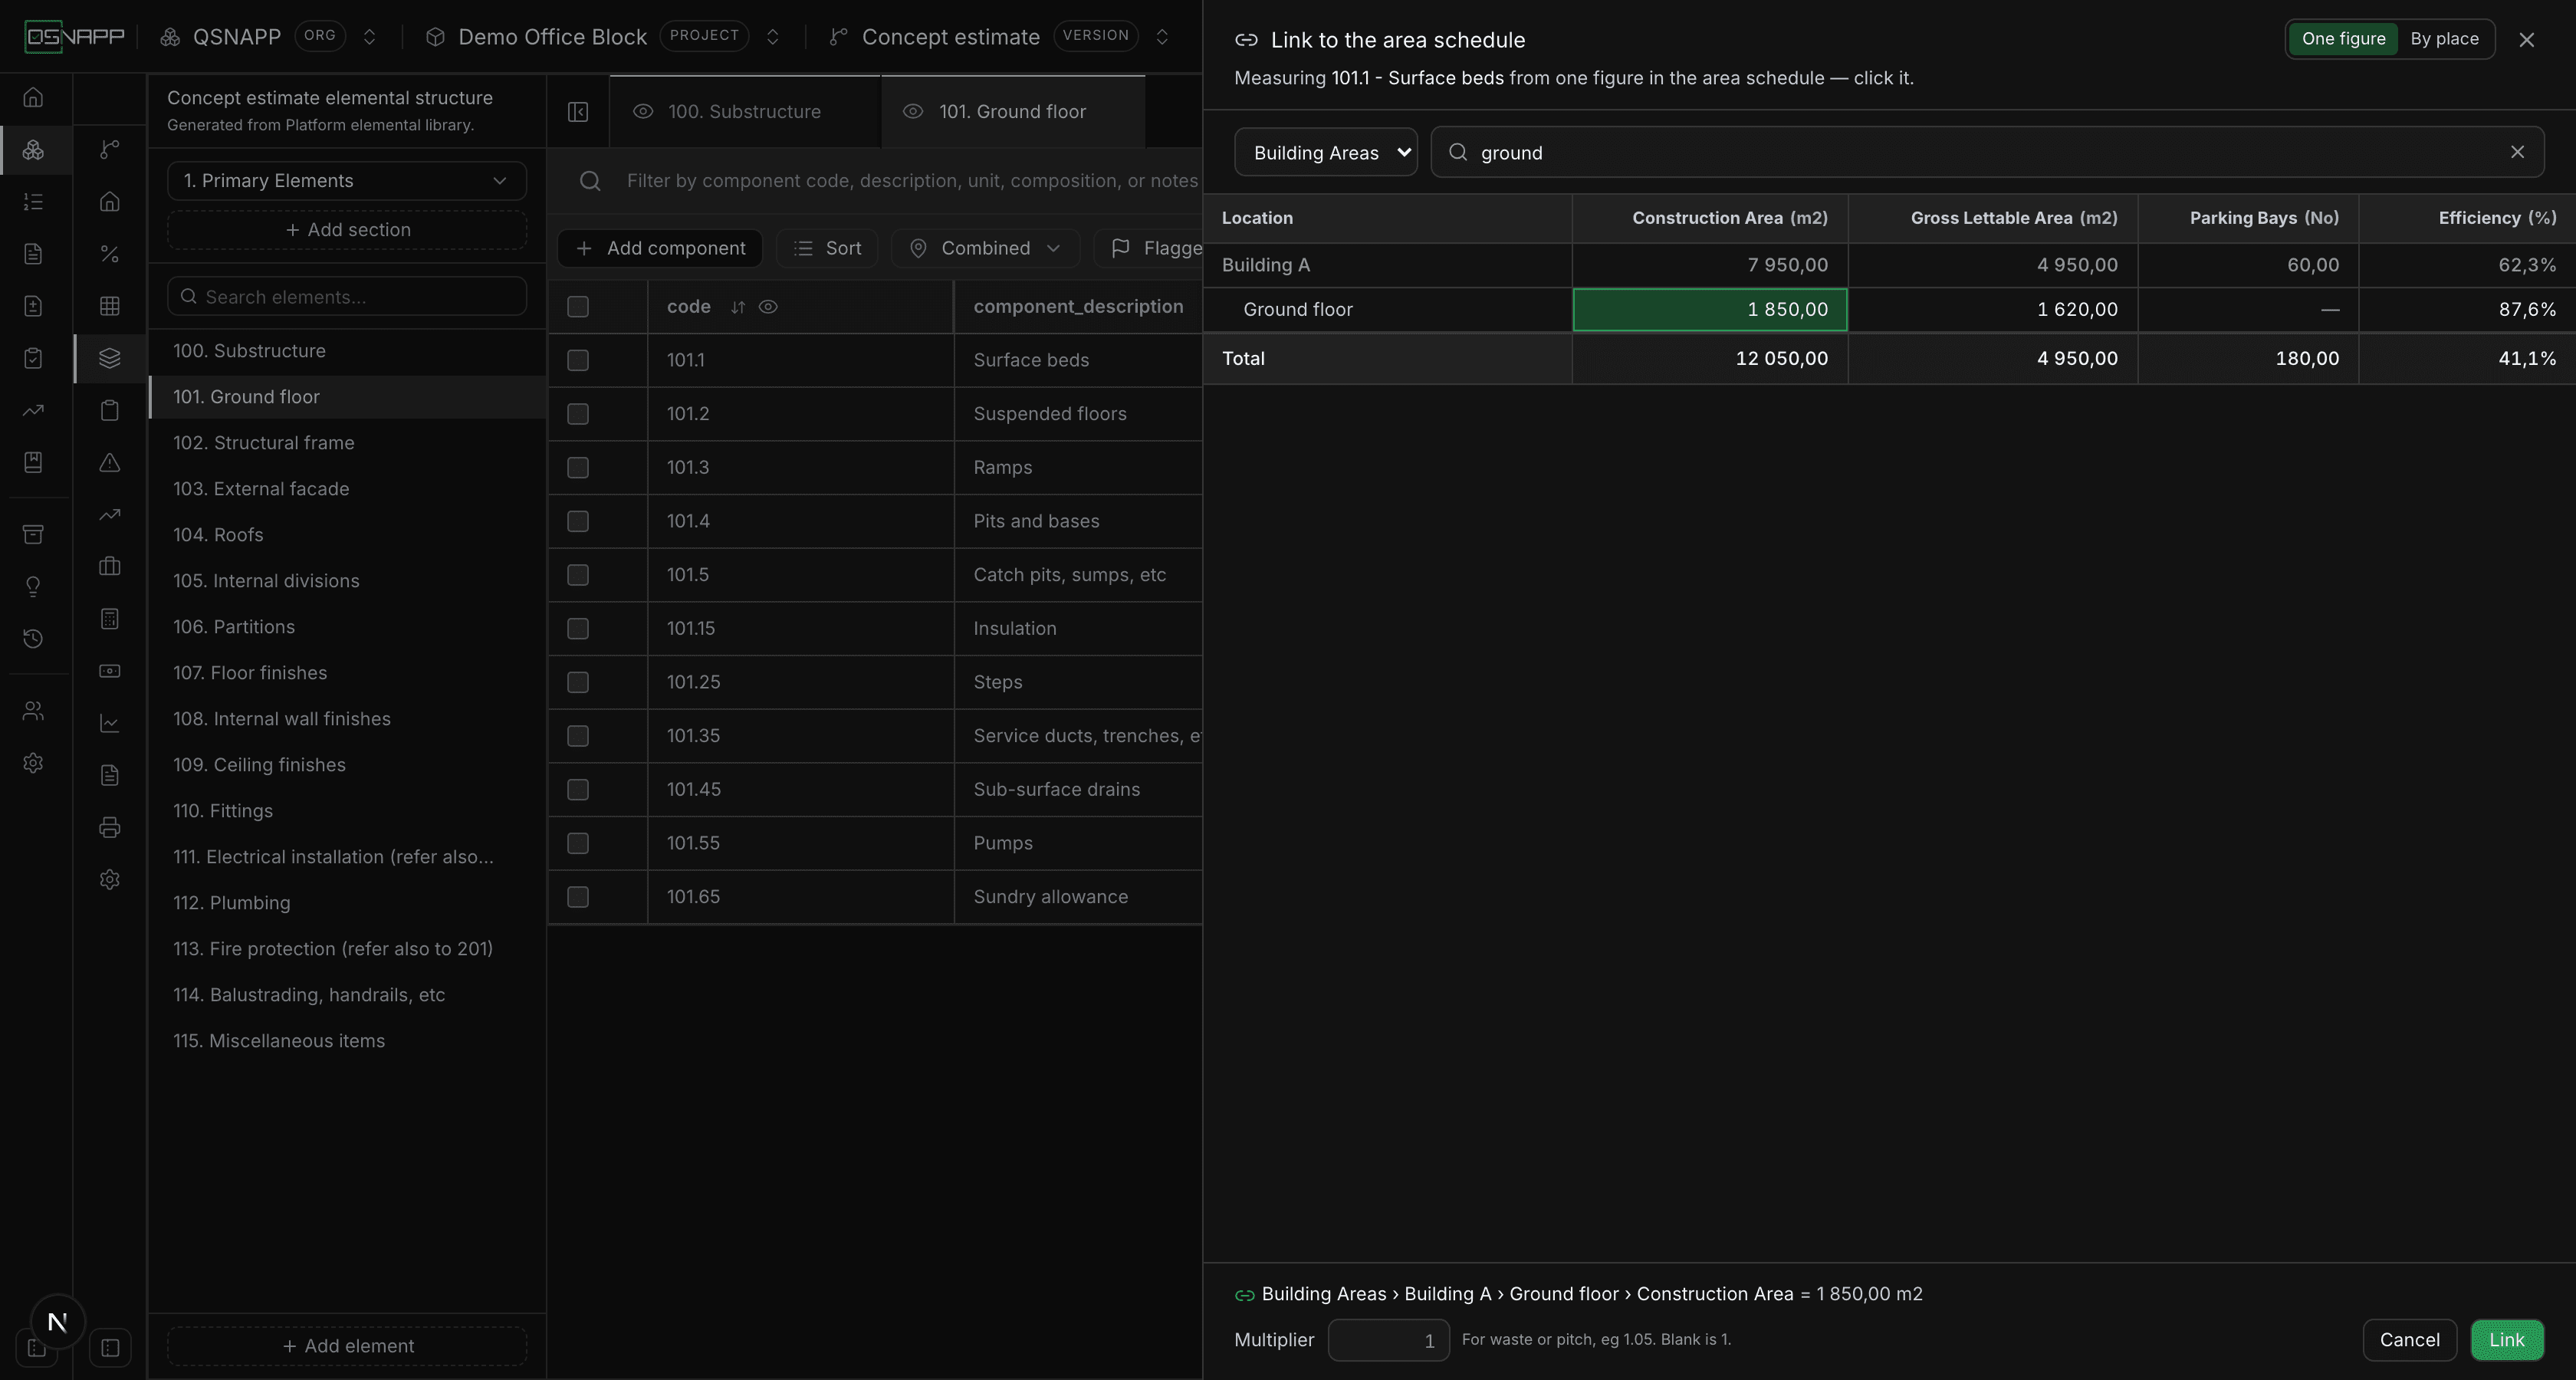
A quantity that is already on the area schedule— a floor area, a count of parking bays — does not have to be typed twice. Hover a measurement cell and use the link, and a drawer opens beside the grid with the schedule in it. Search for a place by name or by the building it is in, then click the figure: a column on one row, or a column's total for a measurement that is the whole project's. A multiplier covers waste or pitch — 1,05, 1,15 — and nothing else; arithmetic across figures belongs on the schedule as a derived column.
By placelinks a component measured by location: choose a column and tick the rows, and each ticked row becomes one of the component's locations, reading its own row. Ticking a row unticks the rows above and beneath it, so no floor is counted twice. Read by location, a location's own cell carries the same link control.
A linked measurement is shown in the accent colour and is not typed into. It does not move by itself: when a figure on the schedule changes, the estimate lists every measurement that follows it — grouped by section, element and row — and you tick the ones to update. One left unticked is unlinked, keeping the figure it had; closing the list leaves them waiting for later, marked as behind. Unlinking at any time keeps the figure. Copying the version carries the links into the copy.
Pricing from the rate sheet
A rate can be typed. It can also be linked to a rate on this project's rate sheet, so the figure comes from the sheet rather than from memory — and so that changing the sheet later can be carried through to everything priced from it.
Two places take a link, because those are the two places a rate is stated:
- A composition line — the usual one. The concrete line of a footing is priced from the sheet's concrete rate, and the component's own rate stays the sum of its lines.
- A component, from its rate cell — for components priced directly, with no build-up behind them.
A component that has a build-up cannot be linked at the component level. Its rate is the sum of its lines, so a link there would be overwritten the next time those lines were added up; the menu says so rather than offering something that quietly stops working. Link the lines instead.
Links point at this project's rate sheet and nothing else. That is the reason the project keeps its own copy: your organisation revising its library must not silently reprice an estimate that has already been signed off. See Rates for how a sheet gets into a project.
Linking a rate
Hovering a composition line reveals a link control in its rate cell. A component priced directly shows the same control on its own rate cell. Both open the rate lookup.
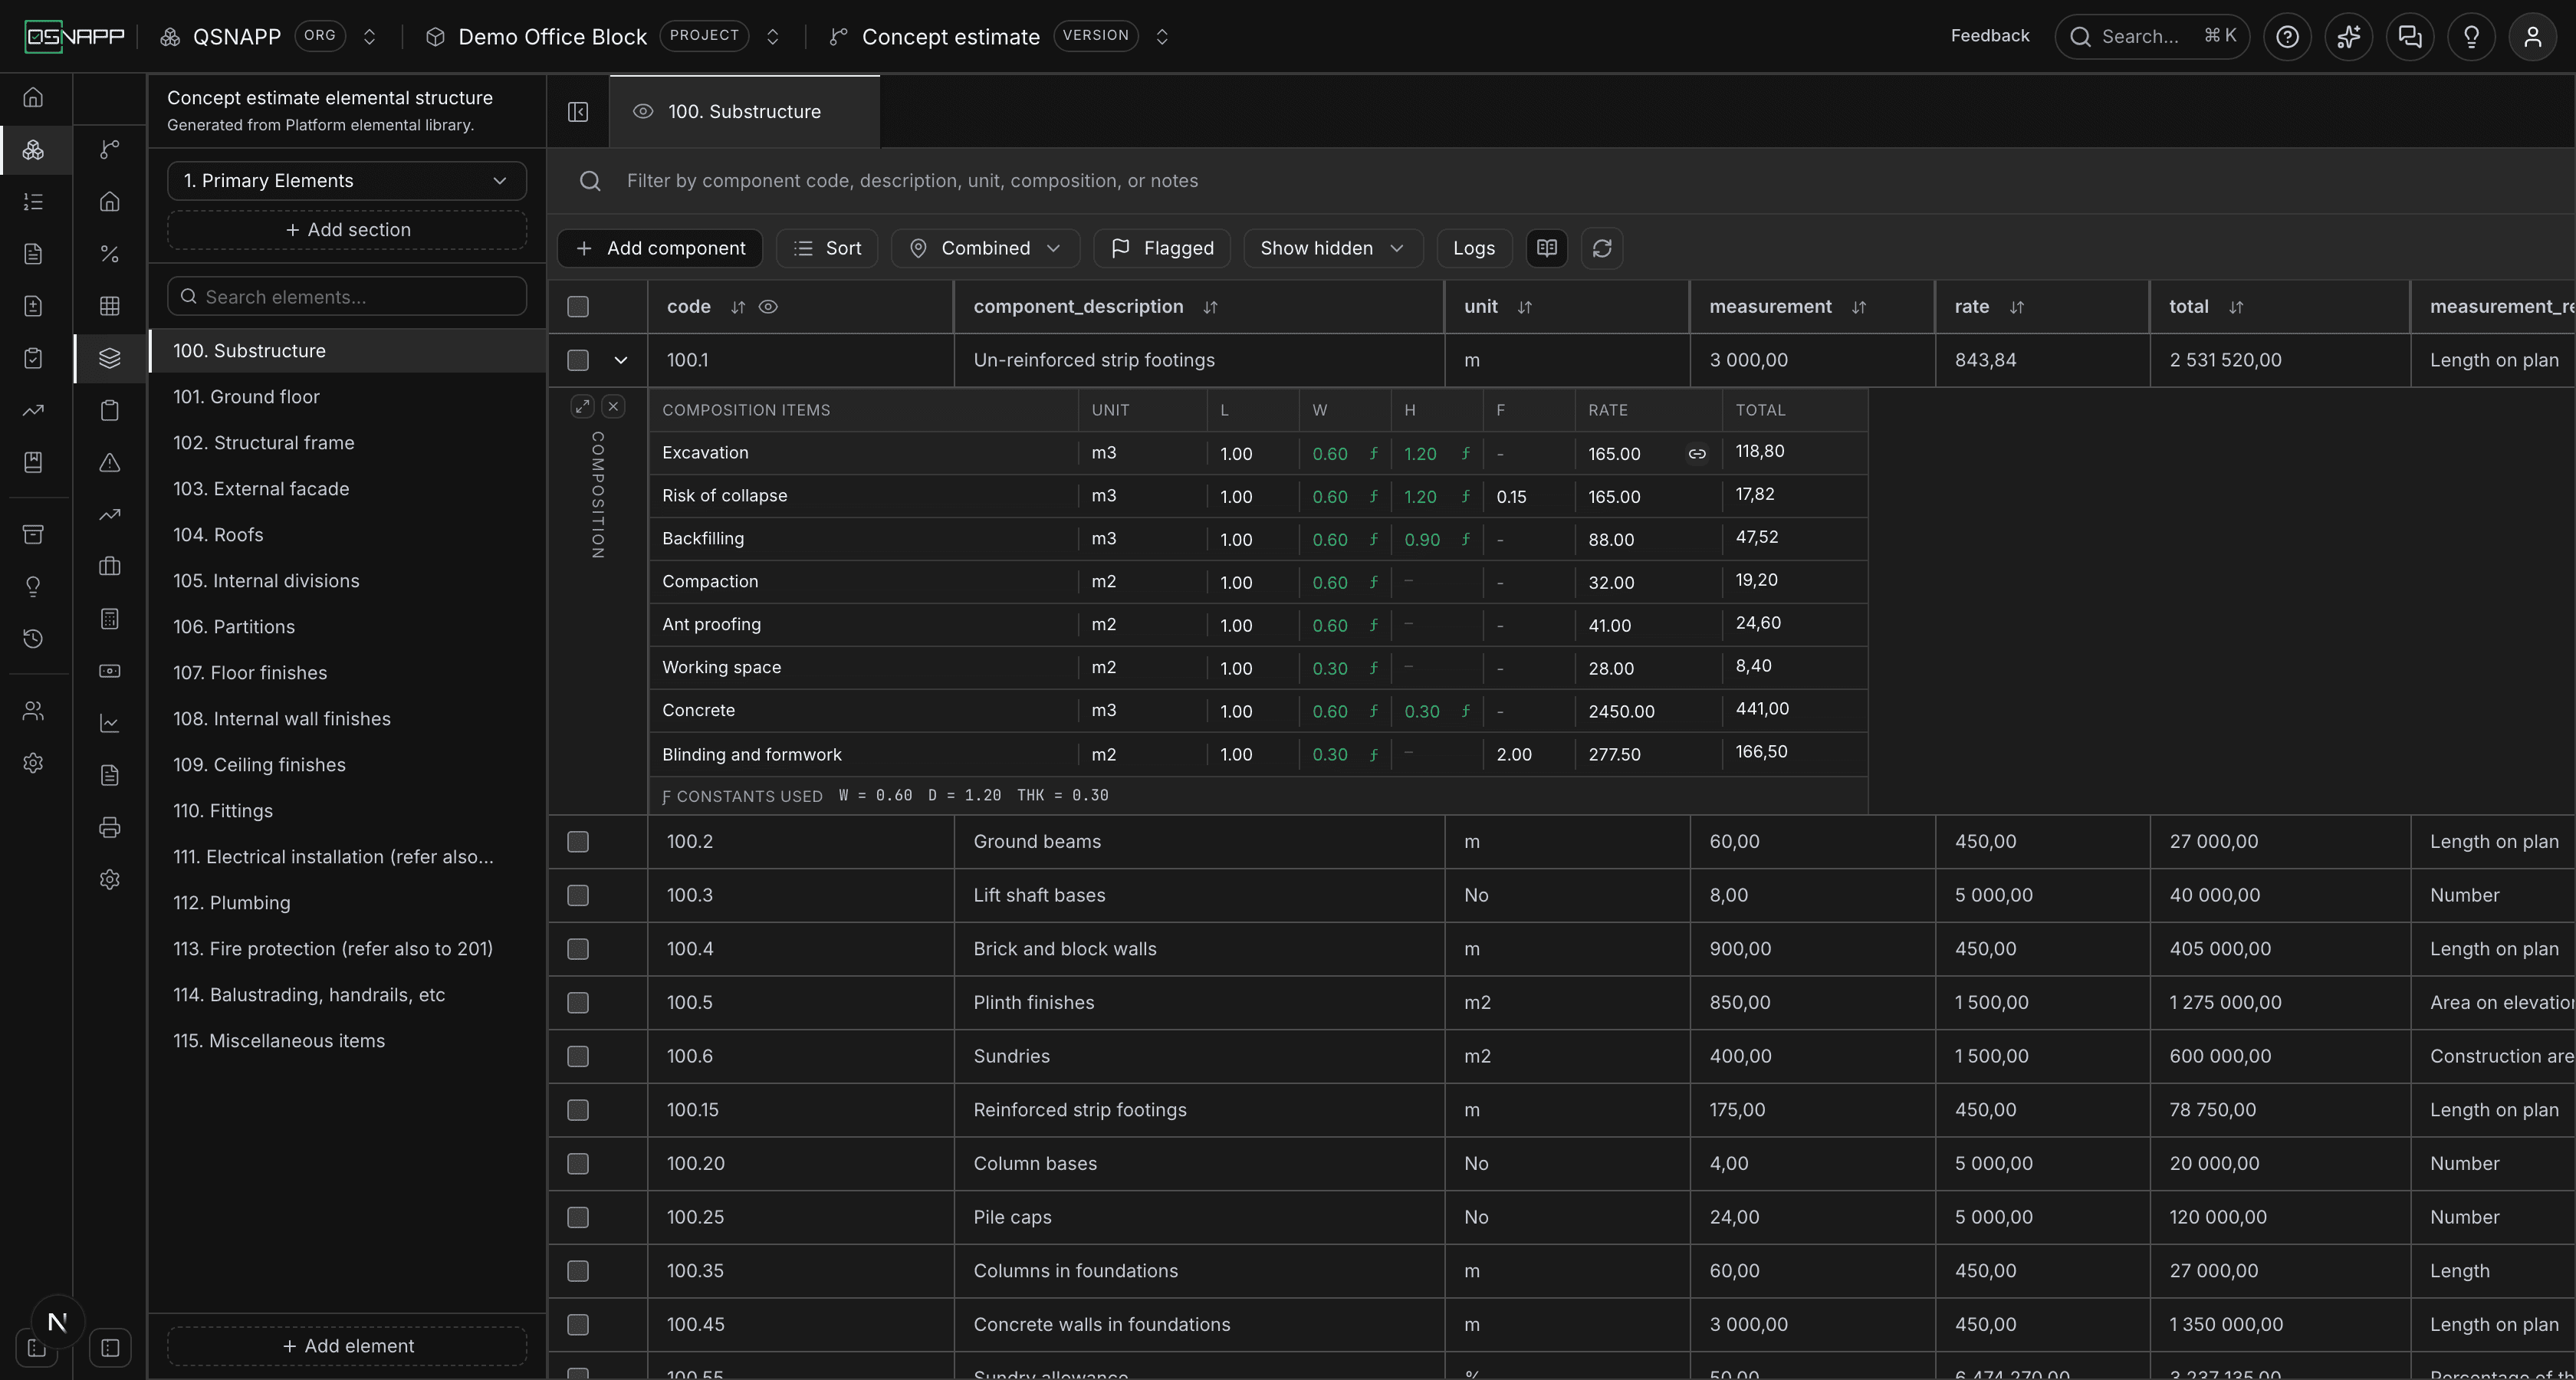
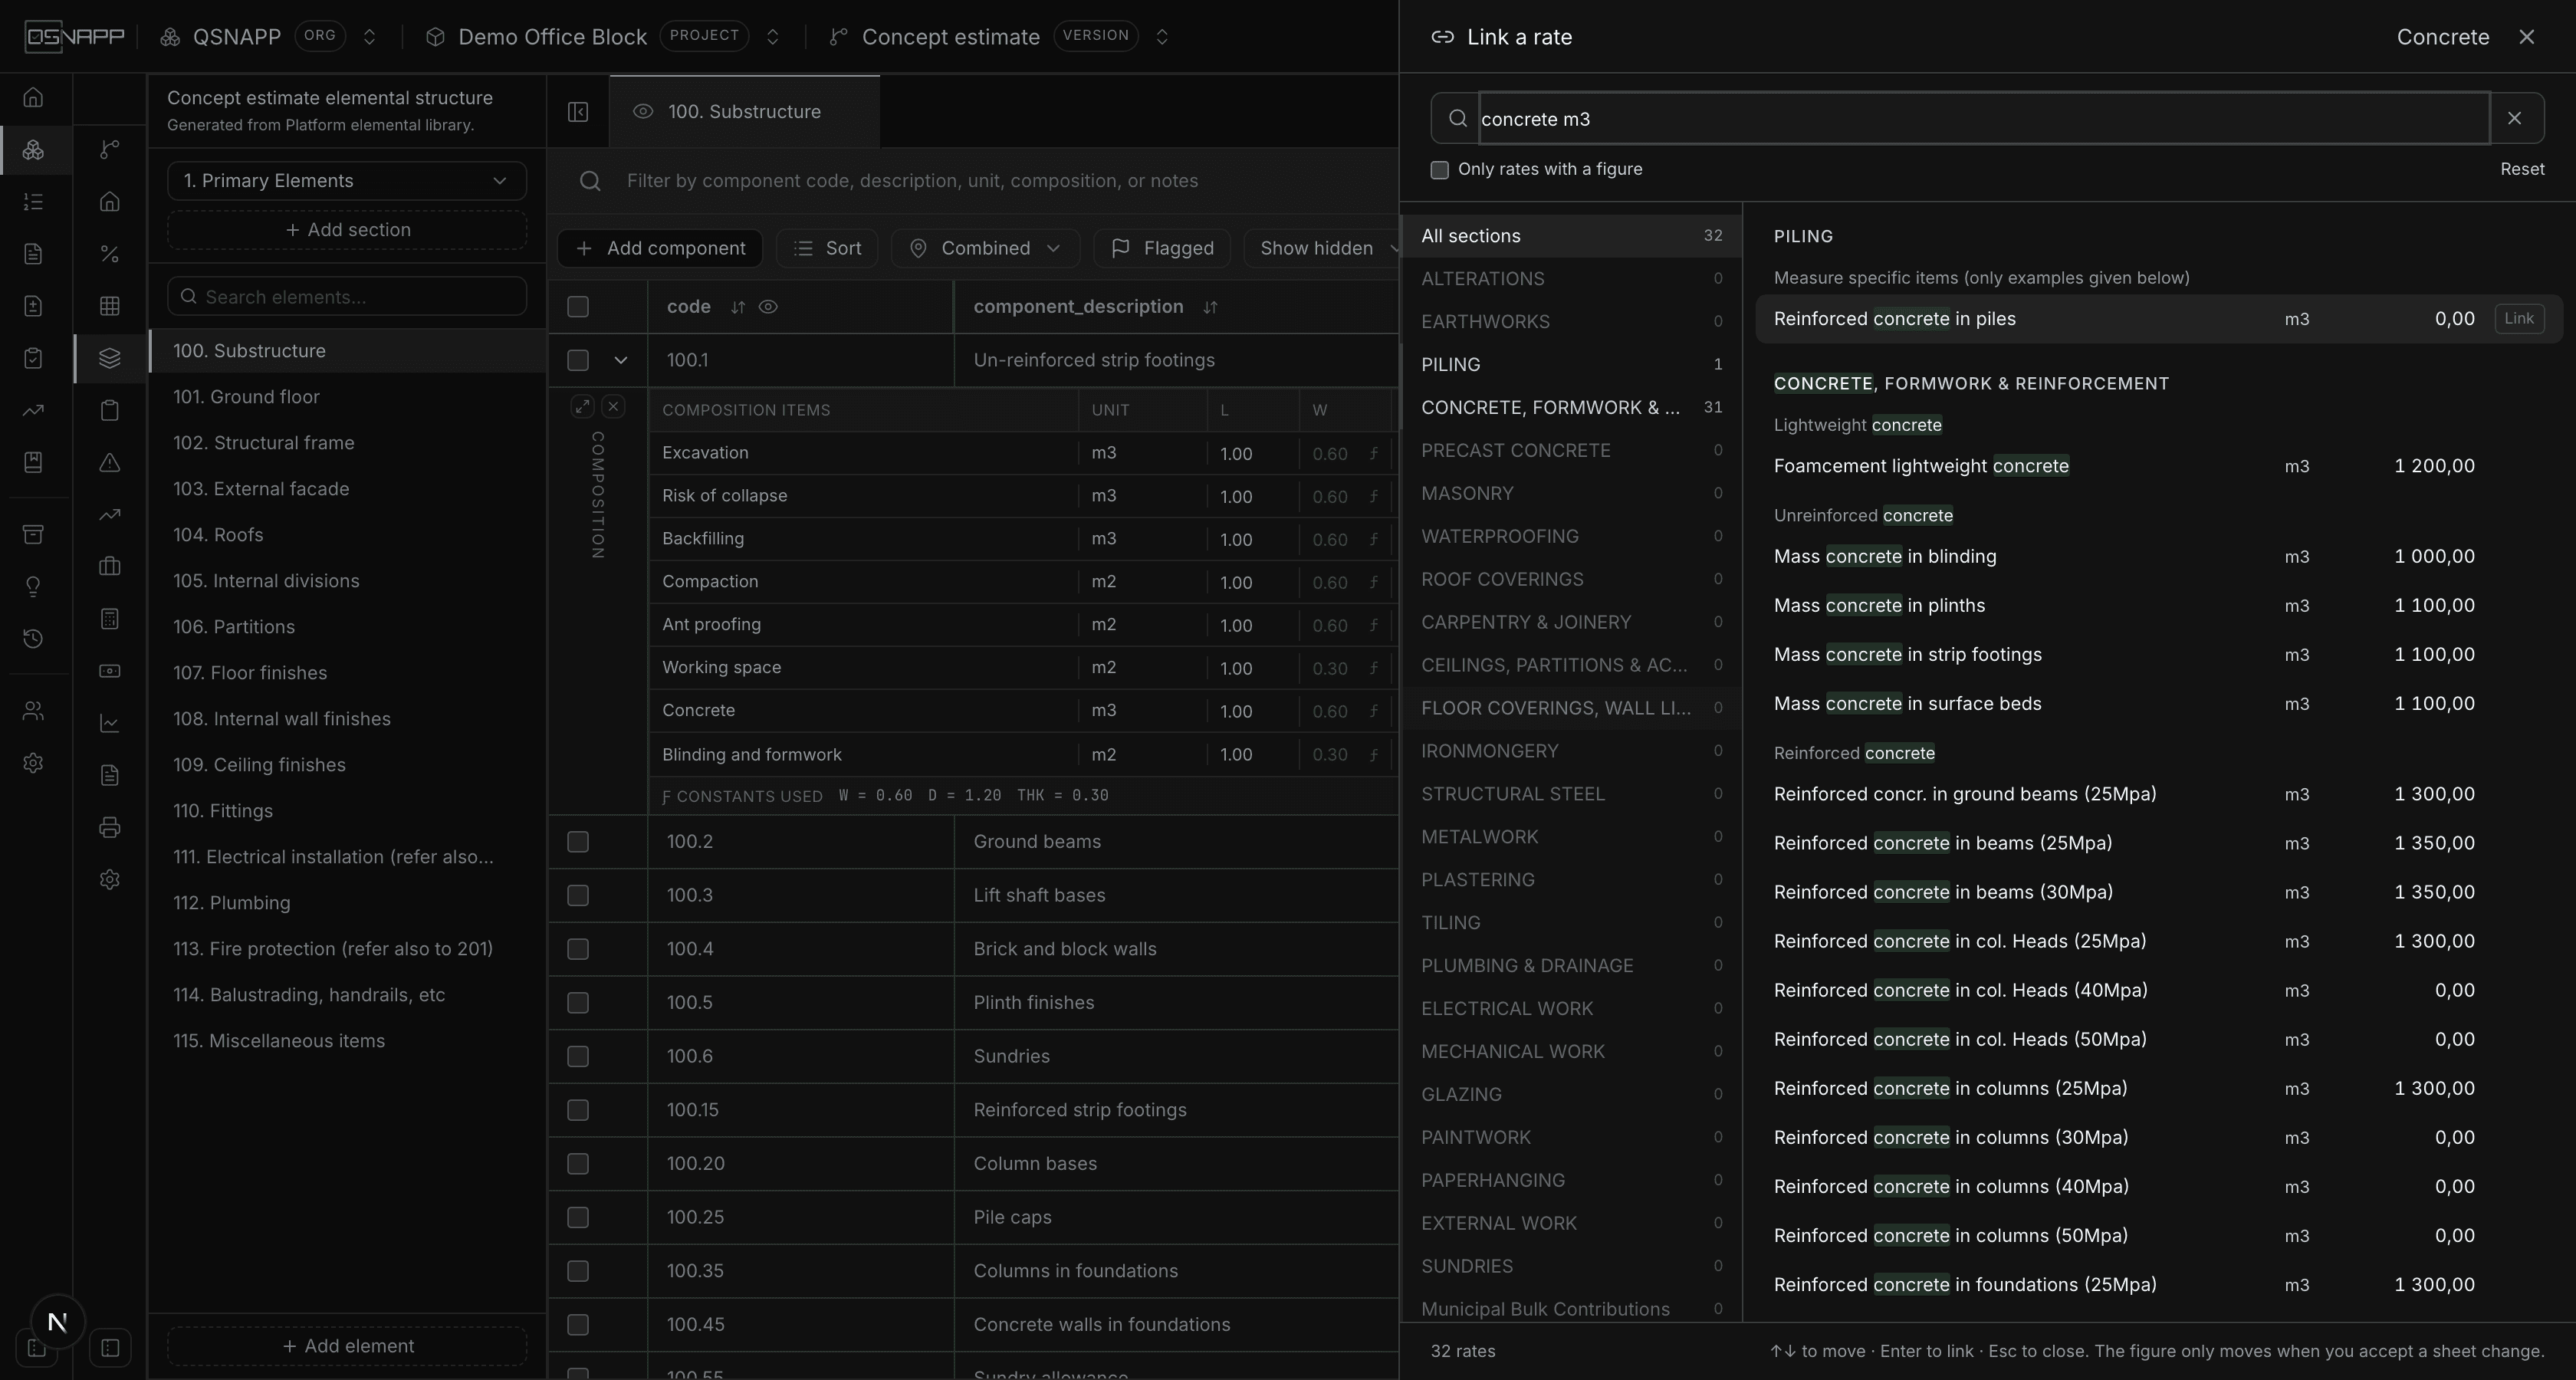
The lookup opens in a drawer on the right, so the line you are pricing stays in view. It opens on the whole sheet rather than an empty box, with a few suggestions drawn from the line's own wording at the top — you are more likely to recognise the rate than to guess its wording. Browse by section from the list down the left; choosing a section opens it to list its elements, so you can narrow to one. Typing narrows every level at once, and every term can match any part of a rate: its description, its section, its element or its unit. “concrete m3” finds the m³ concrete rates even though neither word alone narrows anything, and the section counts show where the matches are.
Choosing a rate prices the line from it. The line's total is recalculated, and the component above it is re-added from its lines — so the rate, the total and the component all move together rather than one at a time.
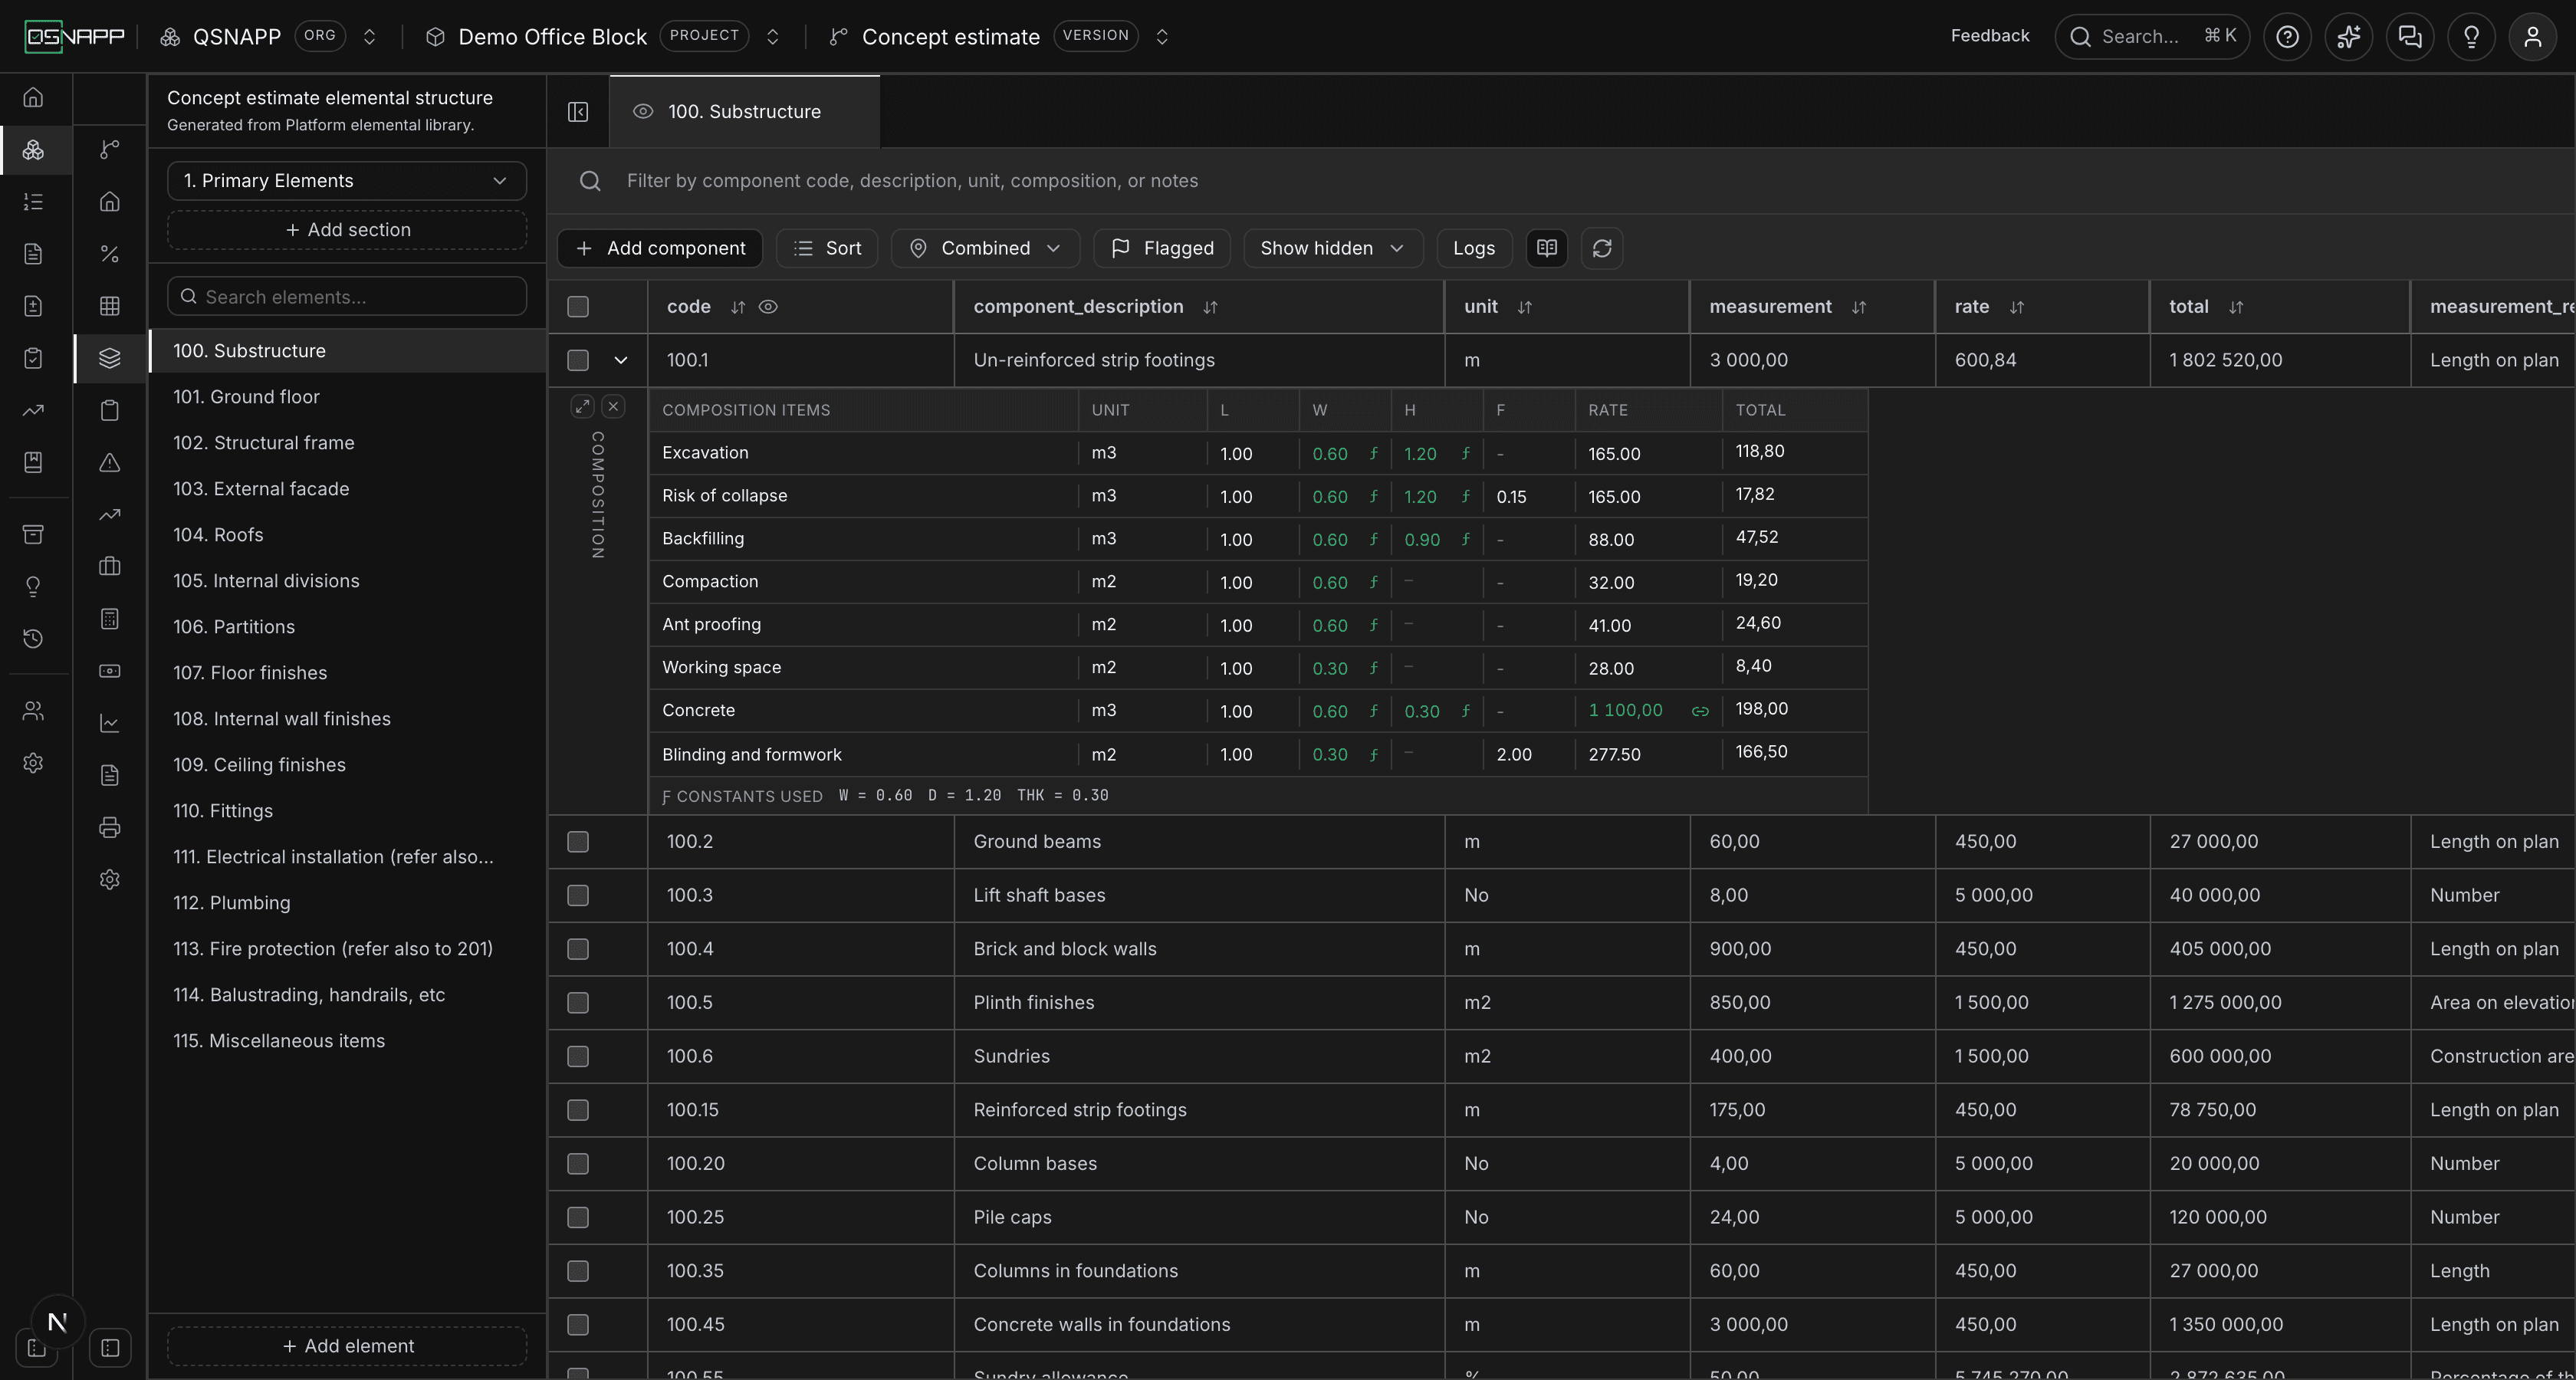
A linked cell is read-only. The figure belongs to the sheet now, and typing over it would be a change nothing recorded. The two ways to change it are both reachable from the cell: edit the rate on the sheet, or remove the link and type. Clicking a linked figure opens the lookup with the linked rate at the top, where Show in sheet takes you to its section and Remove link leaves the figure exactly where it is — it stops tracking the sheet, it does not forget what the work costs.
When the sheet moves
A link does not mean “always show whatever the sheet says”. When a rate changes, you are asked which of the places priced from it should move — see Rates. Anything you leave alone keeps the figure it was priced at, and says so here: the rate turns amber with a warning mark, and the tooltip reads Priced at R1 100,00. The sheet now says R1 250,00.
That is the point of declining, rather than a fault to fix. An estimate agreed with a client at last month's rate should keep that rate and be visibly doing so — not quietly disagree with the sheet, and not be dragged along by it.
Editing a component

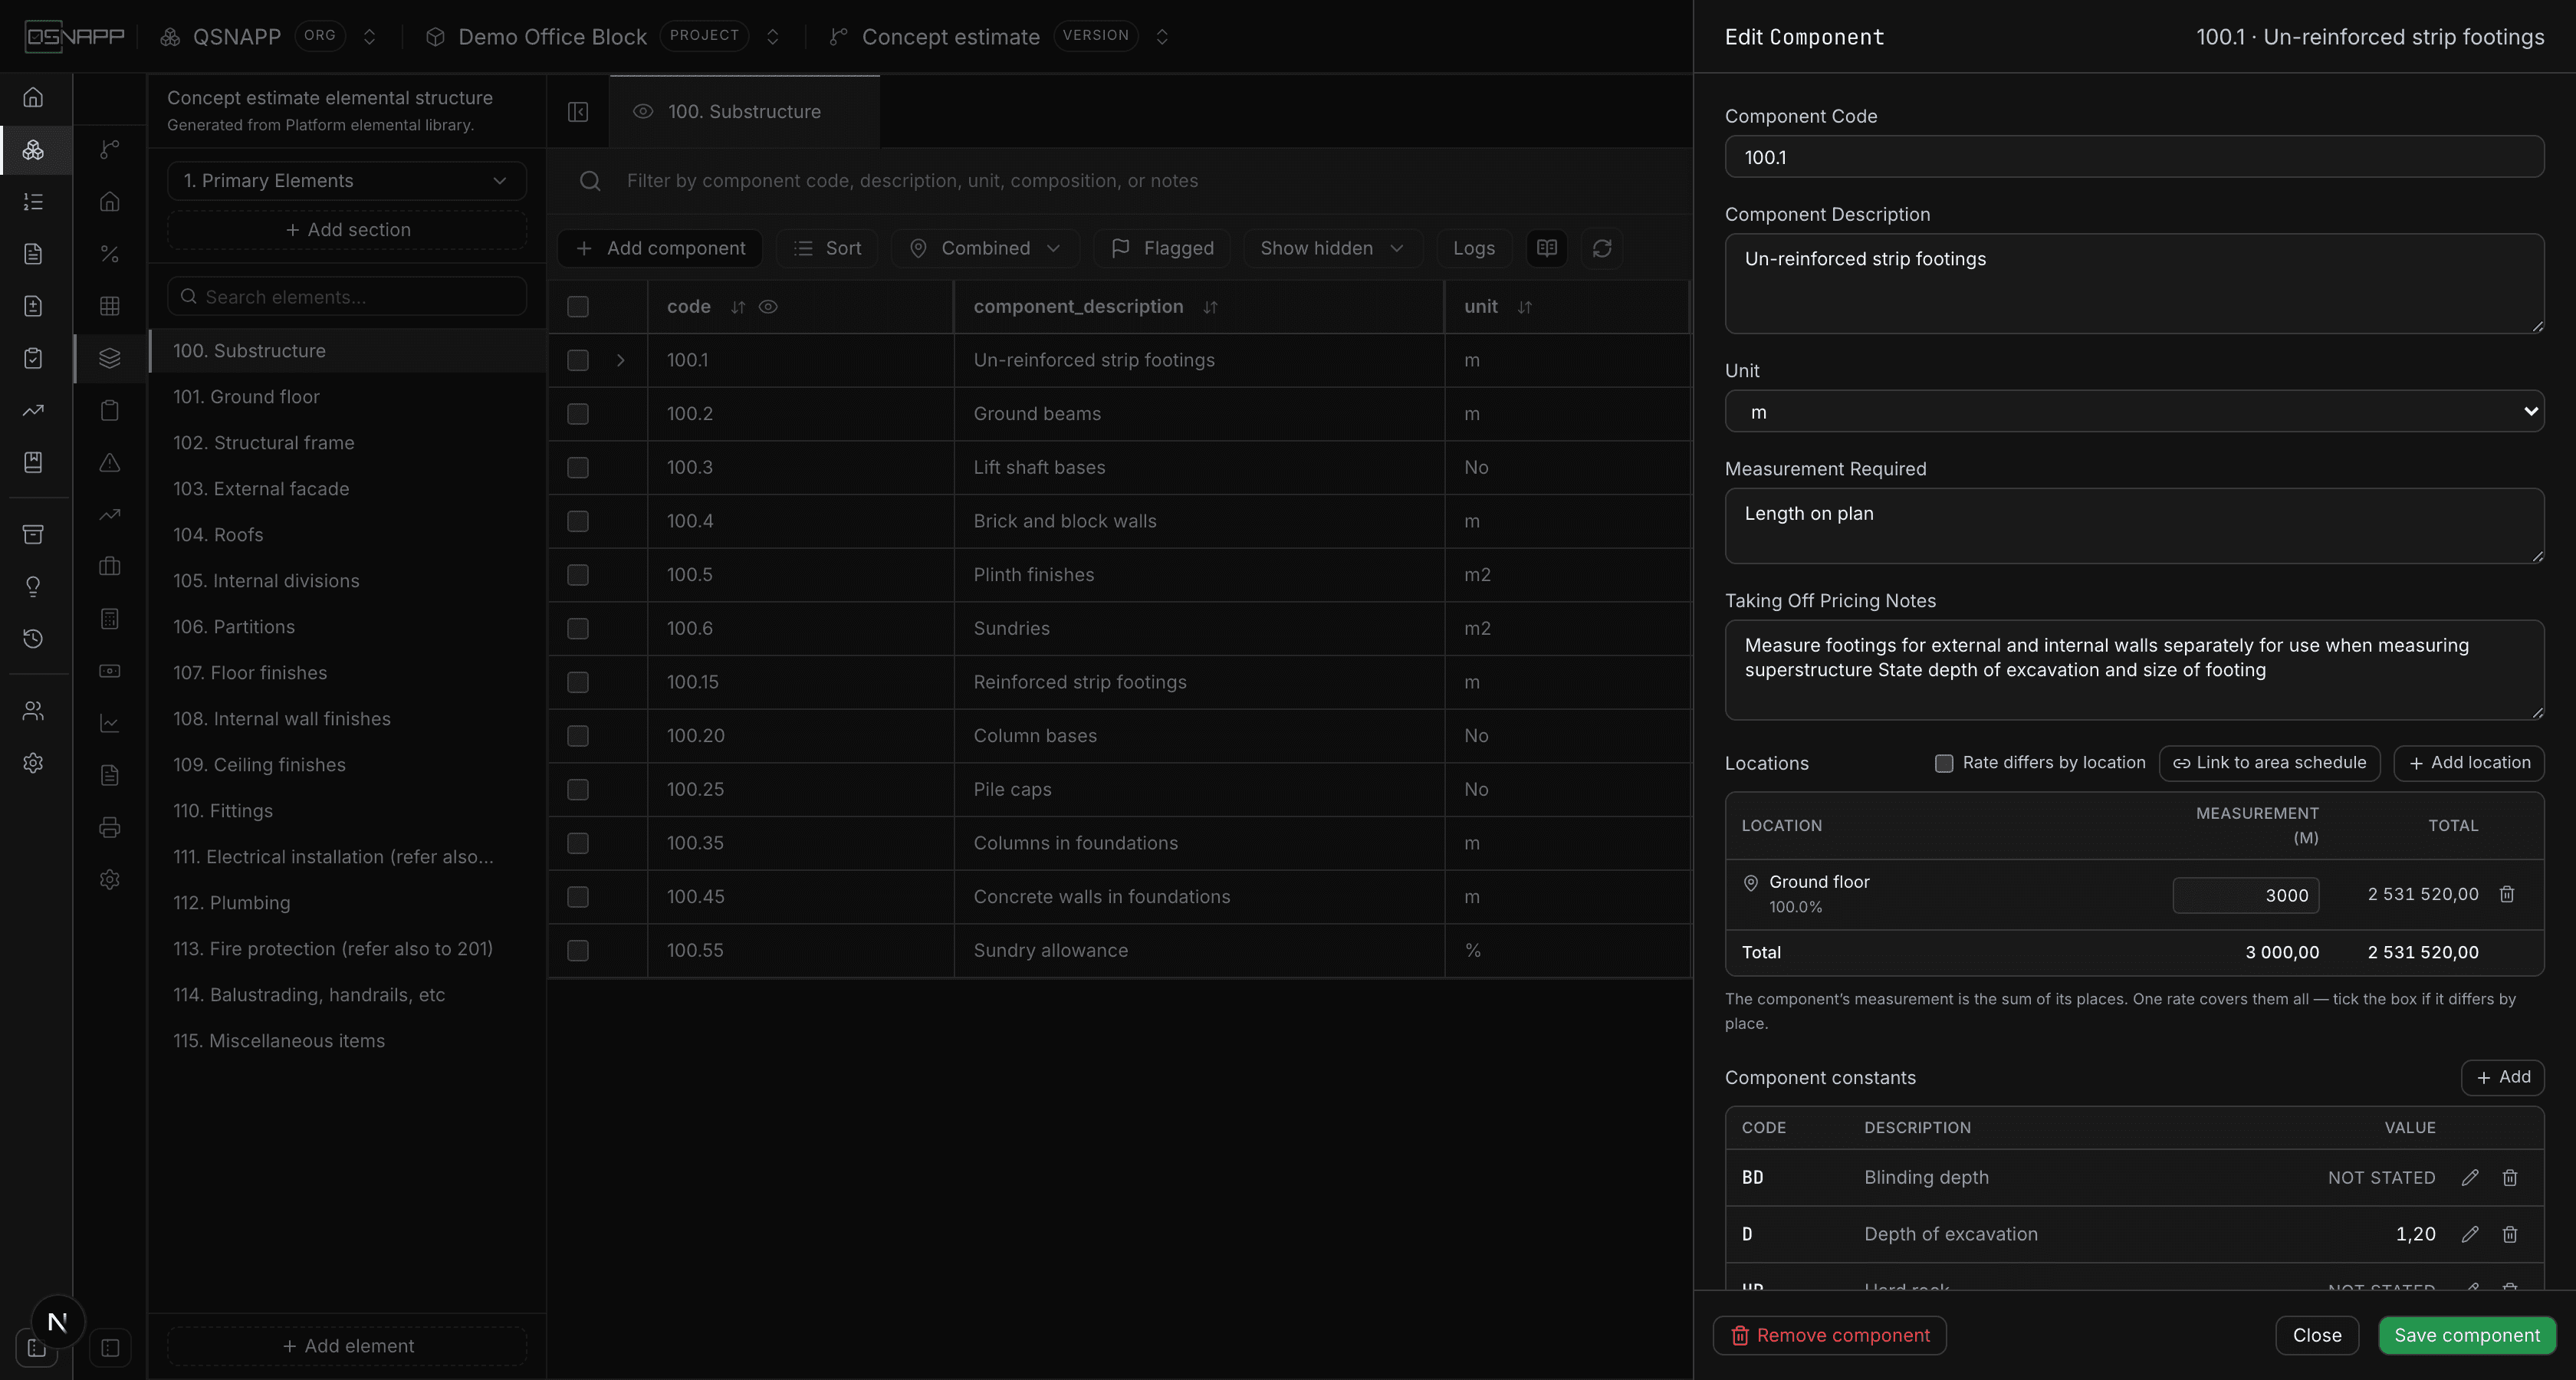
The gutter chevron on any row opens a menu with Edit component, which opens the drawer on the right: code, description, unit, what has to be measured, the taking-off notes, the constants and the composition, all in one place.
Copying a component
Copy component asks what should travel with it, and the choice matters more than it looks:
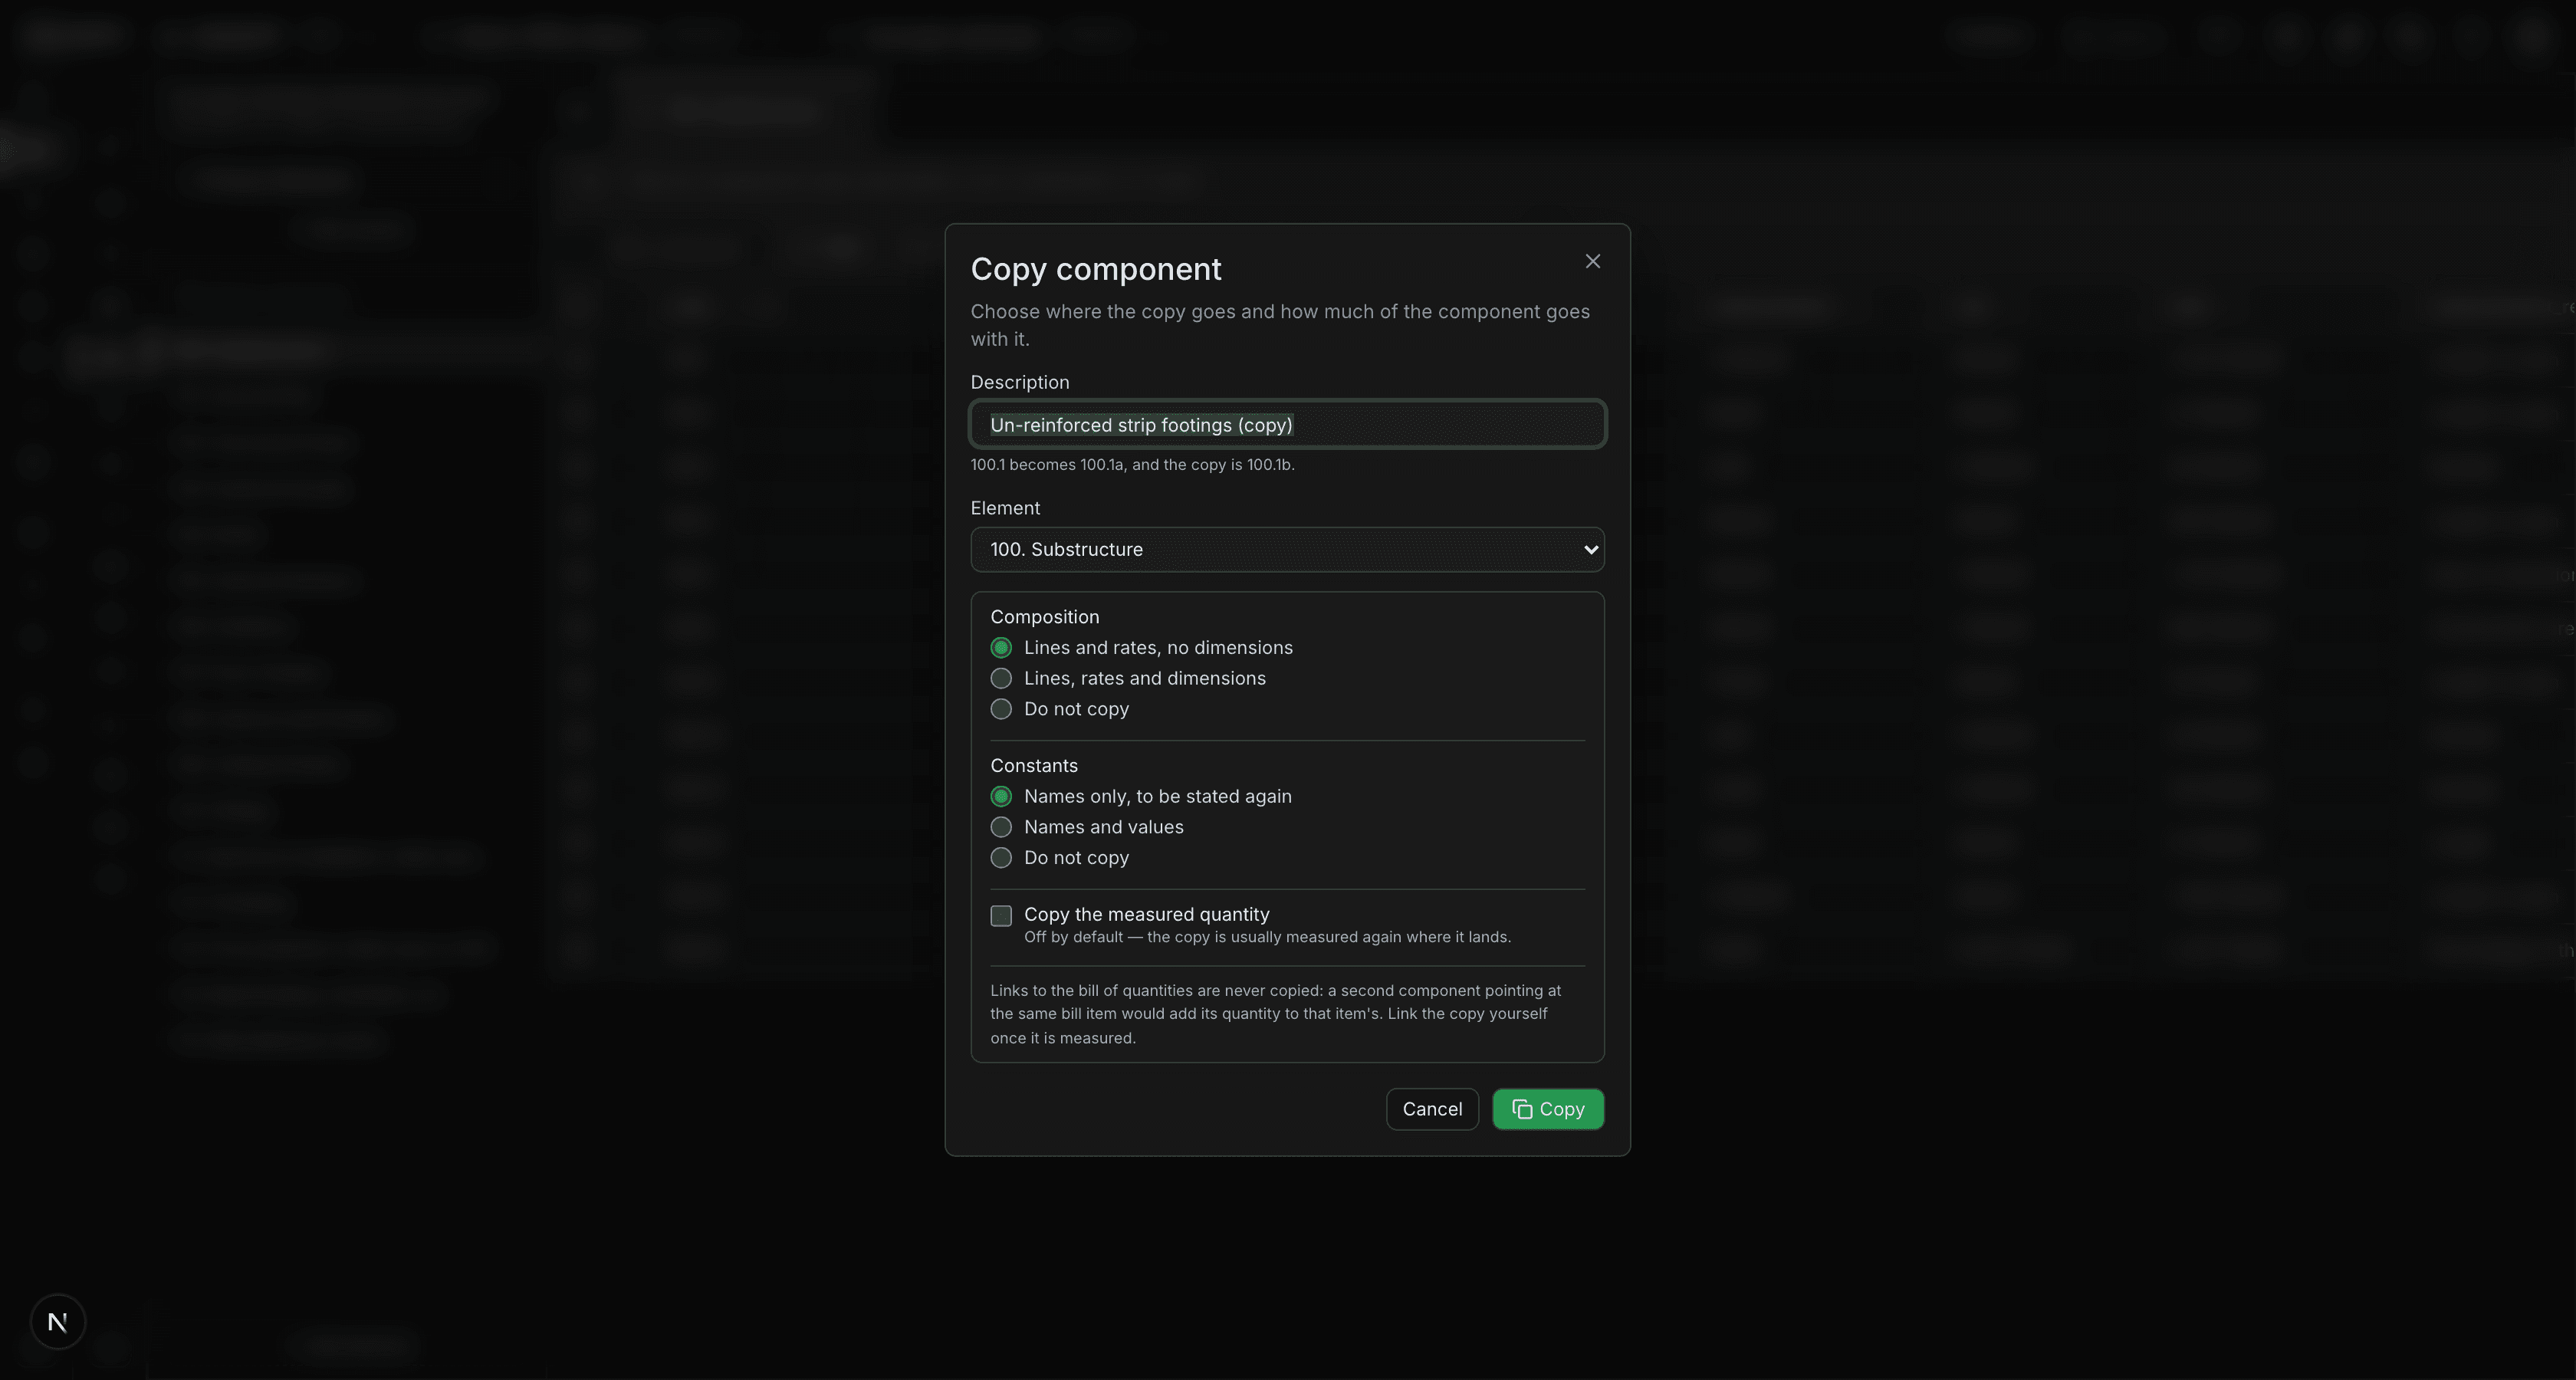
A code names one component in a version, and only one. Copying 100.5 therefore letters the pair: the original becomes 100.5a and the copy 100.5b, in lower case, the way a surveyor splits an item by hand. An original already lettered keeps its letter and the copy takes the next free one, so copying 100.4b gives 100.4c. The dialog shows the outcome before you confirm.
- Composition — the lines and their rates, with or without the dimensions. A rate for concrete per m³ is worth reusing anywhere; the length of a wall belongs to that wall.
- Constants — by name only, so the copy shows what still has to be measured, or with their values where the figures genuinely carry across.
- The measured quantity — off unless asked for, because the copy is usually measured again where it lands.
Links to the bill of quantities are never copied. Two components pointing at the same bill item would both add to its quantity; the copy is linked deliberately once it has been measured.
Removing components
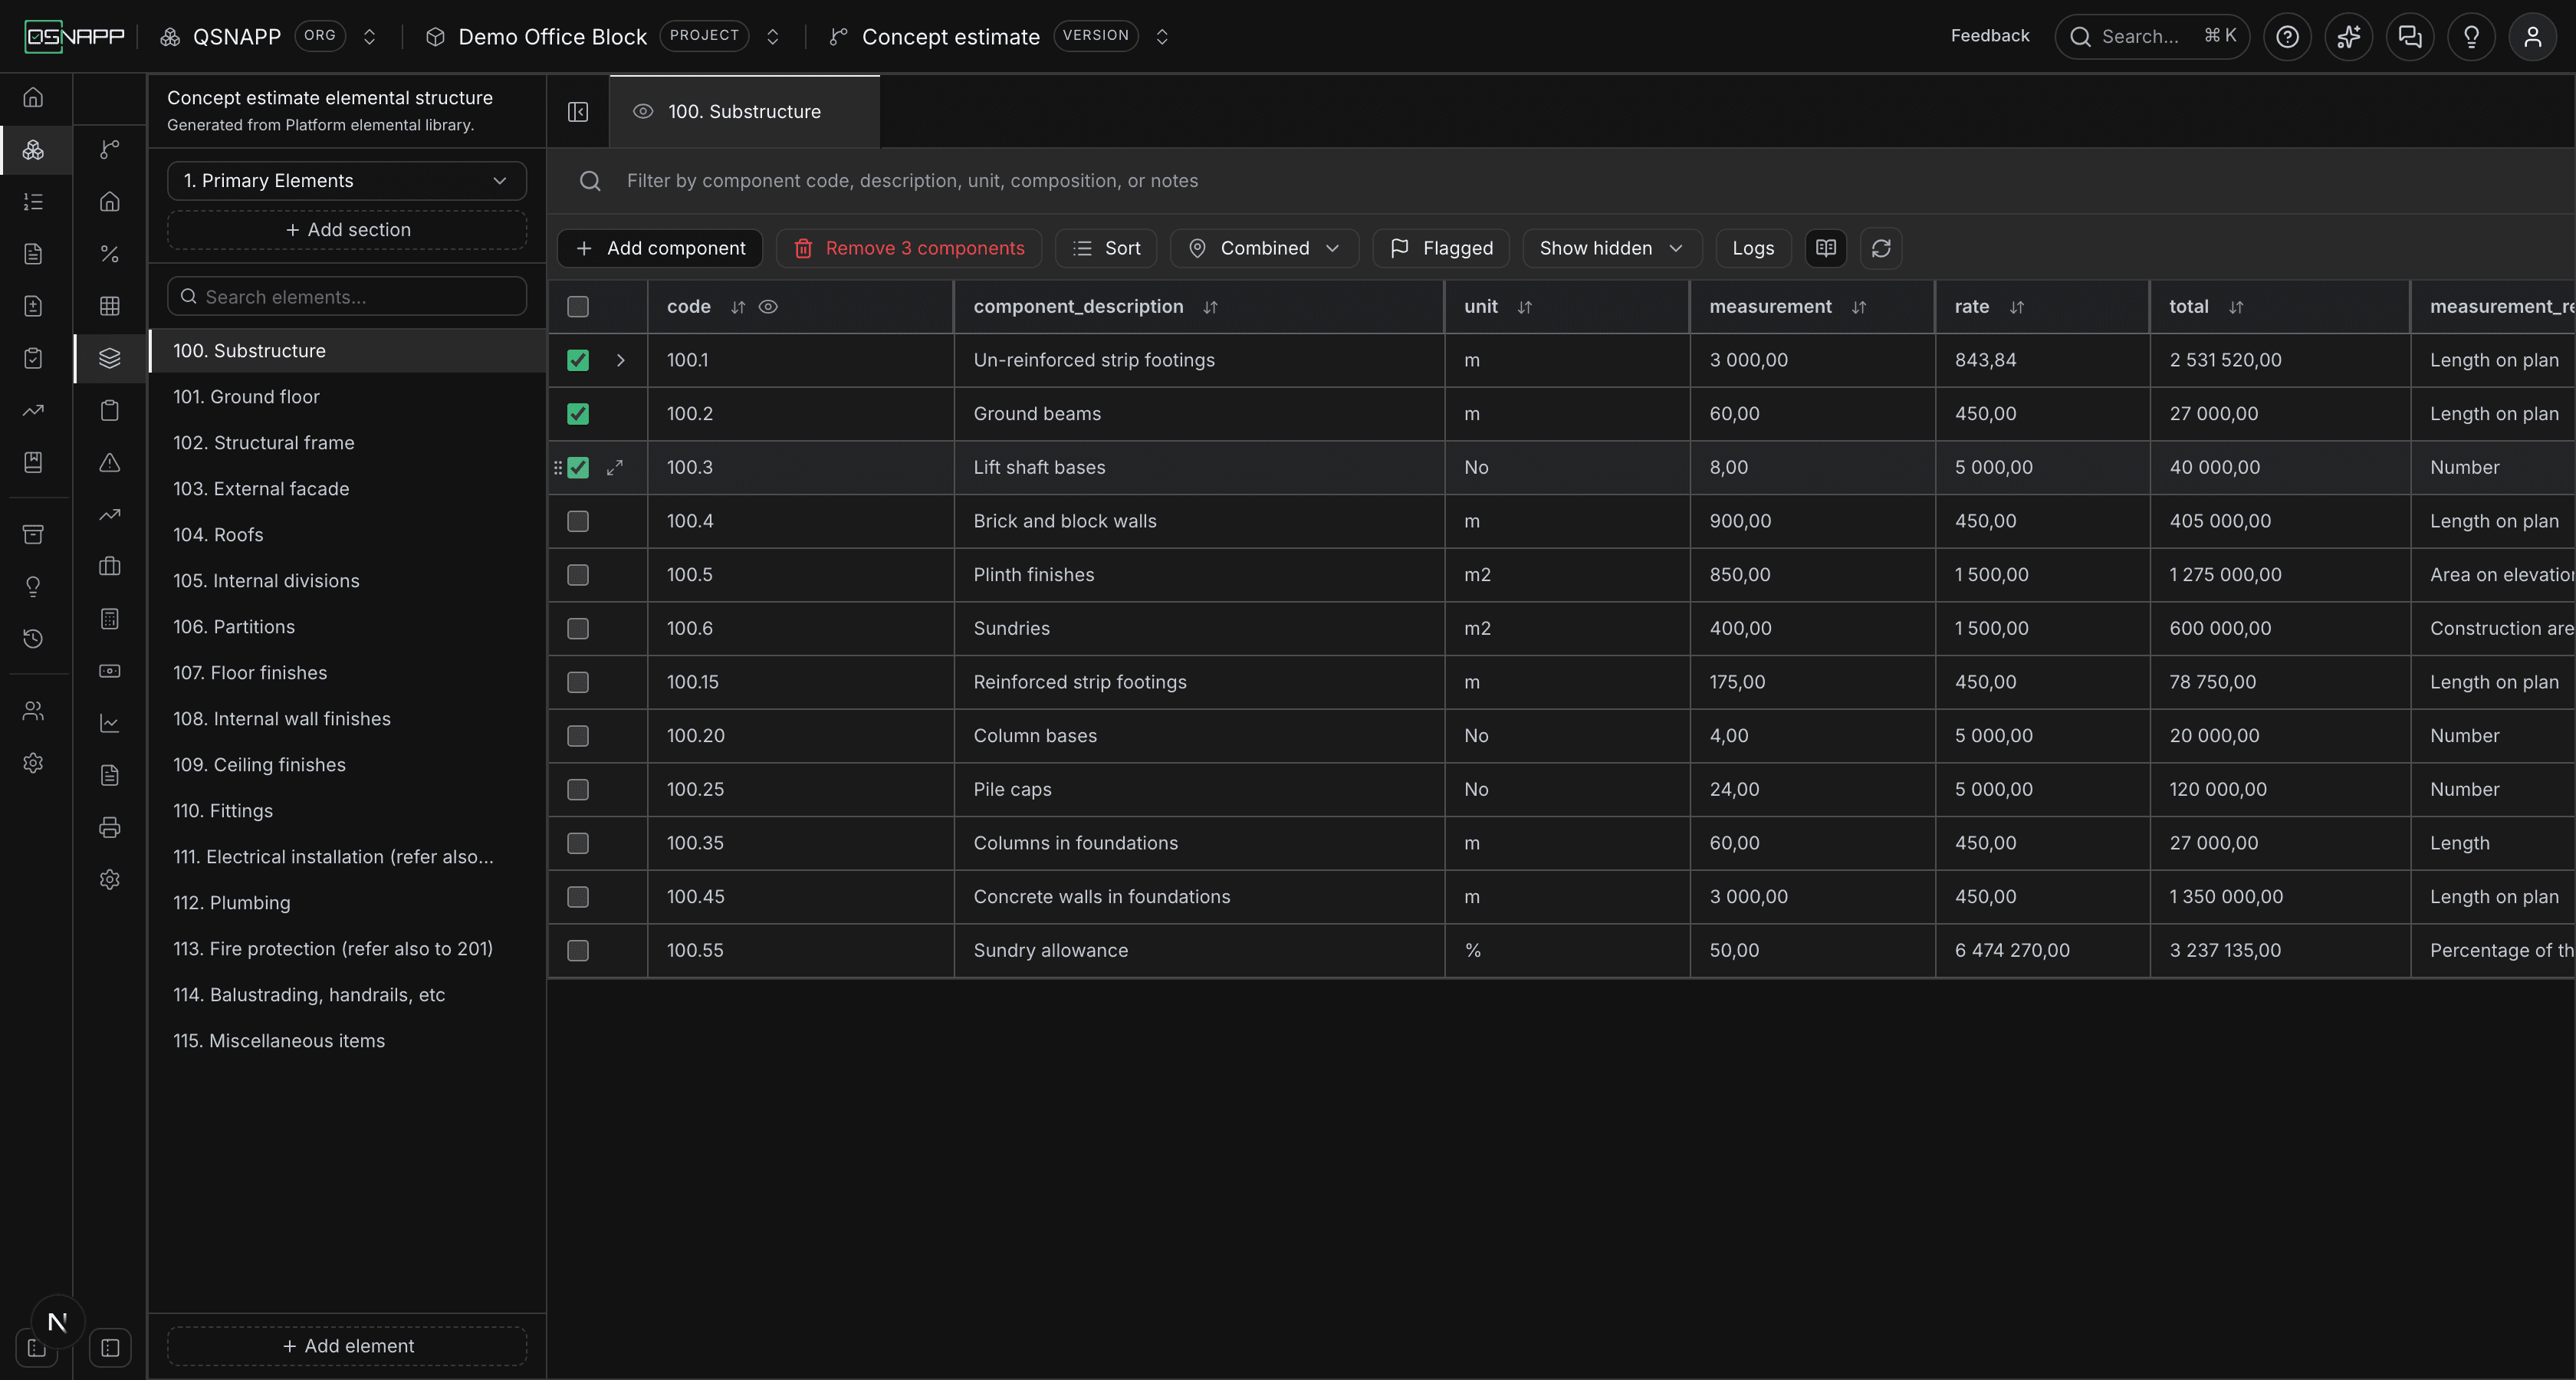
Tick rows in the gutter and Remove appears beside Add component; a single component can also be removed from its drawer. Whole elements and sections are removed from their own drawers — see Editing and removing elements and sections. The confirmation counts what goes with it — its composition lines, its constants, and any links into the bill of quantities — because “delete component” does not look like “stop measuring three bill items” until afterwards.
Links to the bill of quantities
A composition line can be linked to an item in the bill of quantities instead of being measured here. Linked lines are marked Linked and are read-only in this screen: the quantity belongs to the bill, and the estimate follows it. Changing the measurement there changes the rate here.
This is what keeps an estimate and its bill in step — and why removing a component removes its links rather than leaving a bill item taking a quantity from something that no longer exists.