Preliminaries
Preliminaries are carried as a percentage on each section of the elemental breakdown. This tab is where that percentage is set — one figure for the whole estimate, or a different one per section — and where you can see what it comes to.
What this screen is
Site establishment, supervision, insurances, the contractor's time-related costs — the things a contractor prices for being on site at all rather than for any particular element. At concept stage nobody measures them; they are allowed for as a percentage of the measured work, and that is what this tab does.
The base it works from is the elemental breakdown: one row per section, each carrying the total of every component priced under it. Nothing is measured here and nothing is typed here except the percentages. If a section's total looks wrong, the place to fix it is the breakdown.
There is no Preliminaries section in the elemental structure itself. There used to be one, and it was removed because a percentage held here and a section priced there were two places to put the same figure, with nothing to say which was right. This tab is the one place.
Reading the table
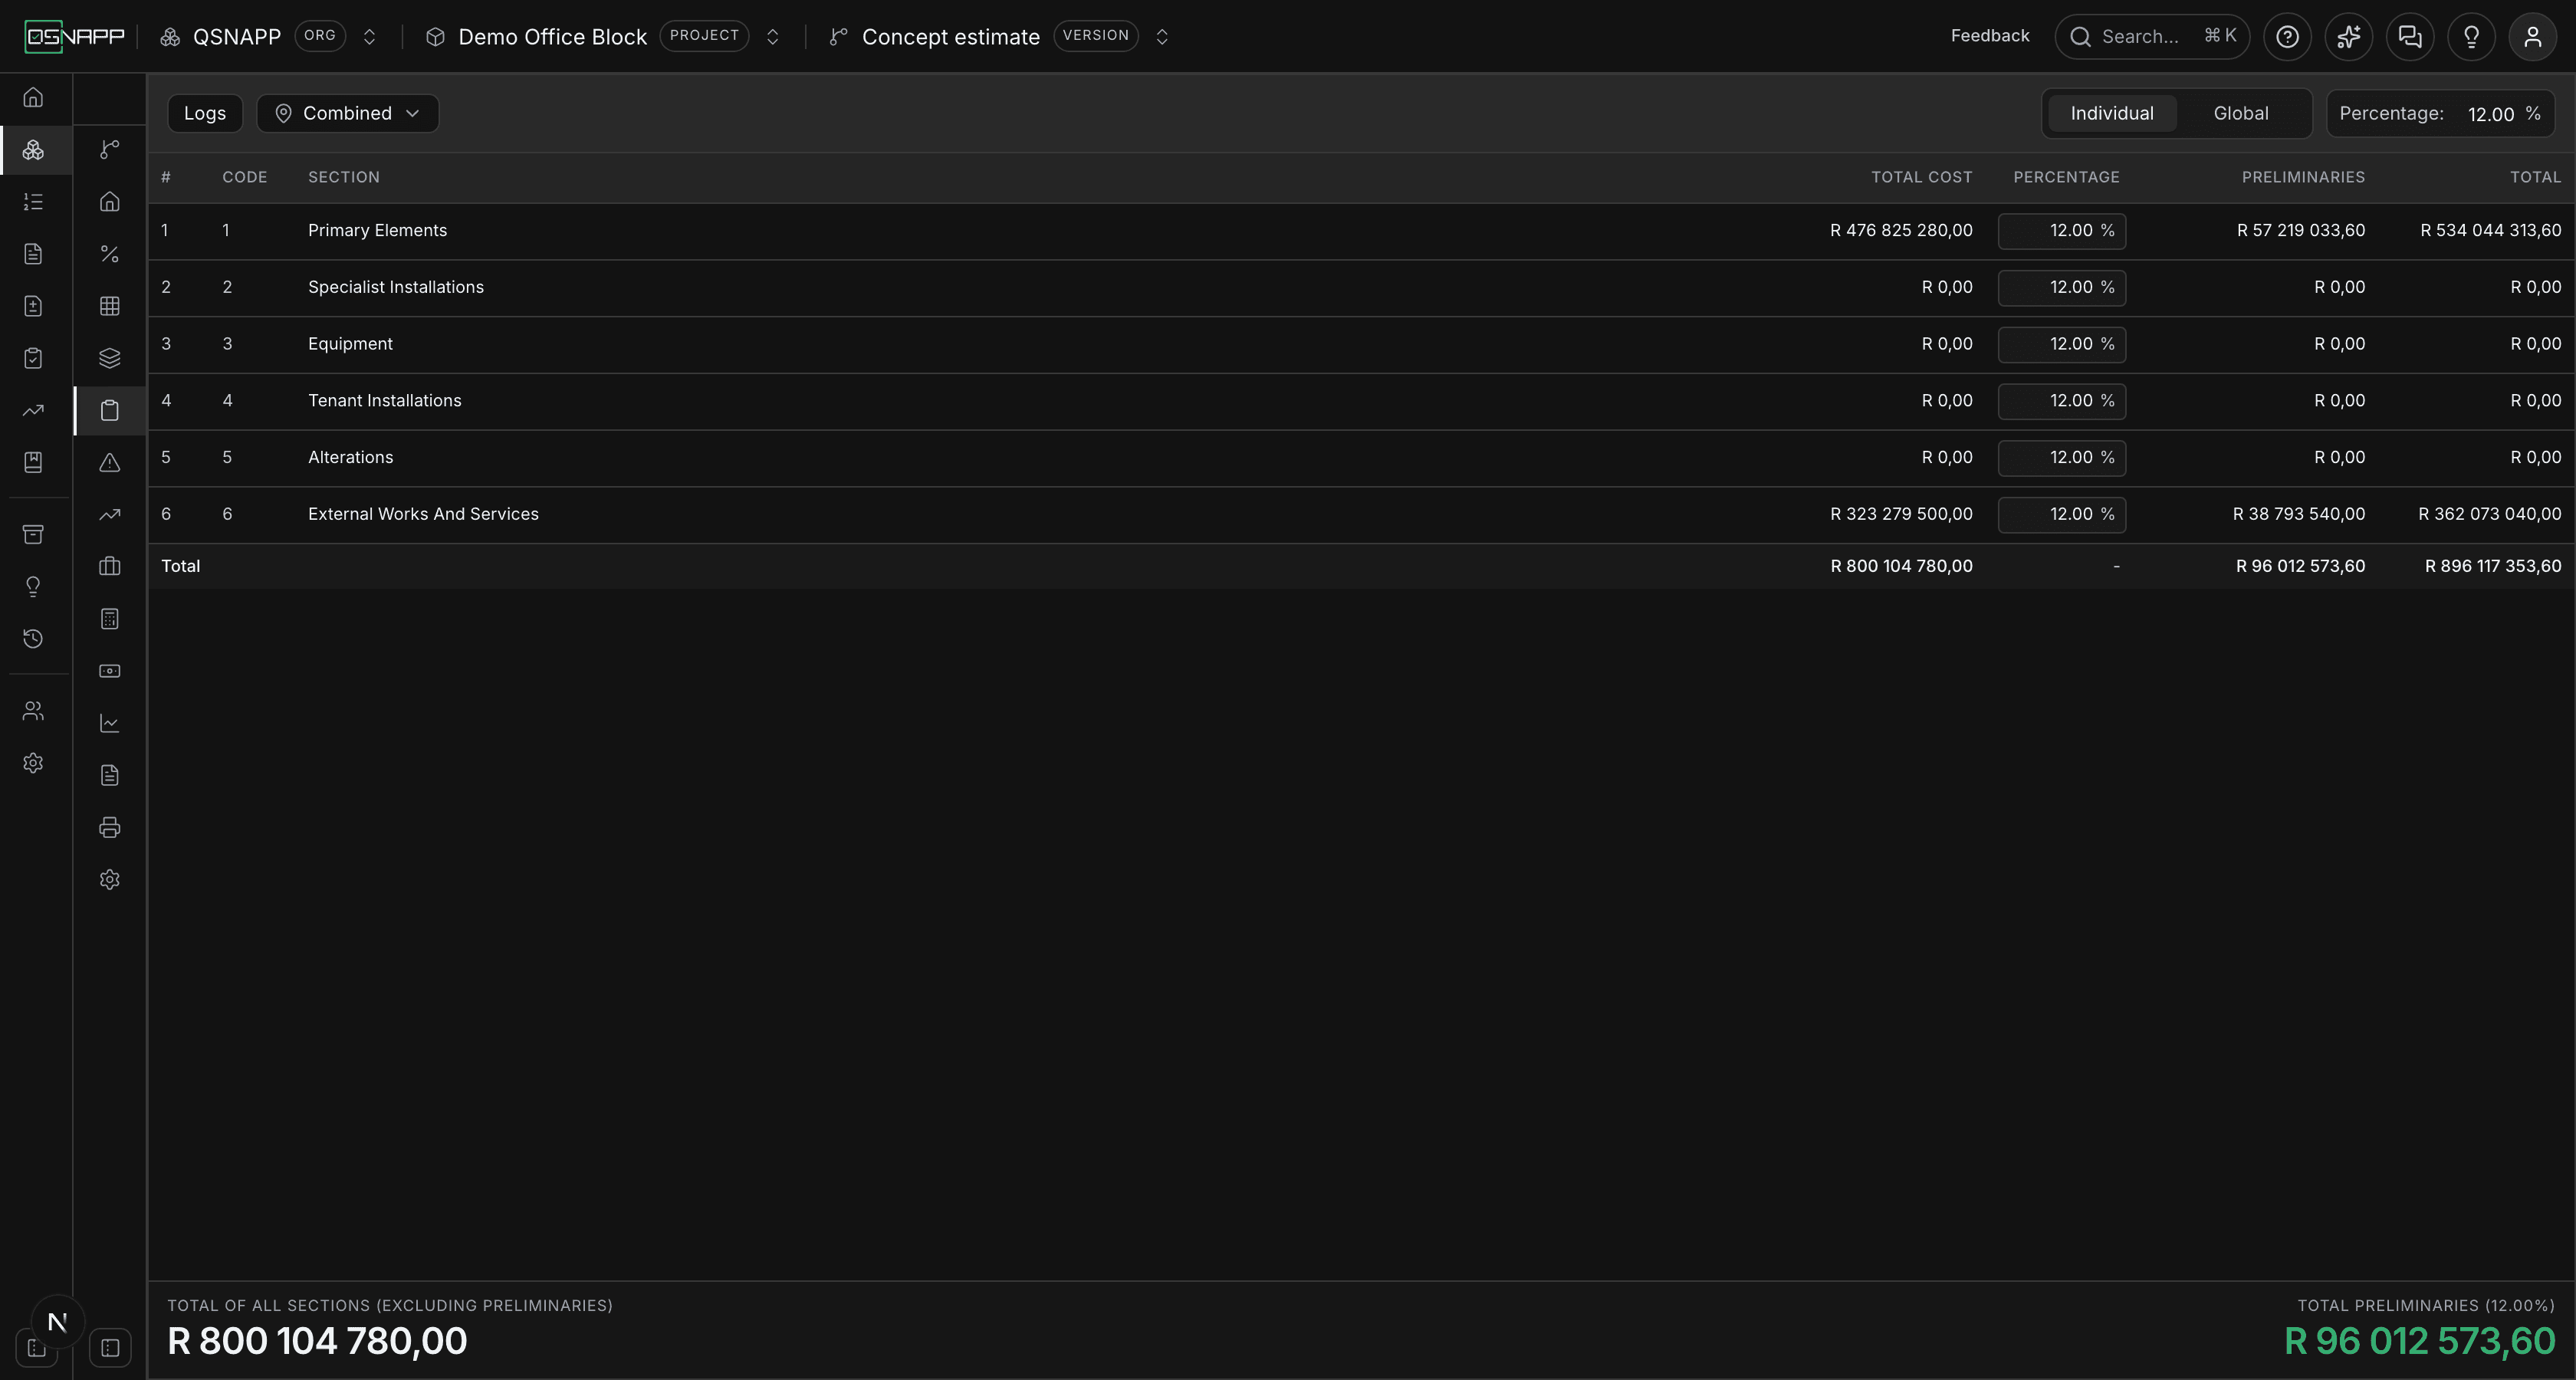
The columns
| Column | What it holds |
|---|---|
| # | The row's position in the list. |
| Code | The section's number in the elemental structure. |
| Section | Its name — Primary Elements, External Works And Services, and so on. |
| Total Cost | The sum of every component total under that section, as the breakdown holds them. Not editable here. |
| Percentage | The preliminaries rate for that section. A box you can type in when the mode is Individual; a figure you cannot when it is Global. |
| Preliminaries | Total Cost × Percentage. Worked out, not stored. |
| Total | Total Cost + Preliminaries: what the section comes to with its preliminaries on. |
Only sections that hold at least one component are listed. A section with components but no figures still appears, at R0,00 — it is part of the estimate, not yet priced. A version with no elemental breakdown at all shows a single line saying so, and a project with no versions asks you to select one.
Money reads in the South African convention throughout — R1 234 567,89. The percentage boxes use a dot: 12.00.
How the amount is worked out
Per section, and only per section:
preliminaries  =  section total × percentage ÷ 100
total          =  section total + preliminaries
So a section priced at R10 000 000 carrying 12% shows R1 200 000 of preliminaries and a total of R11 200 000. The footer adds the rows up; nothing is calculated on the estimate as a whole and then apportioned, which is why a section priced at nothing carries nothing however high its percentage is set.
The two figures at the foot
Below the table are two large figures. Total of all sections (excluding preliminaries) is the works cost the percentages are applied to. Total preliminaries is what they come to, with a percentage in brackets.
That bracketed figure is the effective rate: total preliminaries divided by total cost, weighted by what each section is worth. In Global mode it is simply the global figure. In Individual mode it is the blend — R10 000 000 at 12% and R2 000 000 at 5% come to R1 300 000 on R12 000 000, so it reads 10.83% rather than the average of the two rates. It is the number that matches the rand total, which is what makes it worth reading.
The totals row inside the table shows the same sums column by column. Its Percentage cell shows the global figure in Global mode and - in Individual mode, because there is no single rate to show there.
Setting the percentages
The switch at the right of the toolbar chooses between two ways of stating the rate, and the box beside it holds the global figure.
Individual
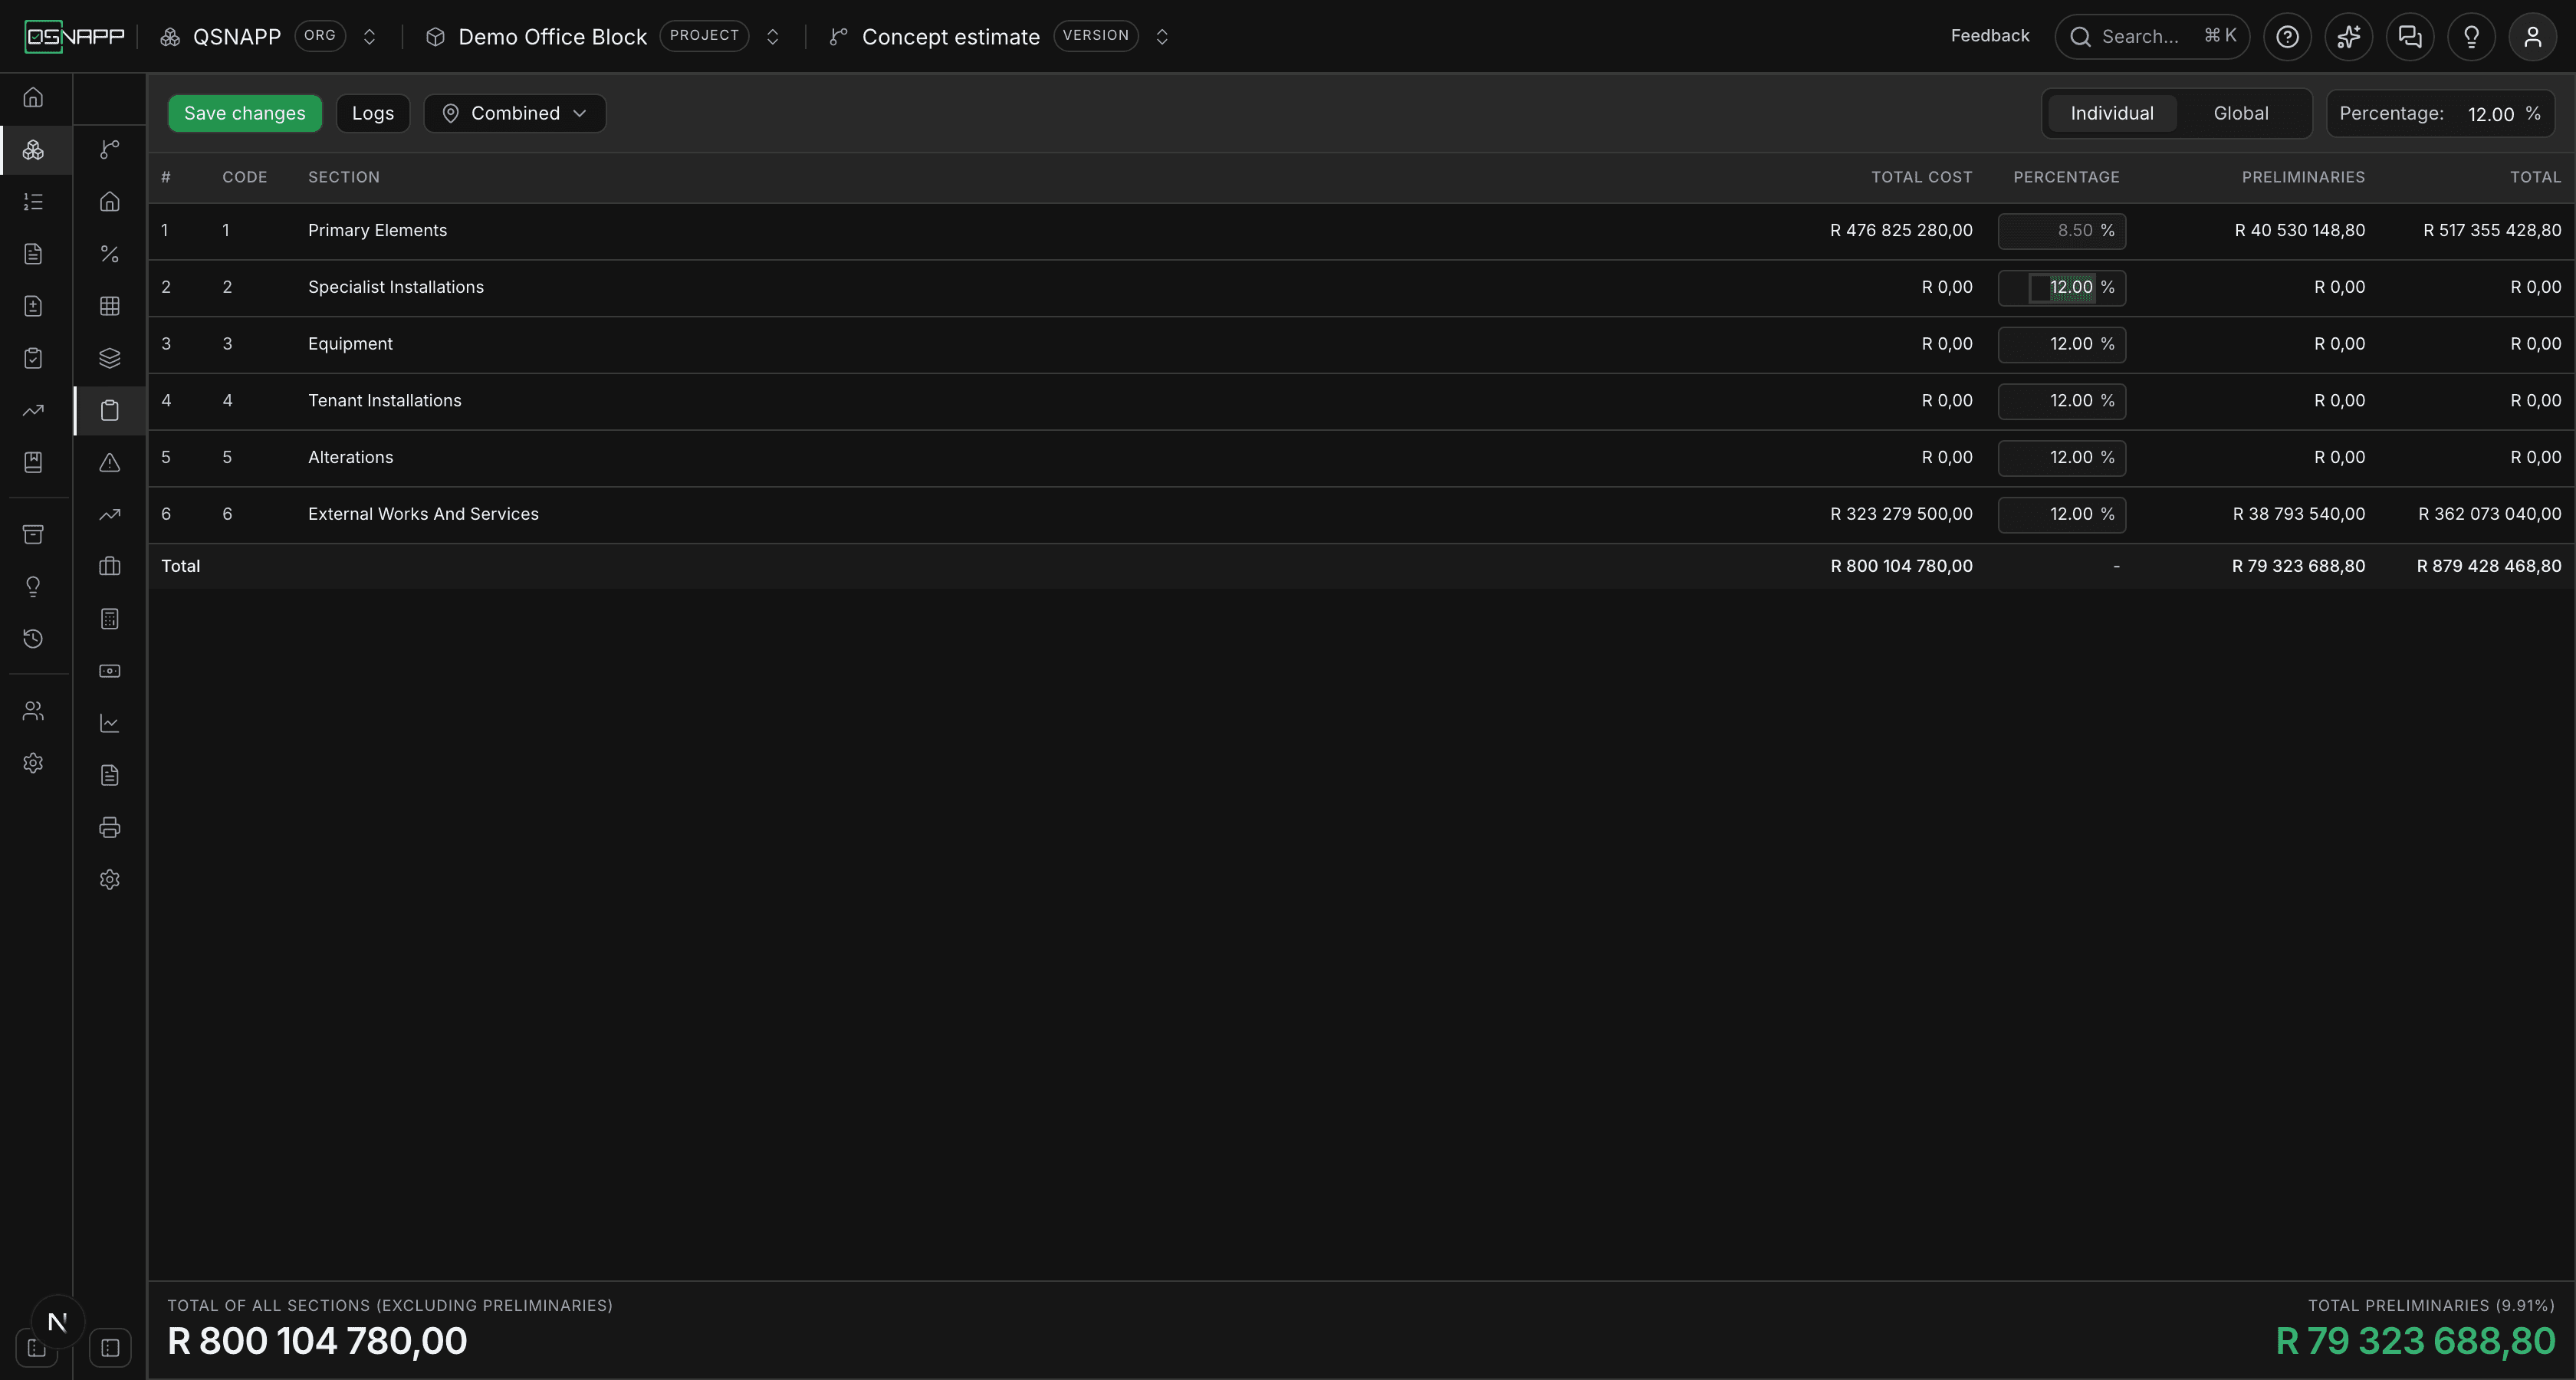
Each section has its own box in the Percentage column. Type a rate, move on to the next. This is the mode the screen starts in, and the one most estimates end up in — external works rarely carry the same preliminaries as the building.
Global
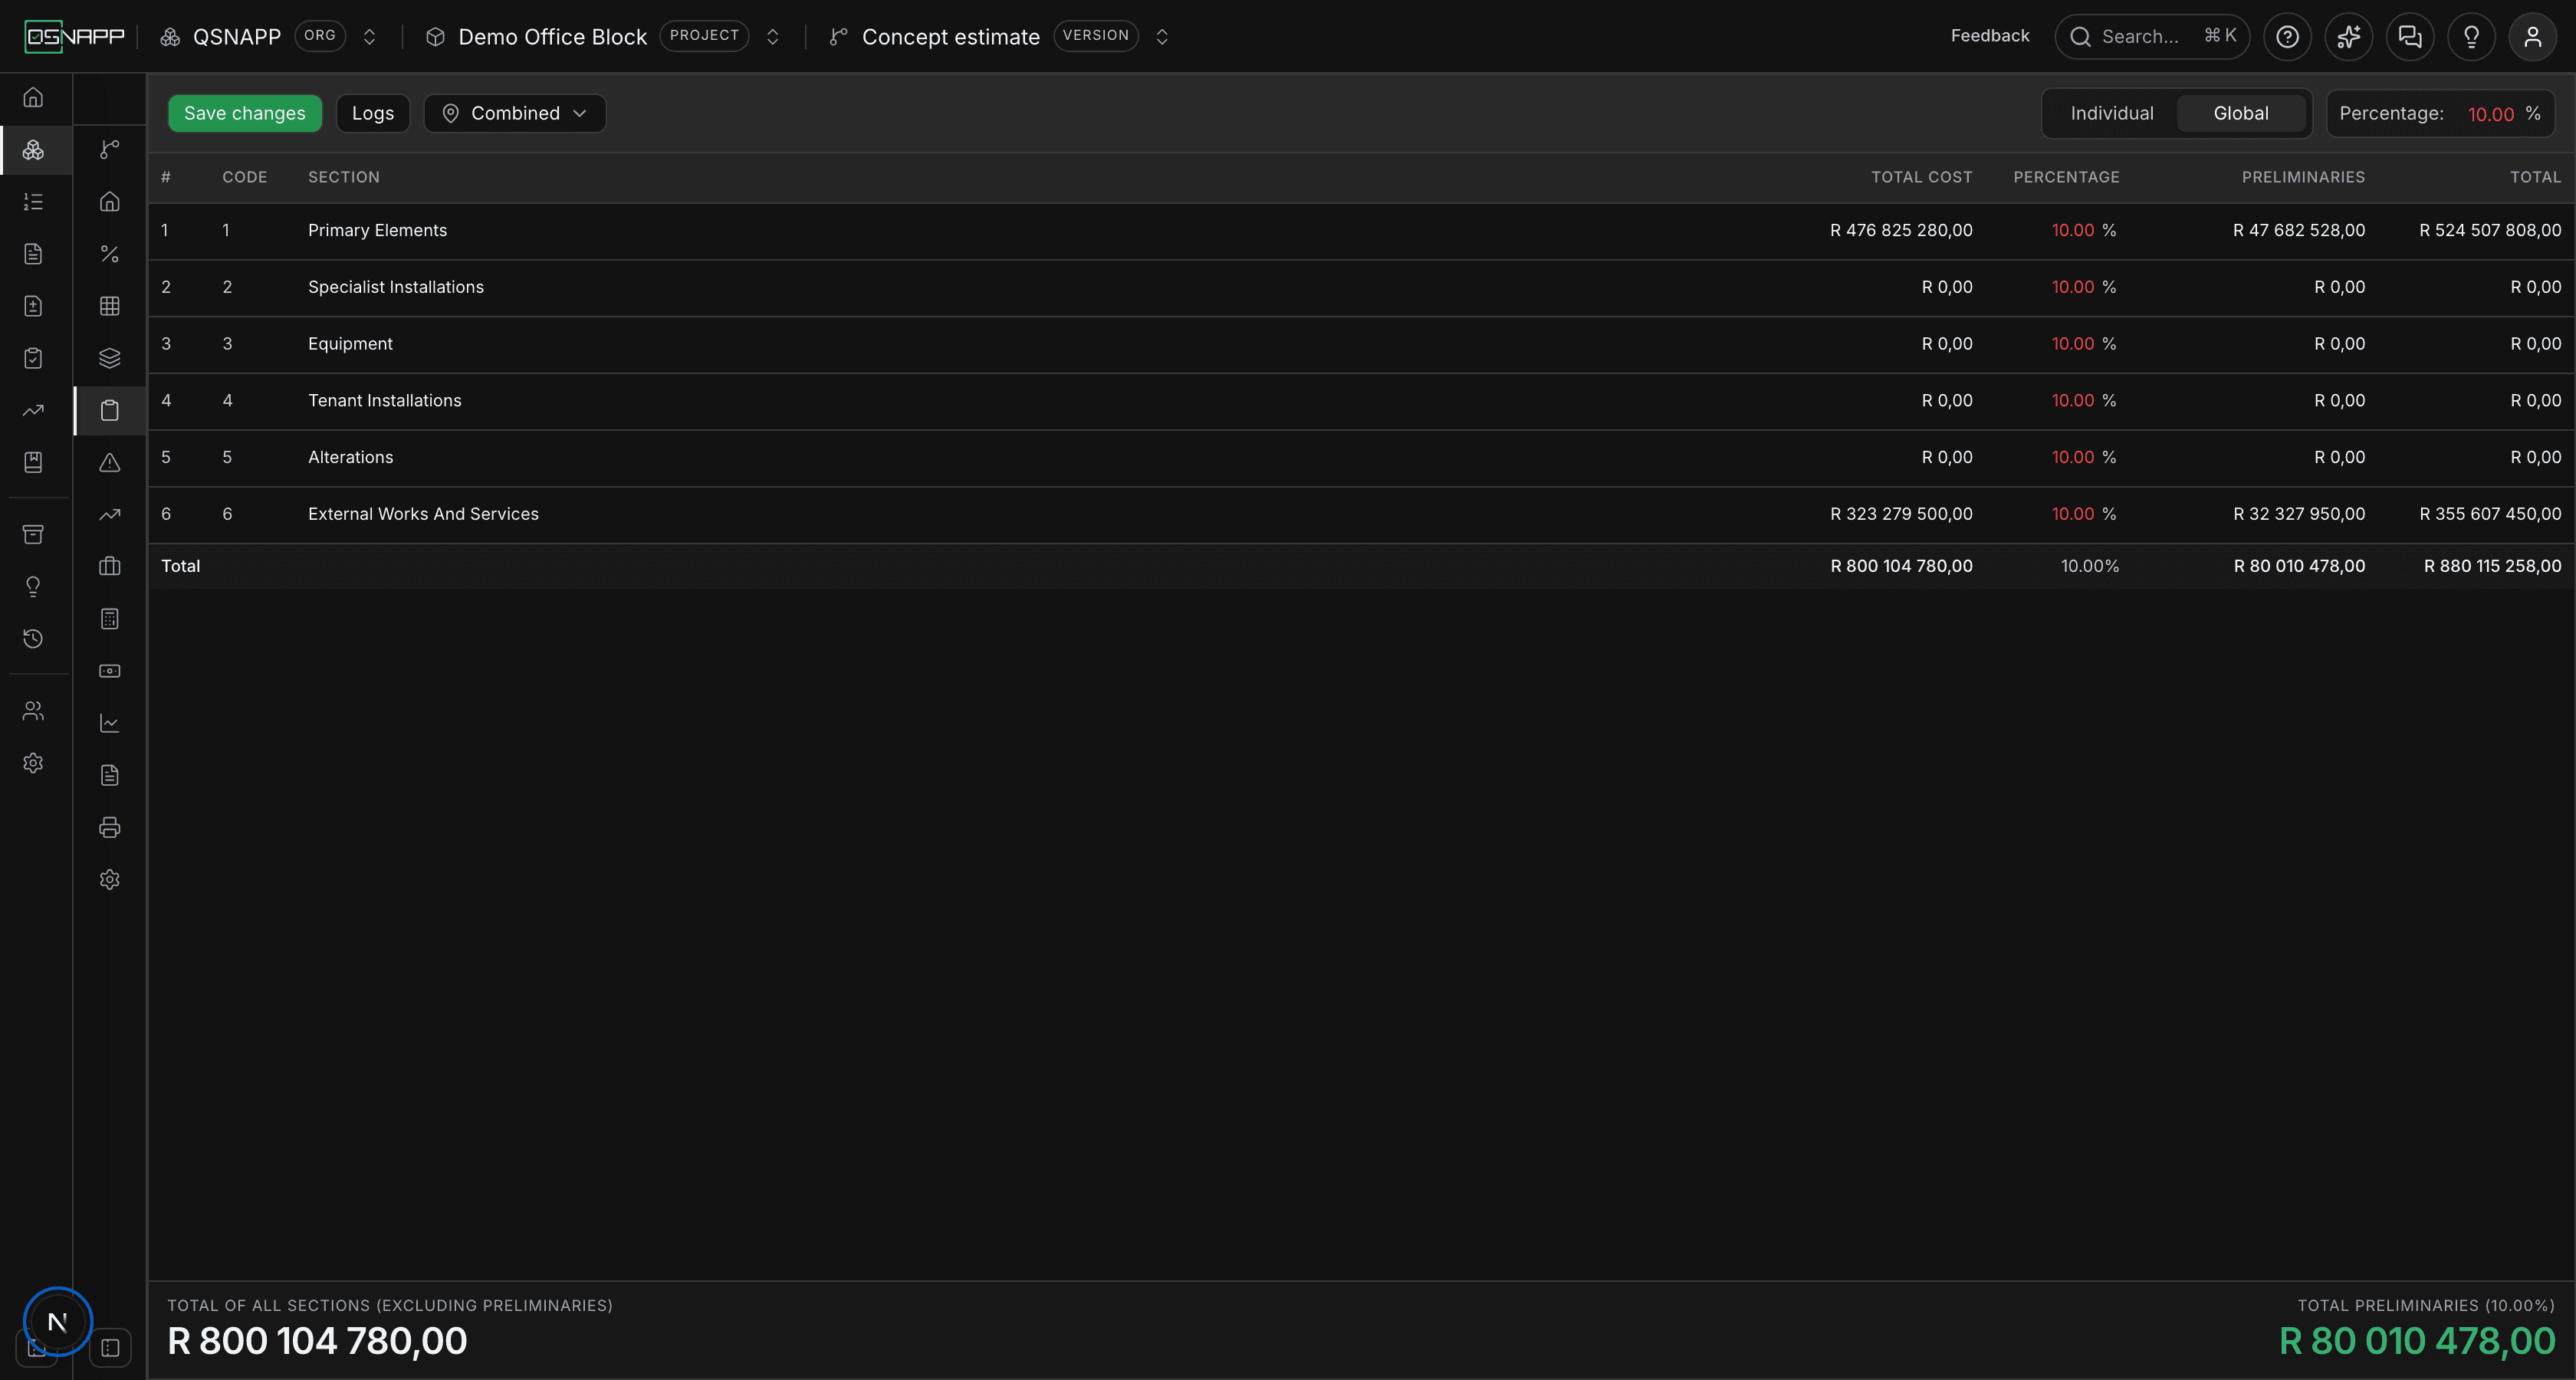
One figure, in the Percentage box in the toolbar, applied to every section. Choosing Global writes that figure into every row at once and turns the row boxes into plain text; the rows follow the toolbar box as you type in it.
Two things about the switch are worth knowing before you press it. First, switching to Global overwrites the per-section figures on screen — switching back to Individual leaves every row at the global figure rather than restoring what was there. If you have not saved, reloading the page brings the saved rates back. Second, saving in Global mode saves that figure against every section as well as against the estimate, so a later switch to Individual starts from the global rate throughout.
The toolbar box is editable in Individual mode too. Changing it there changes nothing in the rows; it is the figure that will be used the next time Global is chosen, and it is saved with the mode.
What the box accepts
A number, with a dot or a comma — 8.5 and 8,5 both read as eight and a half. When you leave the box it is tidied to two decimals, so 8,5 becomes 8.50.
Anything below zero is taken as zero and anything above 1 000 as 1 000, and the database refuses figures outside that range in case something gets past the box. Text that is not a number, or an empty box, is read as zero — so a box you have cleared to retype is a section at 0% until you have typed the new figure.
Saving
Nothing is saved as you type. A changed figure turns red and its box is tinted, the mode switch counts as a change too, and Save changes appears at the left of the toolbar the moment anything differs from what is stored. Until you press it, moving to another tab loses the edits.
Saving writes only what changed — the mode and global figure if either moved, and each section whose rate differs from its saved one. Every change is written to the log (below) and confirmed with a message naming the section and the new rate, with a Rollback change action on it for the moment you realise it was the wrong row. The rollback is refused if the figure has been changed again since, rather than quietly undoing something else.
Twelve percent until you say otherwise
A version you have not touched shows 12.00% against every section, in Individual mode, and nothing is stored for it yet. The row for a section is only written when you save a rate for it; the settings row for the version is only written when you save the mode or the global figure. Until then the screen — and every other place that reads preliminaries — falls back to 12% for whatever is missing.
This matters in one direction: the figure you see is a default, not a decision. An estimate whose preliminaries have never been looked at carries 12% throughout, and the log for it is empty, which is how to tell.
Percentages belong to a version. A new version starts at 12% everywhere; the rates set on another version are not carried across. Rates are stored to two decimals.
Reading it by place
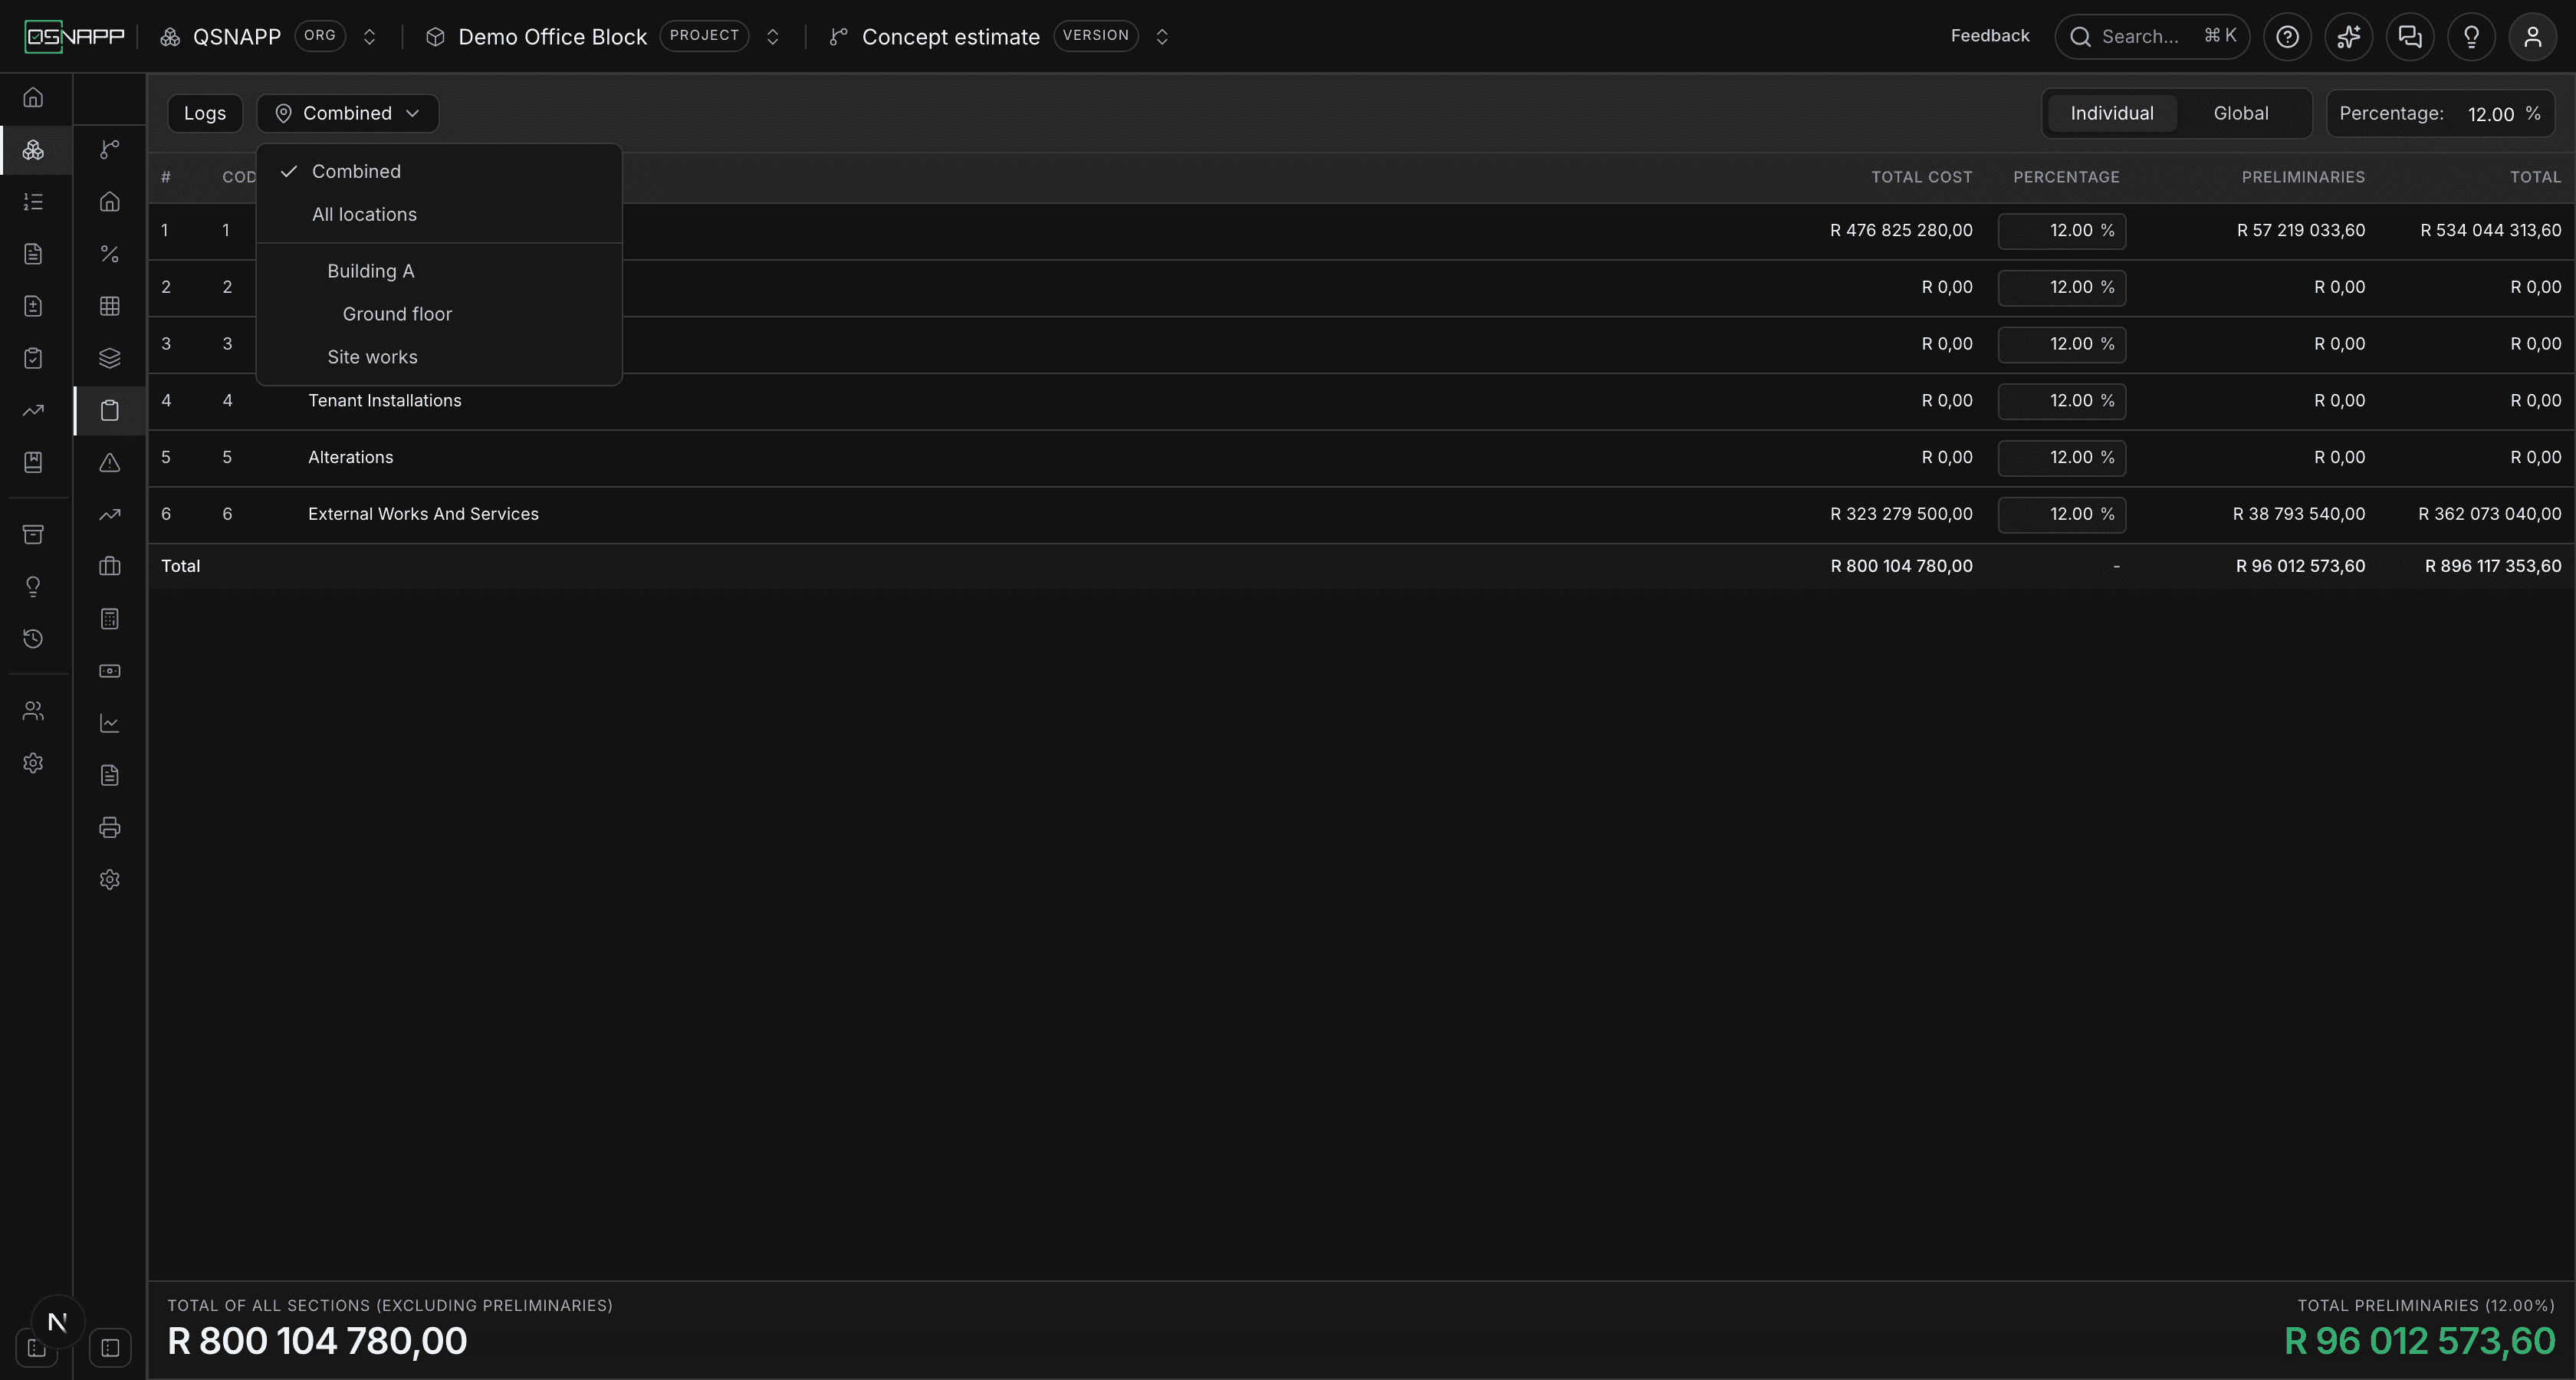
When components in the breakdown have been measured by place — 1 400 m of footing under Building A, 900 under Site works — a places control appears in the toolbar. It is the same control the elemental breakdown carries, with the same three states: Combined (the default), All locations, or a comparison of the places you tick. It is only offered when something is actually allocated to a place; a menu of places nothing is measured in would answer every pick with a column of zeros.
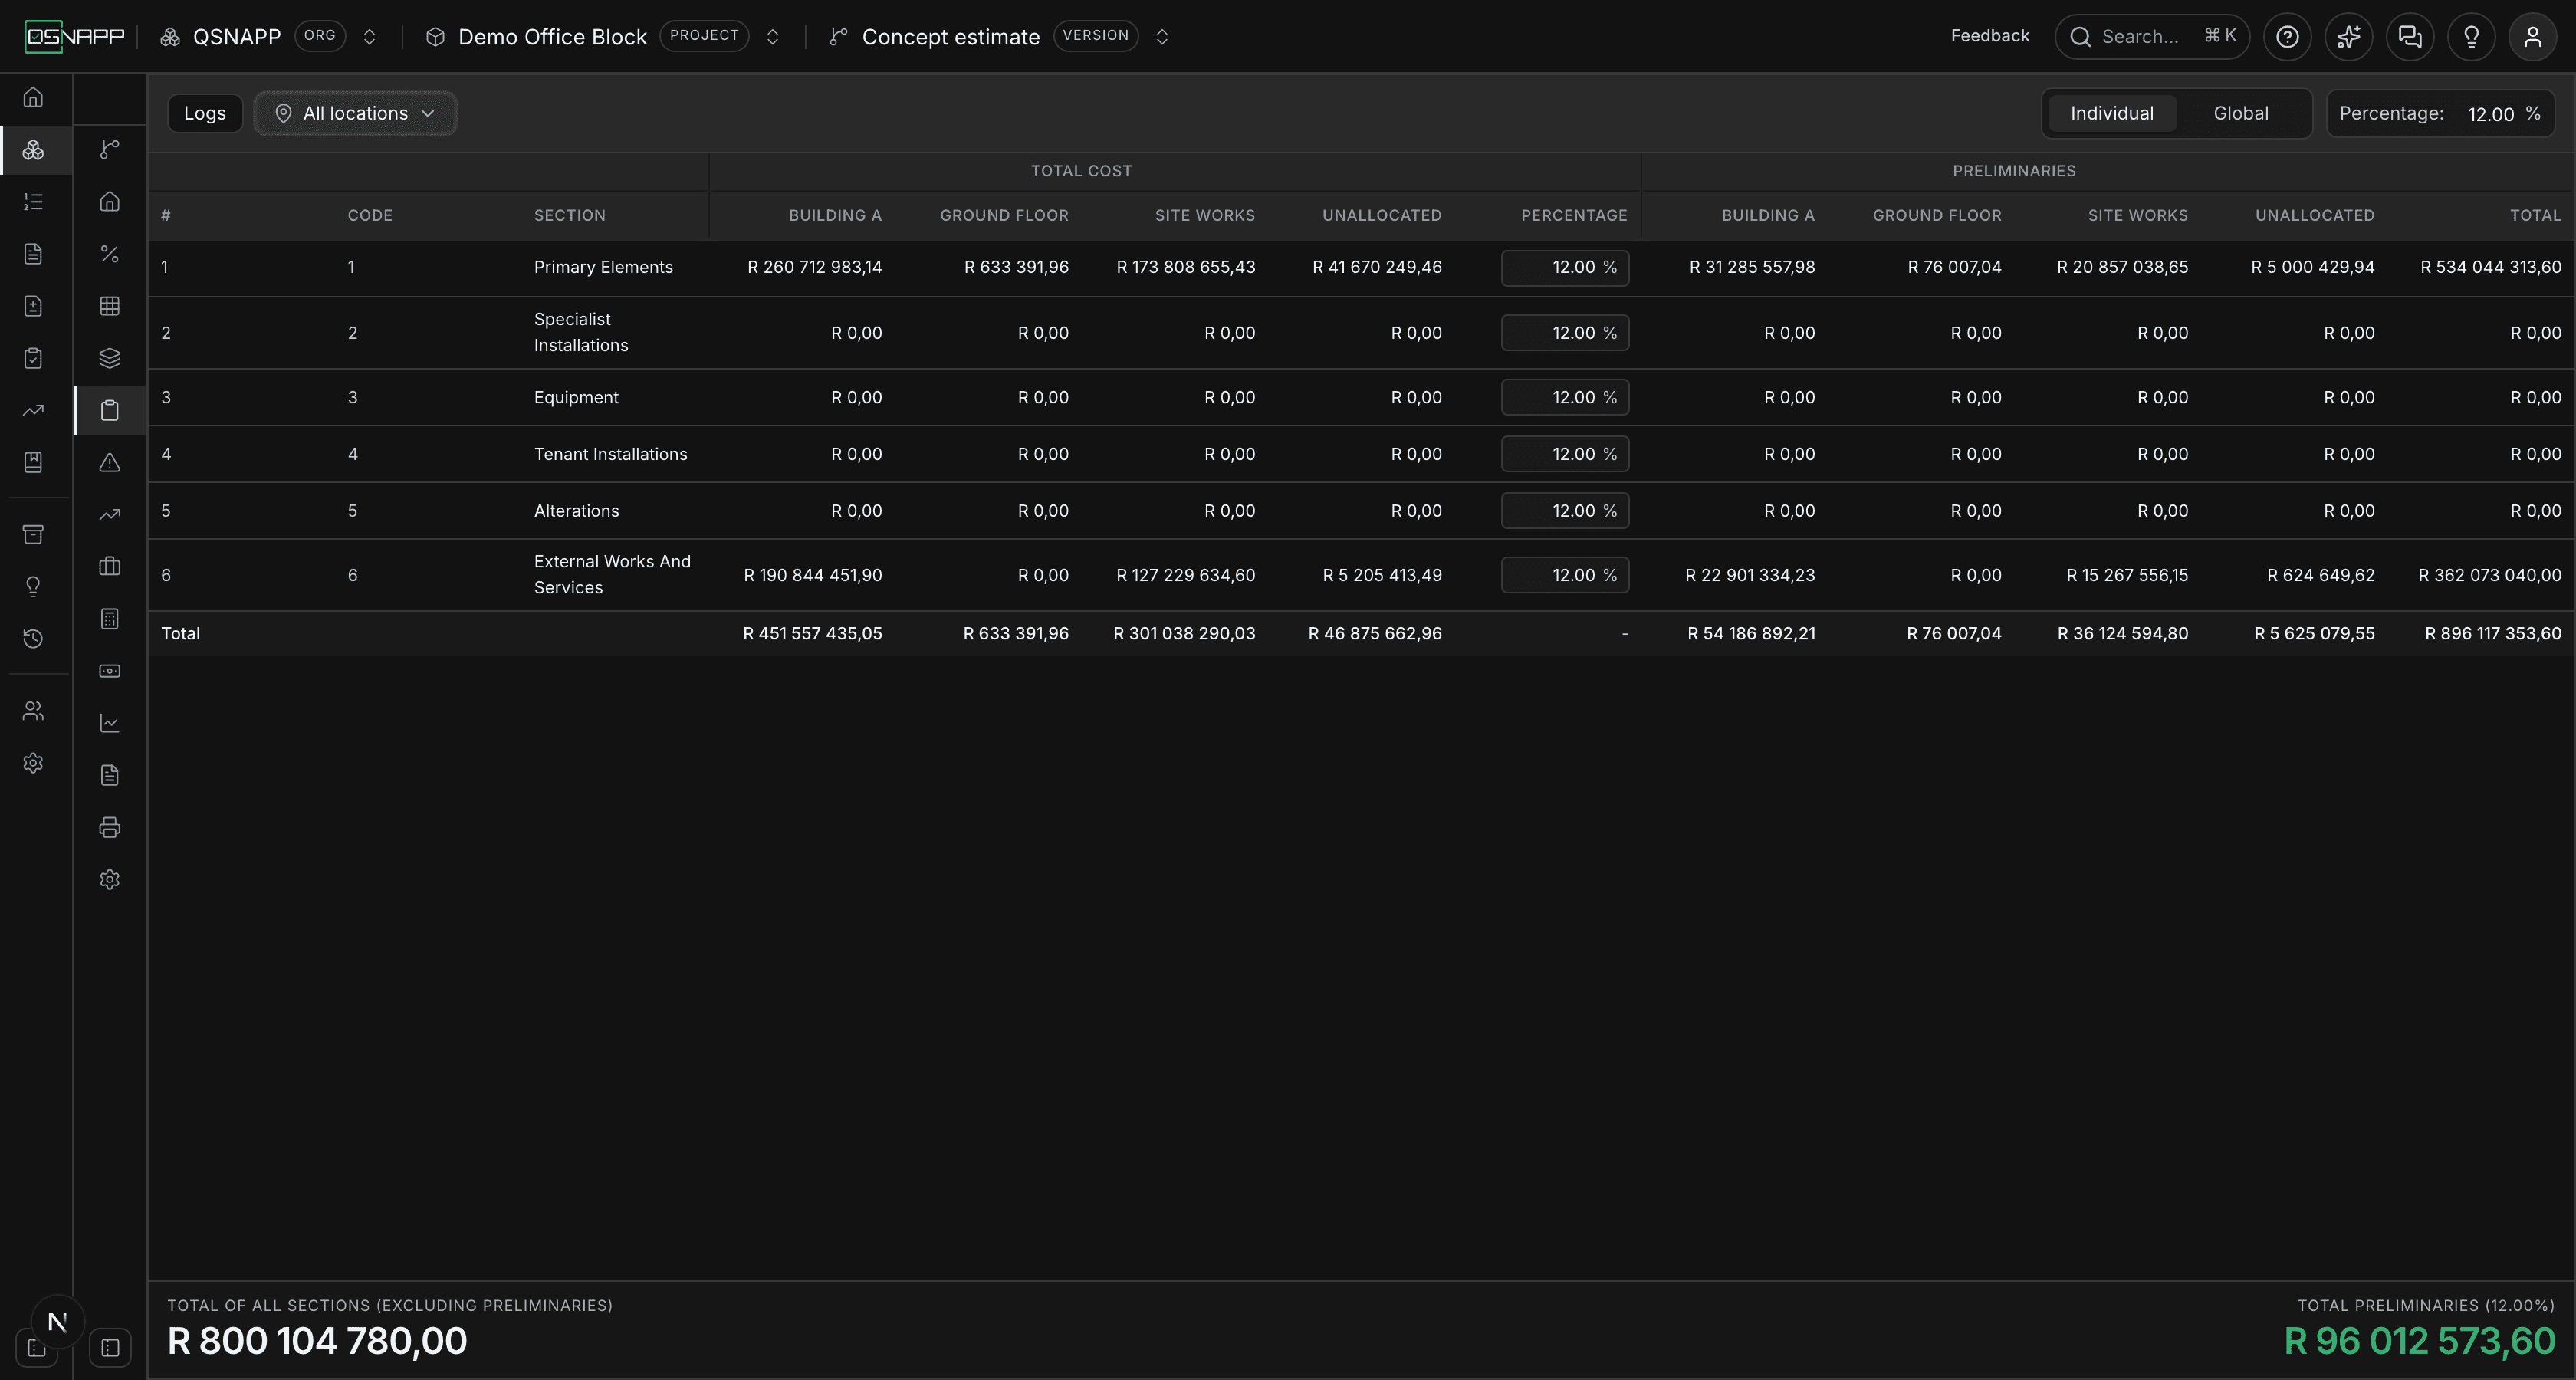
Picking places splits the money columns: Total Cost becomes one column per place, and so does Preliminaries, each place's share being that place's cost times the section's rate. The Percentage column stays as one column however many places are on screen — the rate is the section's, not a building's, which is the rule the elemental grid follows for a rate.
An Unallocatedcolumn appears whenever some of a section's cost sits outside any place. A component measured once for the whole project is not measured “at Unallocated”; it is simply not measured anywhere, and this column is where that shows. It is there so the place columns add up to the total rather than quietly coming to less — and it doubles as a reading of how much of the estimate has not been assigned to a place yet.
Nothing about this view is stored. It is a way of reading the estimate, derived from allocations that already exist, and it resets to Combined when the page is reloaded.
The logs
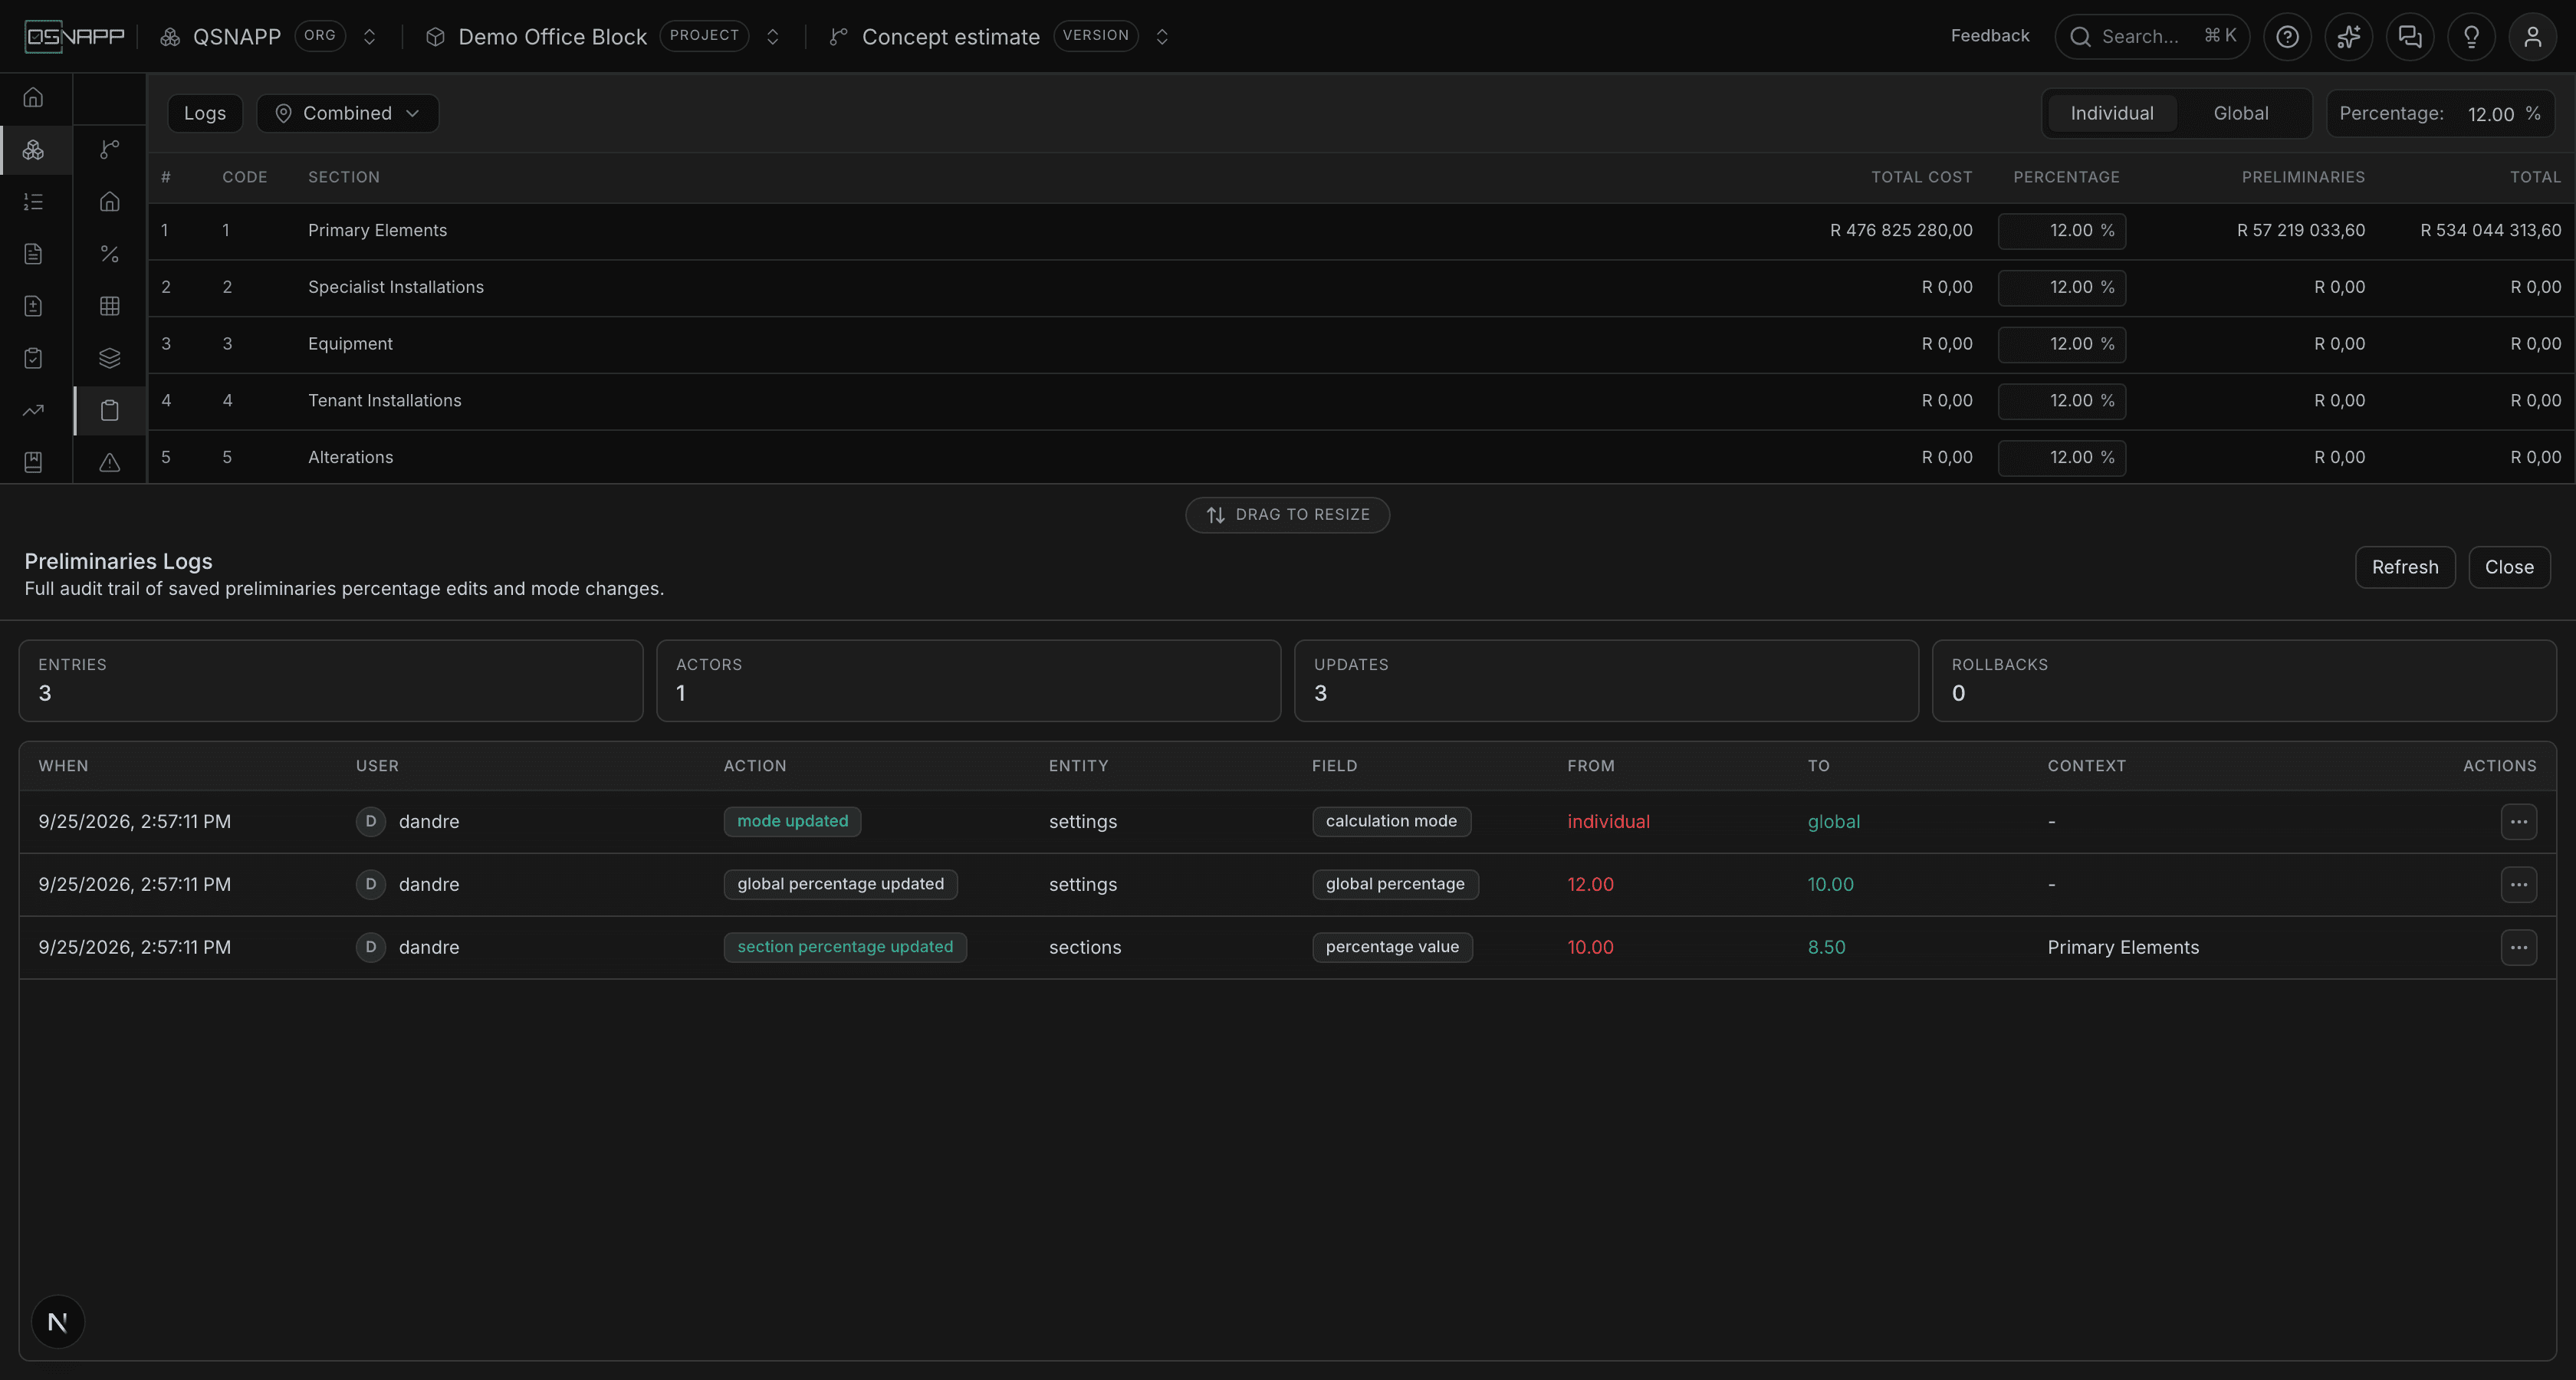
Logsin the toolbar opens a drawer across the bottom of the screen with every saved change to this project's preliminaries: mode changes, global figure changes, section rate changes and rollbacks, newest first, up to the last three hundred. Each entry shows when, who, the action, which field, the figure before and after, and the section where there is one. Four counters at the top summarise it — entries, how many people made them, how many were updates and how many rollbacks.
The log is per project, not per version: it lists changes across every version of the estimate. The drawer can be dragged taller or shorter by its handle, refreshed, and closed with Esc or by clicking outside it.
Only what has been saved is logged. Typing a figure and abandoning it leaves no trace, because it changed nothing.
Take me there
The menu at the end of a log row offers Take me there. For a section change it closes the drawer, switches the screen to Individual, puts the logged figure into that section's box and scrolls to the row, flashing it so you can see which one. For a global figure or a mode change it sets the toolbar to the logged value.
What it does not do is save. It sets the screen up as the log entry describes and leaves you with Save changes showing, so re-applying an old figure is a deliberate act rather than a click in a list.
Rolling a change back
Roll back, on the same menu, restores the figure the entry changed from and saves it at once. It is only offered on the three kinds of entry that record a before and an after — a section rate, the global figure, or the mode — and it is refused if the figure has moved again since that entry was written: rolling back an 8% to 12% when the section now reads 9% would undo somebody else's change, not yours.
A rollback is itself logged, as a field rollback entry, so the trail shows the change and its reversal rather than pretending neither happened.
Where the figure goes next
Everything after this tab reads the rates saved here, with the same 12% fallback for anything unsaved:
- Contingencies are taken on each section plus its preliminaries. The base column on that tab is the Total column on this one.
- Escalation starts from the sections with preliminaries and contingencies added, and Professional fees read the same rates for the base they are calculated off. Total project cost takes the escalated figure, so the preliminaries reach it through those.
- Cash flow carries preliminaries as a line of its own, broken down by section.
- The printed estimate has a Preliminaries section — code, section, section total, the rate and what it comes to — with an optional total line and, if you choose places, a column per place.
One small difference to be aware of: the printed estimate and the overview round each section's preliminaries to the cent before adding them, where this screen adds the unrounded figures. The totals can differ by a cent or two, and neither is wrong.
Who can change what
Reading this tab needs permission to view the project. Saving needs permission to update it: the buttons are shown to everyone who can see the tab, but without that permission the database refuses the write and the screen reports that it was unable to save. Nothing you typed is lost until you leave the page.
The log is written by the same save, under your name, and cannot be edited from the screen.